
USDJPY continues to defy gravity with its recent two-and-a-half-month rally from 114.40, showing limited signs of slowing down. Reinforcing this viewpoint are the soaring simple moving averages (SMAs).
The Ichimoku lines are indicating that positive forces remain active, while the short-term oscillators are reflecting the latest impulses of downward pressures. The MACD is revealing some easing in positive momentum from the beginning of May, while the RSI is gliding lower in the bullish region. Moreover, the stochastic oscillator has regained its negative charge and is promoting the minor pullback in the price.
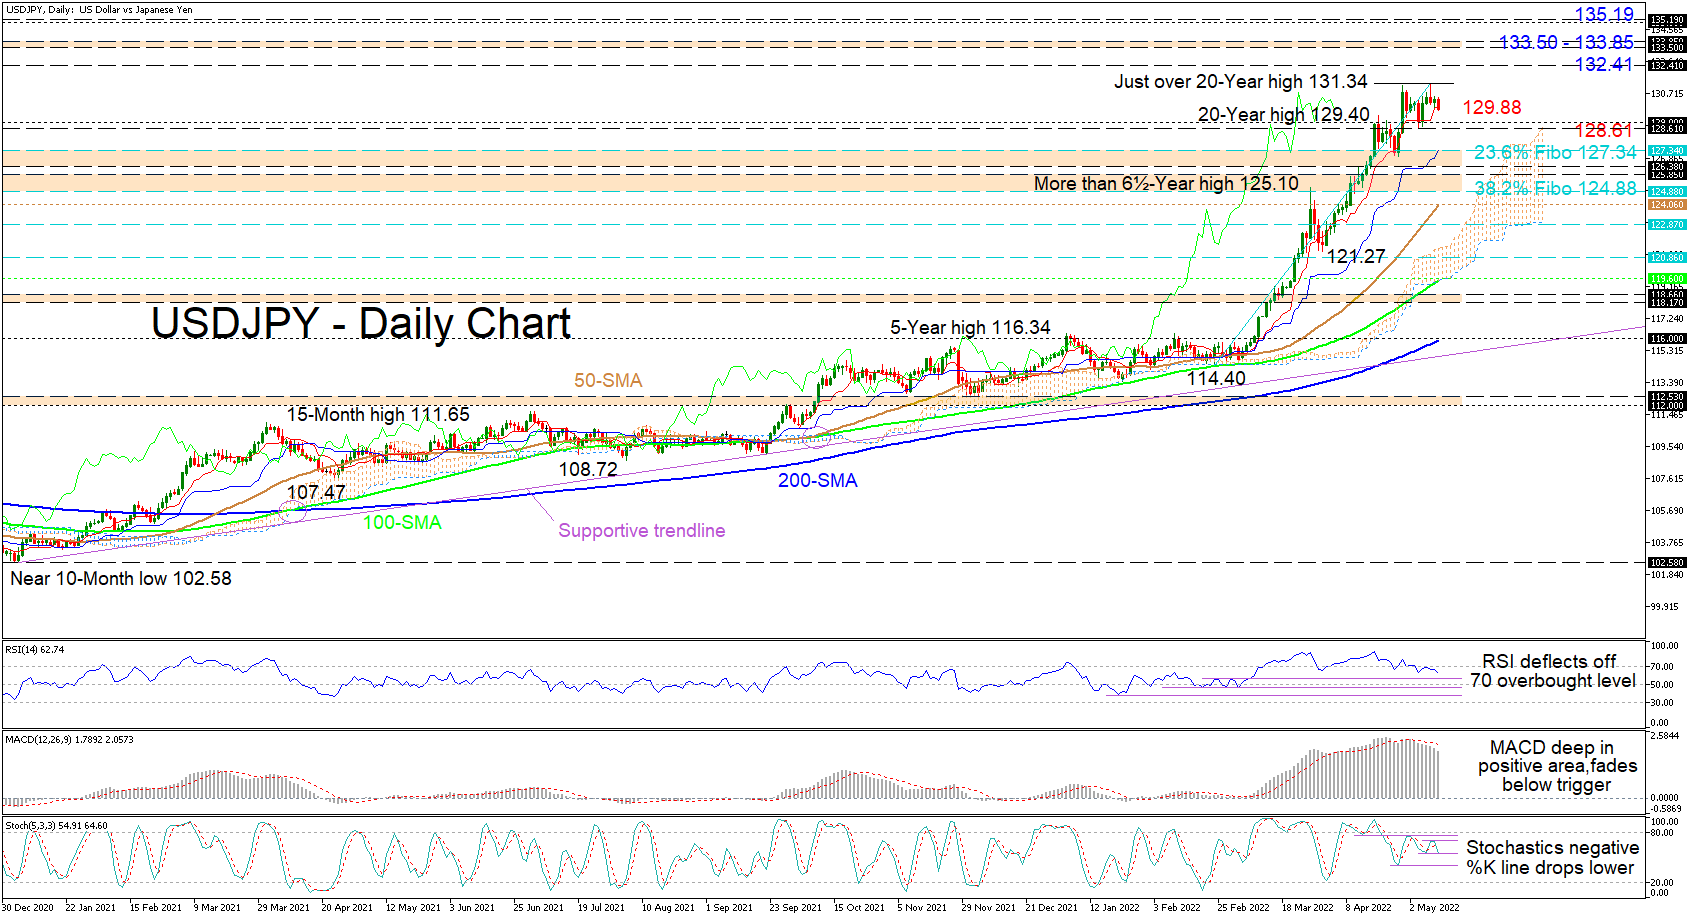
In the event sellers drive the price clearly below the red Tenkan-sen line at 129.88, support could commence from the 129.00 handle and the adjacent 128.61 low. Diving deeper past these nearby obstacles, the bears may confront a support region linking the 127.34 level, which is the 23.6% Fibonacci retracement of the up leg from 114.40 until 131.34, with the 126.38 border that stretches back to early March 2002. If selling interest remains heightened, the pair could then weigh on the support section between the June 2015 peak of 125.85 and the 38.2% Fibo of 124.88.
Alternatively, if buyers create traction off the red Tenkan-sen line at 129.88, initial resistance may transpire from the fresh 20-year high of 131.34. Successfully reviving the positive trajectory, the bulls may jump for the mid-April 2002 high of 132.41 before confronting the 133.50-133.85 resistance band, shaped by the highs over the latter part of March until early April 2002 period. Should the climb in the price endure, the 135.00-135.19 zone could provide the next limitations to the upside, which refers to a one-month period of highs spanning from late January until late February 2002.
Summarizing, USDJPY’s bullish structure remains intact above the congested support boundaries, forming a support buffer zone stretching from 124.88 until 127.34. That said, a price dip beneath the 129.00 handle and the 128.61 low may add credence to an evolution of a deeper pullback.


