
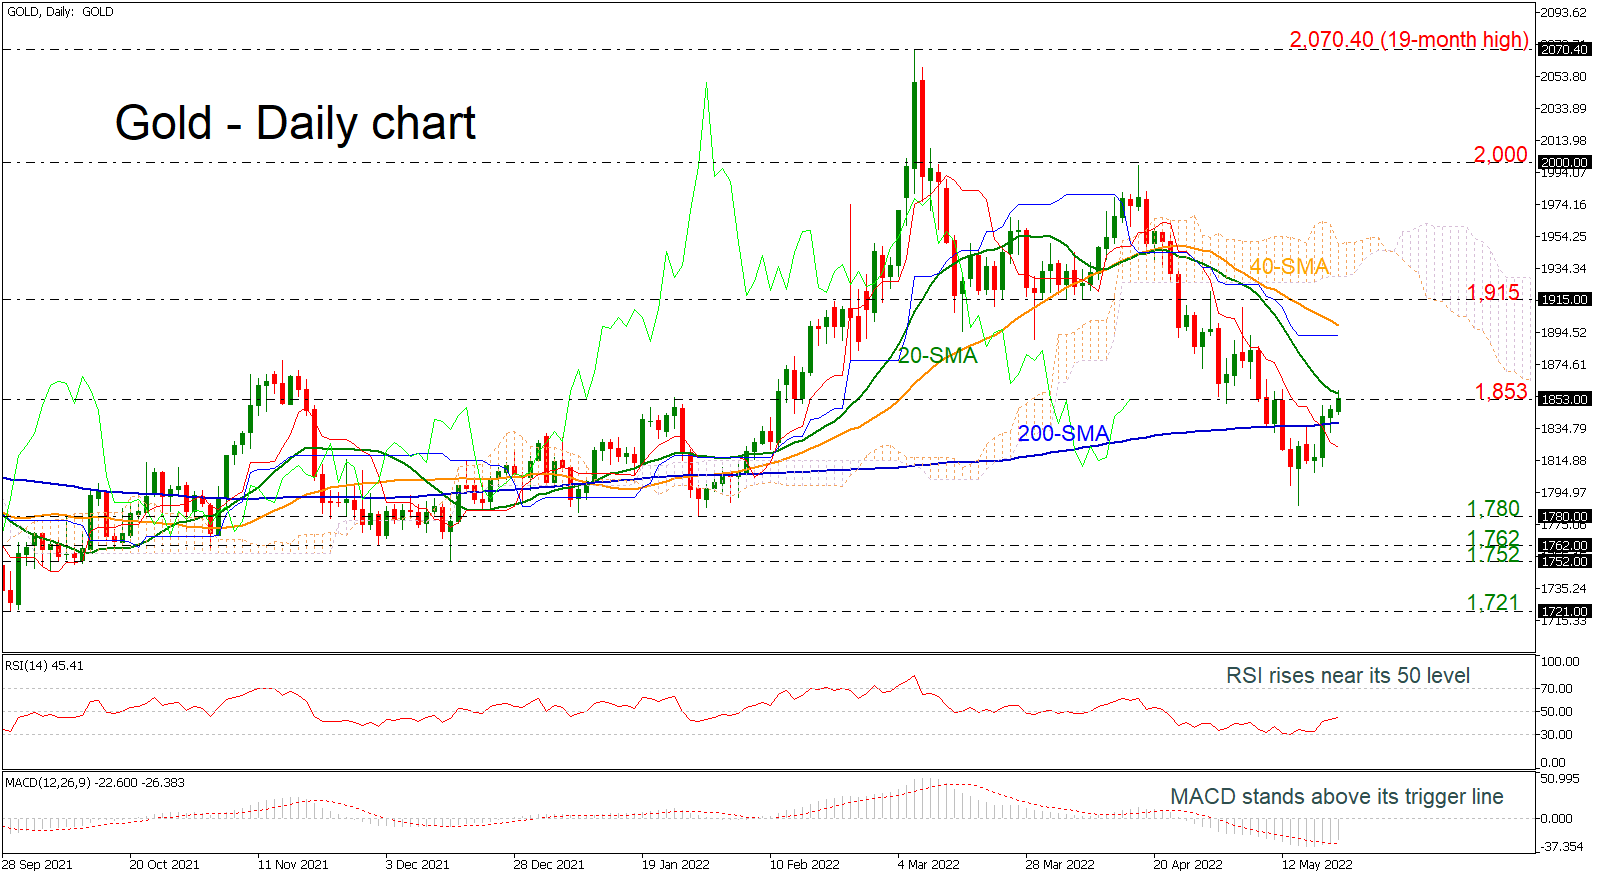
Gold prices are advancing above the 200-day simple moving average (SMA) and find resistance near the 1,853 level and the 20-day SMA at 1,857. The technical indicators are showing some signs for more positive actions. The RSI is approaching the neutral threshold of 50, while the MACD rises above its trigger line.
Should the pair manage to strengthen its positive momentum, the next resistance could come around the 40-day SMA at 1,900 ahead of the 1,915 barrier. A break above this area would shift the bias to a more bullish one and open the way towards the upper boundary of the Ichimoku cloud at 1,960 and the 2,000 psychological mark.
However, if prices are unable to break above the 20-day SMA, the risk would shift back to the downside, with the 200-day SMA at 1,837 coming into focus, as well as the 1,780 support. A drop lower would signal a resumption of the two-month declining movement, meeting the 1,752-1,762 support zone.
All in all, the yellow metal has been developing within a descending movement since March 8 and only a jump above the 2,000 round number may shift the outlook back to bullish again.


