
DXY:
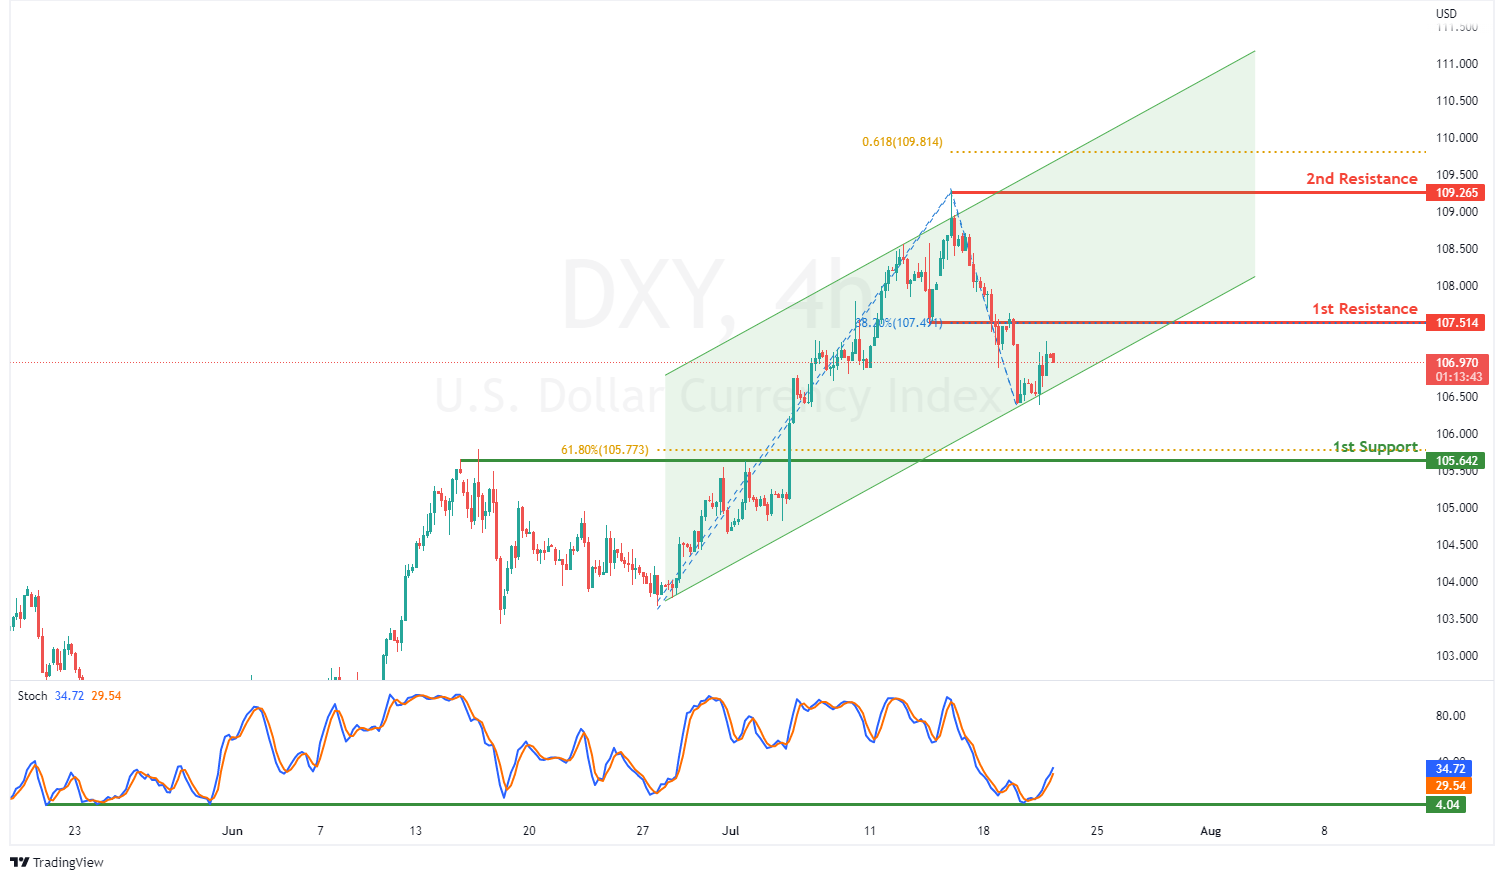
On the H4, with prices moving within the ascending channel and bouncing off the stochastic support, we have a bullish bias that prices will rise to the 1st resistance at 107.514 where the 38.2% fibonacci retracement and pullback resistance are. Once there is upside confirmation of price breaking the 1st resistance structure, we would expect bullish momentum to carry price to 2nd resistance at 109.265 where the swing high resistance and 61.8% fibonacci projection are. Alternatively, prices could drop to 1st support at 105.642 in line with overlap support and 61.8% fibonacci retracement.
Areas of consideration:
- H4 time frame, 1st resistance at 107.514
- H4 time frame, 1st support at 105.642
XAU/USD (GOLD):
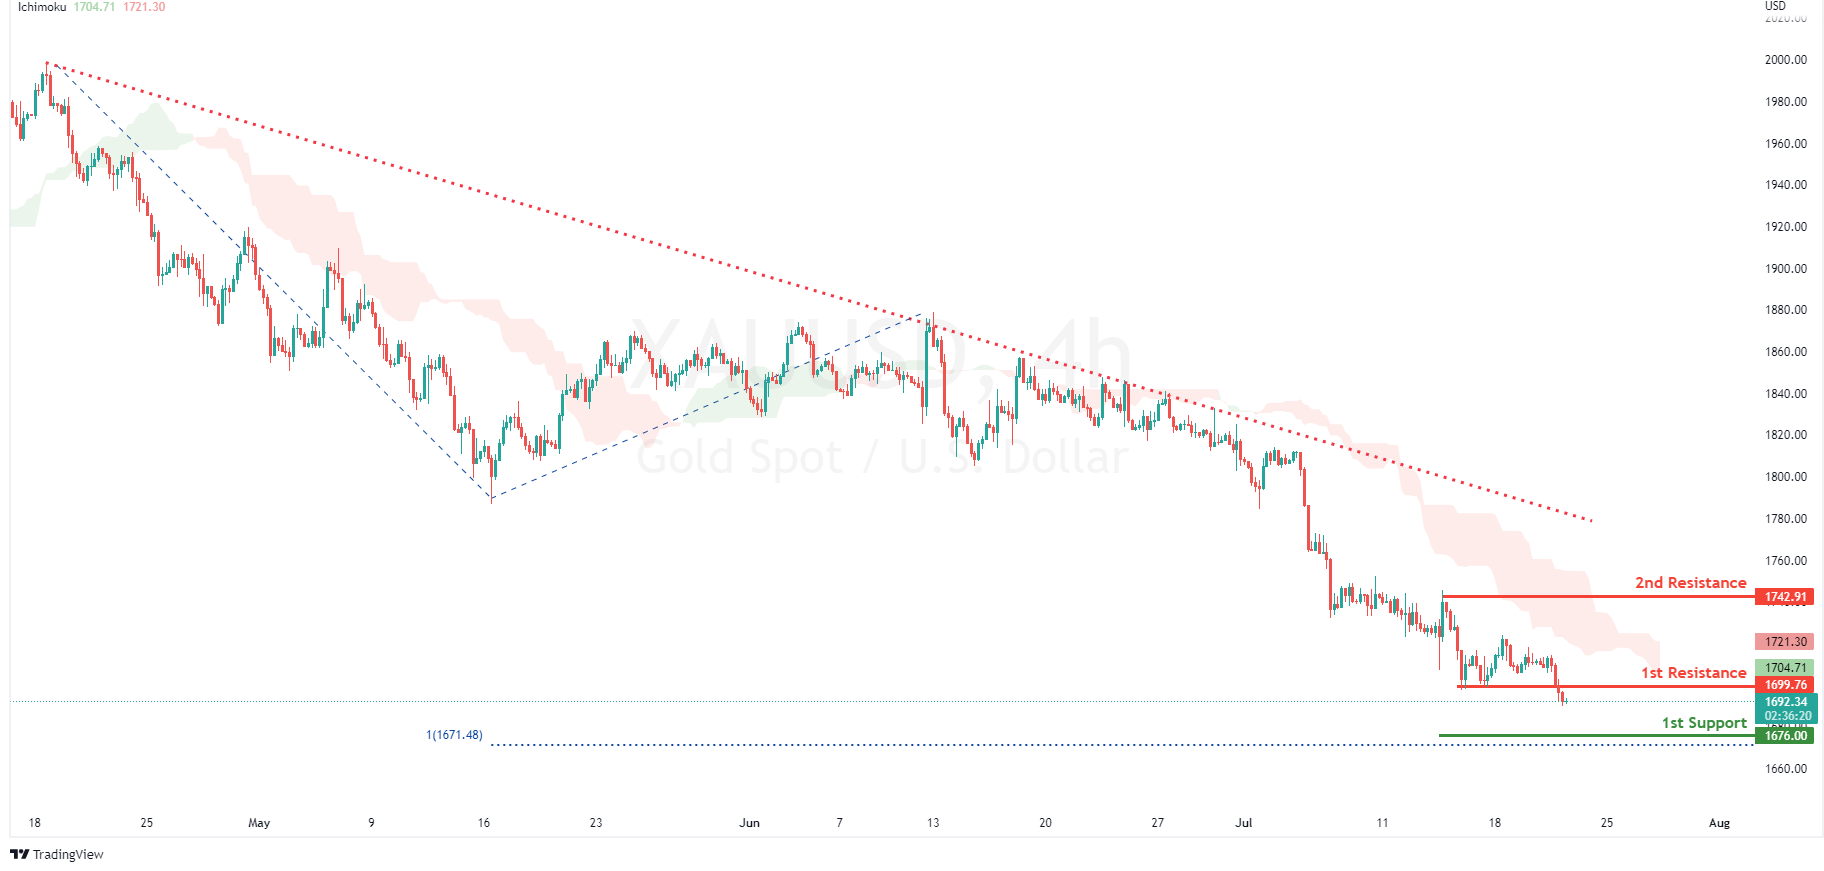
On the H4, with price moving below the ichimoku cloud and in a descending trendline, we have a bearish bias that price will rise and drop from the 1st resistance at 1699.76 where the pullback support is to the 1st support at 1676.00 in line with the 100% fibonacci projection and swing low support on the daily timeframe. Alternatively, price could break 1st resistance structure on the upside and we would expect bullish momentum to carry prices to 2nd resistance at 1742.91 where the swing high resistance is.
Areas of consideration:
- H4 time frame, 1st Resistance at 1699.76
- H4 time frame, 1st Support at 1676.00
GBP/USD:
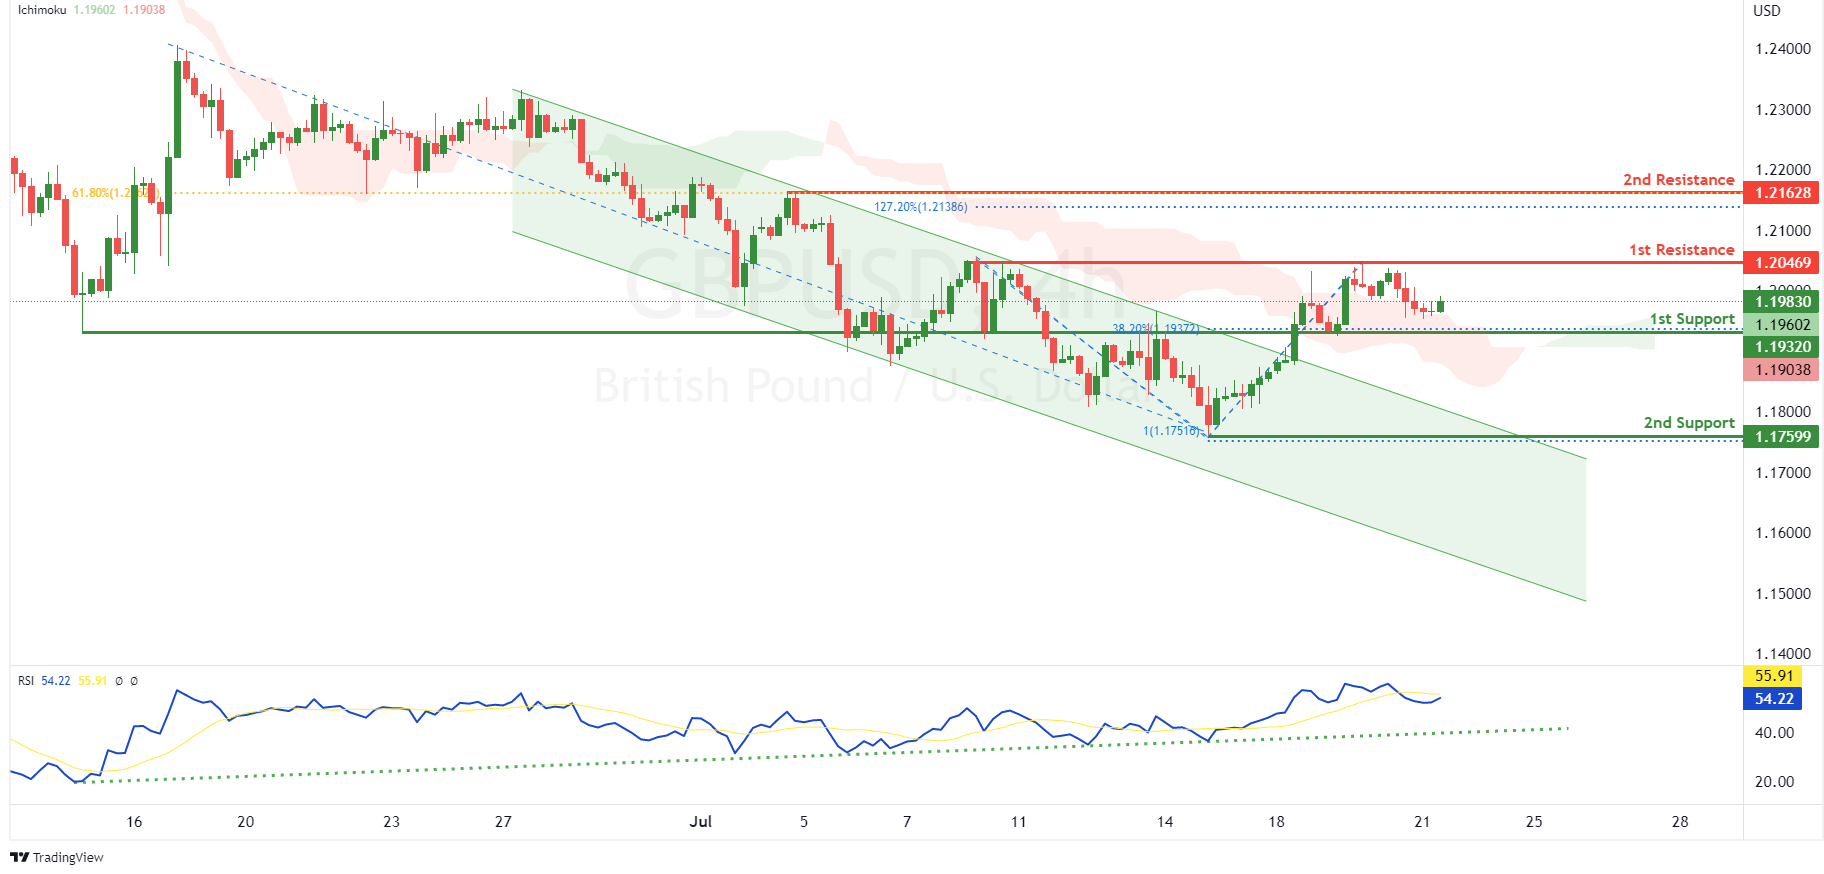
On the H4, with prices bouncing off the ichimoku indicator, RSI moving in an ascending trendline and price has broken out of the descending channel, we have a bullish bias that price will rise to the 1st resistance at 1.20469 where the swing high resistance is. Once there is upside confirmation that price has broken the 1st resistance, we would expect bullish momentum to carry prices to 2nd resistance at 1.21628 where the swing high resistance, 61.8% fibonacci retracement and 127.2% fibonacci extension are. Alternatively, price could drop to the 1st support at 1.19320 where the pullback support and 38.2% fibonacci retracement are. Should price break 1st support, we would have a bearish bias that price will drop to 2nd support at 1.17599 in line with swing low support and 100% fibonacci projection.
Areas of consideration:
- H4 1st resistance at 1.20469
- H4 1st support at 1.19320
USD/CHF:
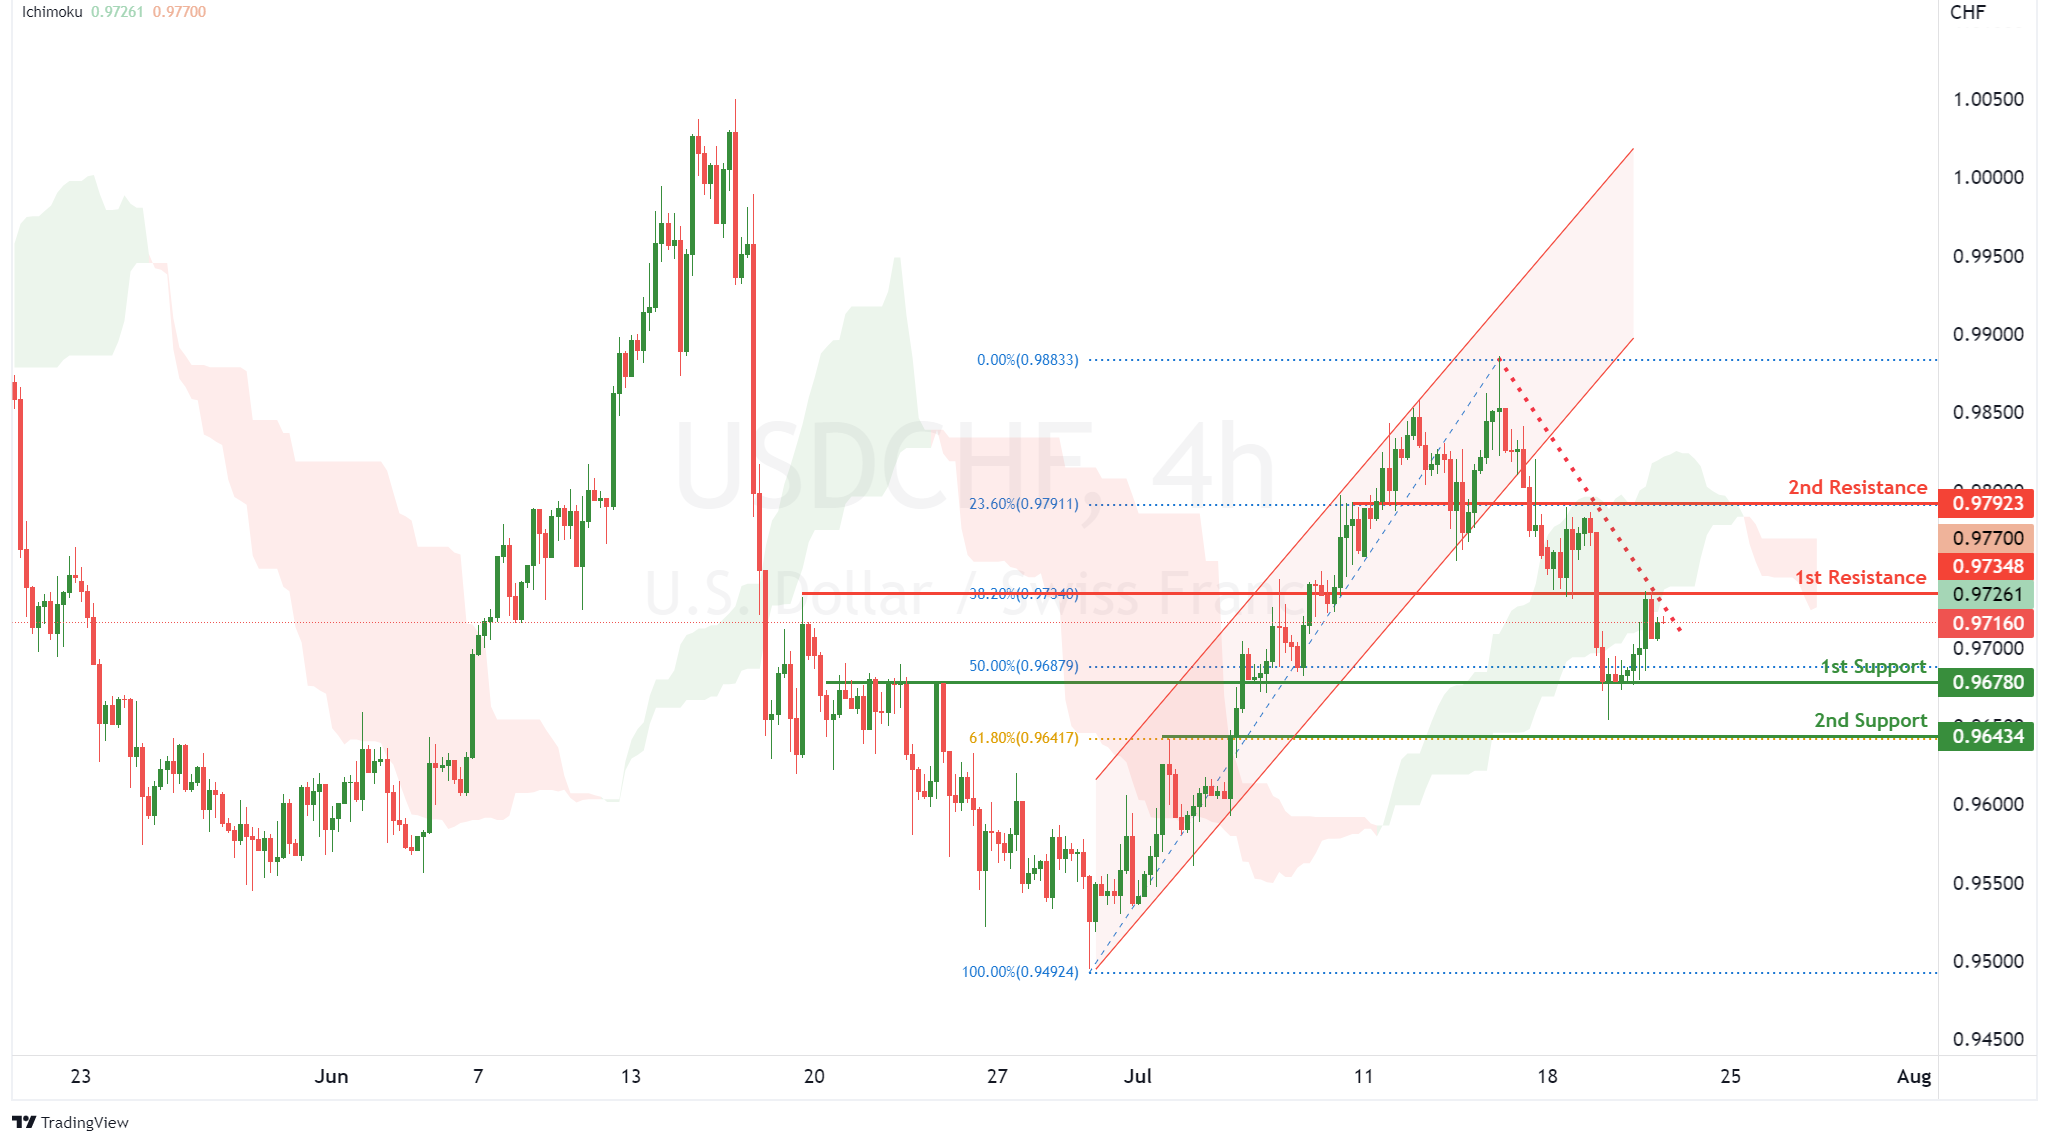
On the H4, with price breaking the bullish channel, moving along the descending channel and crossing over the the ichimoku indicator, we have a bearish bias that price might drop from our 1st resistance at 0.97348 where the pullback resistance is to our 1st support at 0.96780, which is in line with the 50% fibonacci retracement. If the price continues going down, the price may drop to our 2nd support at 0.96434, which is in line with 61.8% fibonacci retracement. Alternatively, price may break 1st resistance and head for 2nd resistance at 0.97923 where the 23.6% fibonacci retracement is.
Areas of consideration
- 1st resistance level at 0.97348
- 1st support level at 0.96780
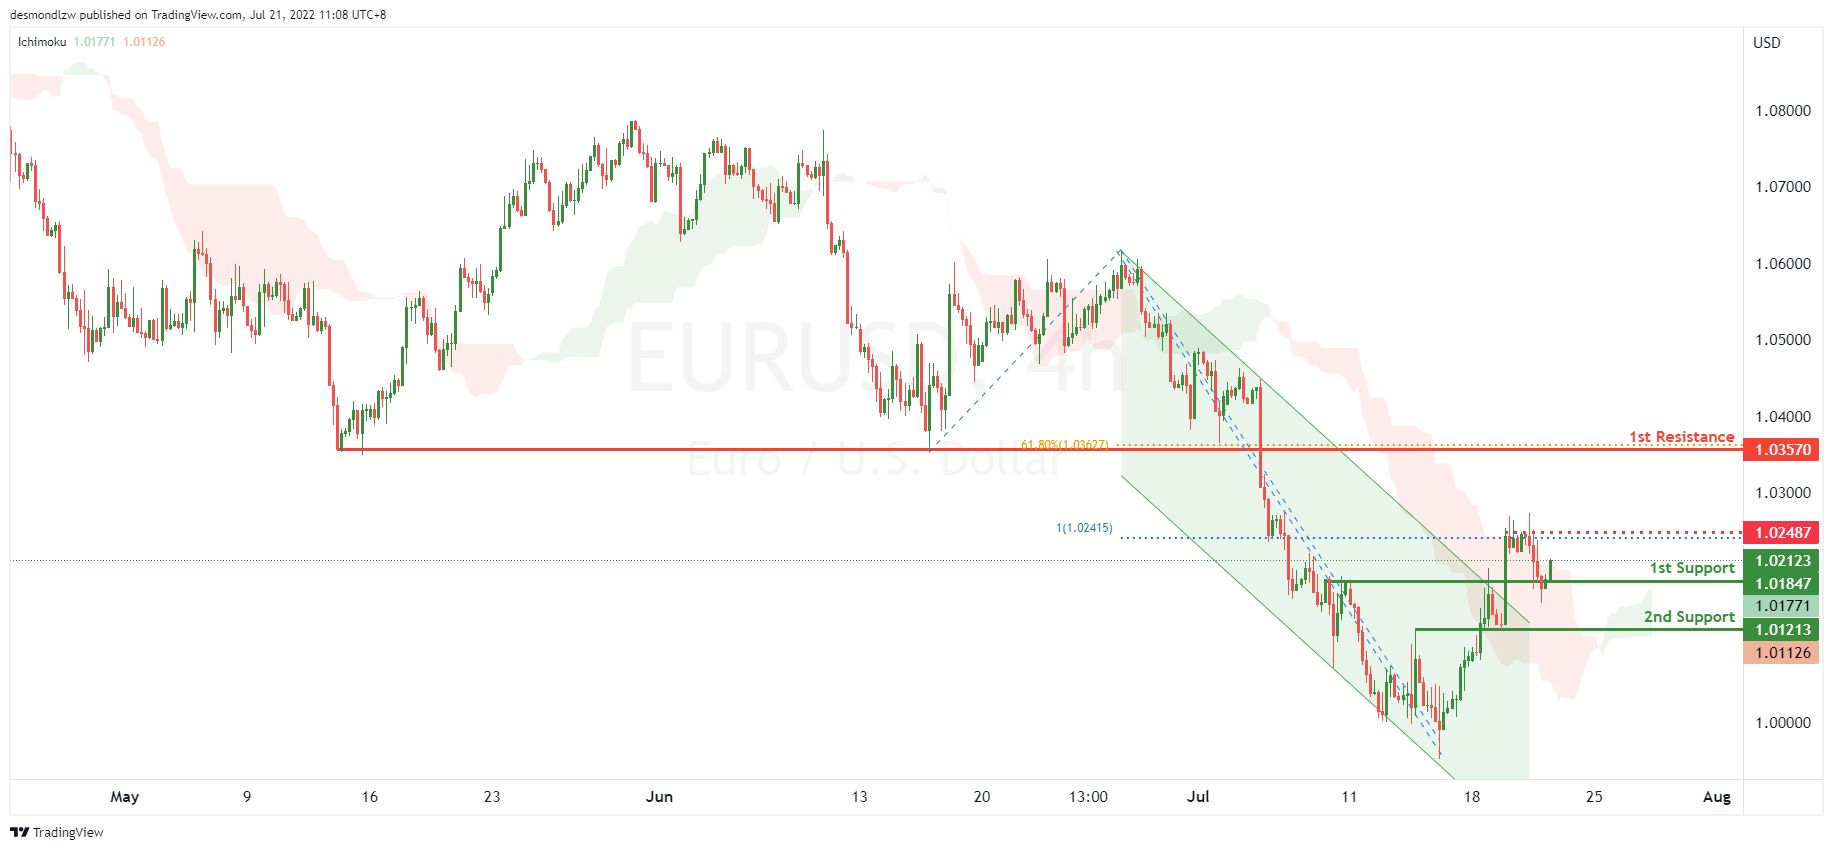
EUR/USD :
On the H4, with price moving above the ichimoku cloud and breaking out of the descending trend channel, we have a bullish bias that price will continue to rise from the 1st support at 1.01847 at the overlap support. If price breaks above the intermediary resistance at 1.02487 in line with the 100% fibonacci projection, we have upside confirmation that price will continue to rise to the 1st resistance at 1.03570 at the pullback resistance in line with the 61.8% fibonacci retracement. Alternatively, price may reverse off the 1st support and drop to the 2nd support at 1.01213 at the overlap support.
Areas of consideration :
- H4 1st resistance at 1.03570
- H4 1st support at 1.01920
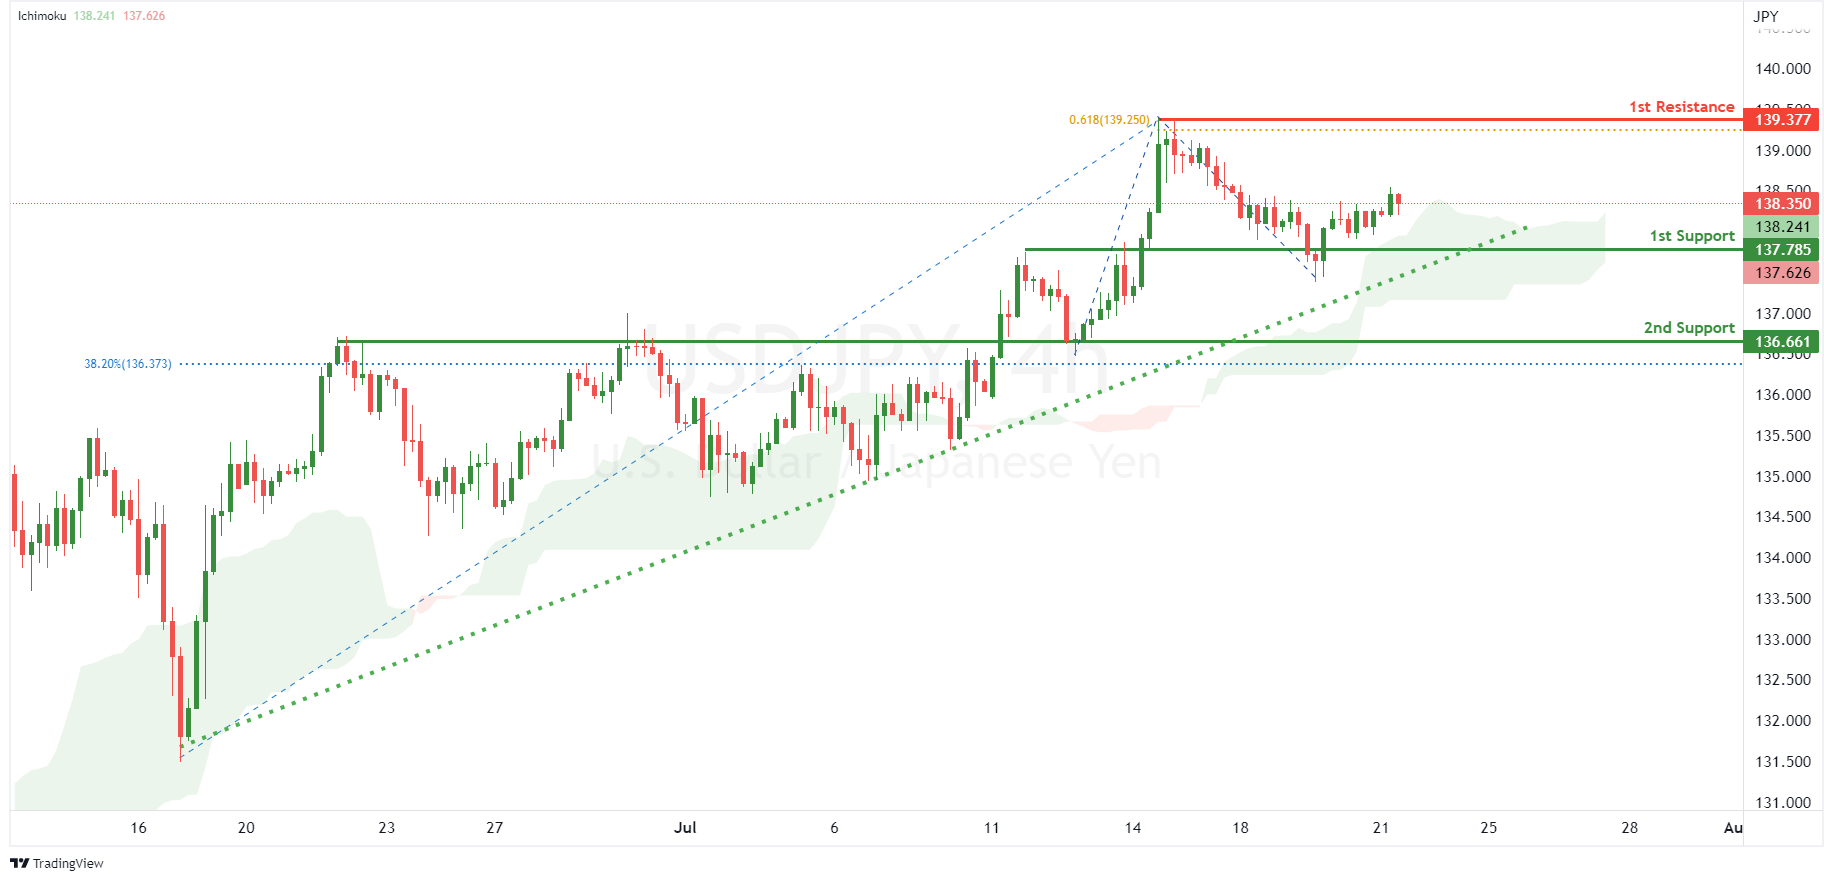
USD/JPY:
On the H4, with price moving above the ichimoku indicator and along the ascending trendline, we have a bullish bias that price will rise to our 1st resistance at 139.377 where the 61.8% fibonacci projection and swing high resistance are from our 1st support at 137.785 in line with pullback support. Alternatively, prices could break 1st support structure and drop to 2nd support at 136.661 where the overlap support and 38.2% fibonacci retracement are.
Areas of consideration:
- H4 time frame, 1st resistance at 139.377
- H4 time frame, 1st support at 137.785
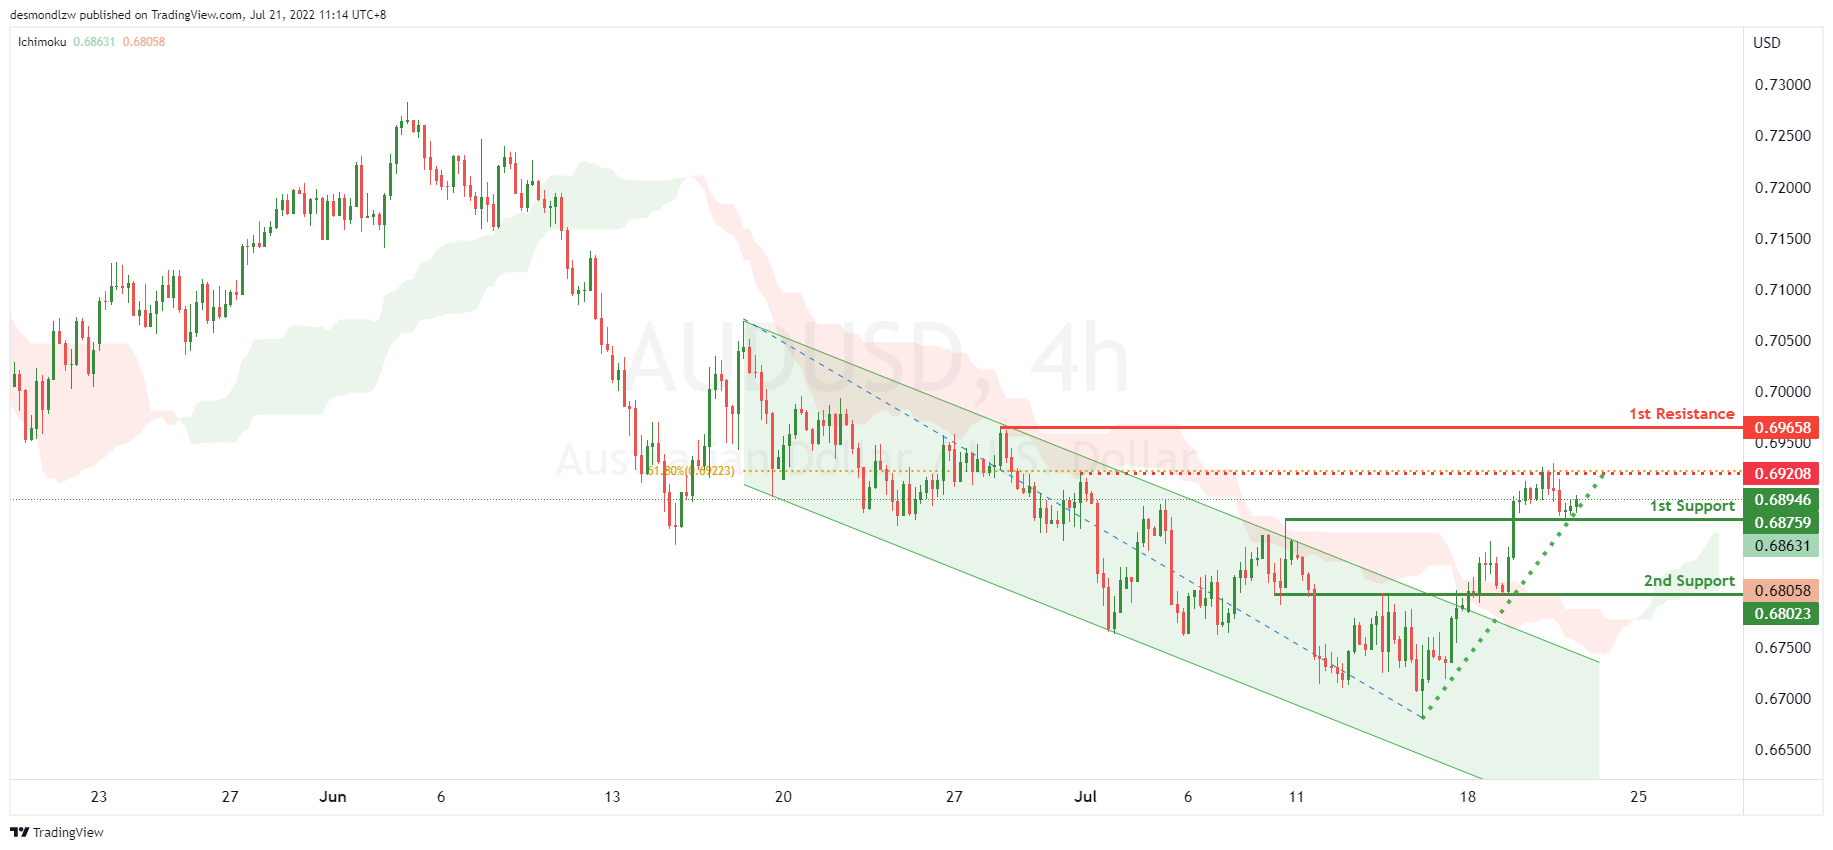
AUD/USD:
On the H4, with price moving above the ichimoku cloud, moving in an ascending support and breaking out of the descending trend channel, we have a bullish bias that price will rise from the 1st resistance at 0.68759 at the overlap resistance. If price rises and breaks the intermediary resistance at 0.69213 in line with the 61.8% fibonacci retracement, we will have upside confirmation that price will continue to rise to the 2nd resistance at 0.69658 at the swing high. Alternatively, price may reverse off the 1st resistance and drop to the 1st support at 0.68023 at the overlap support.
Areas of consideration
- H4 1st resistance at 0.68759
- H4 1st support at 0.68023
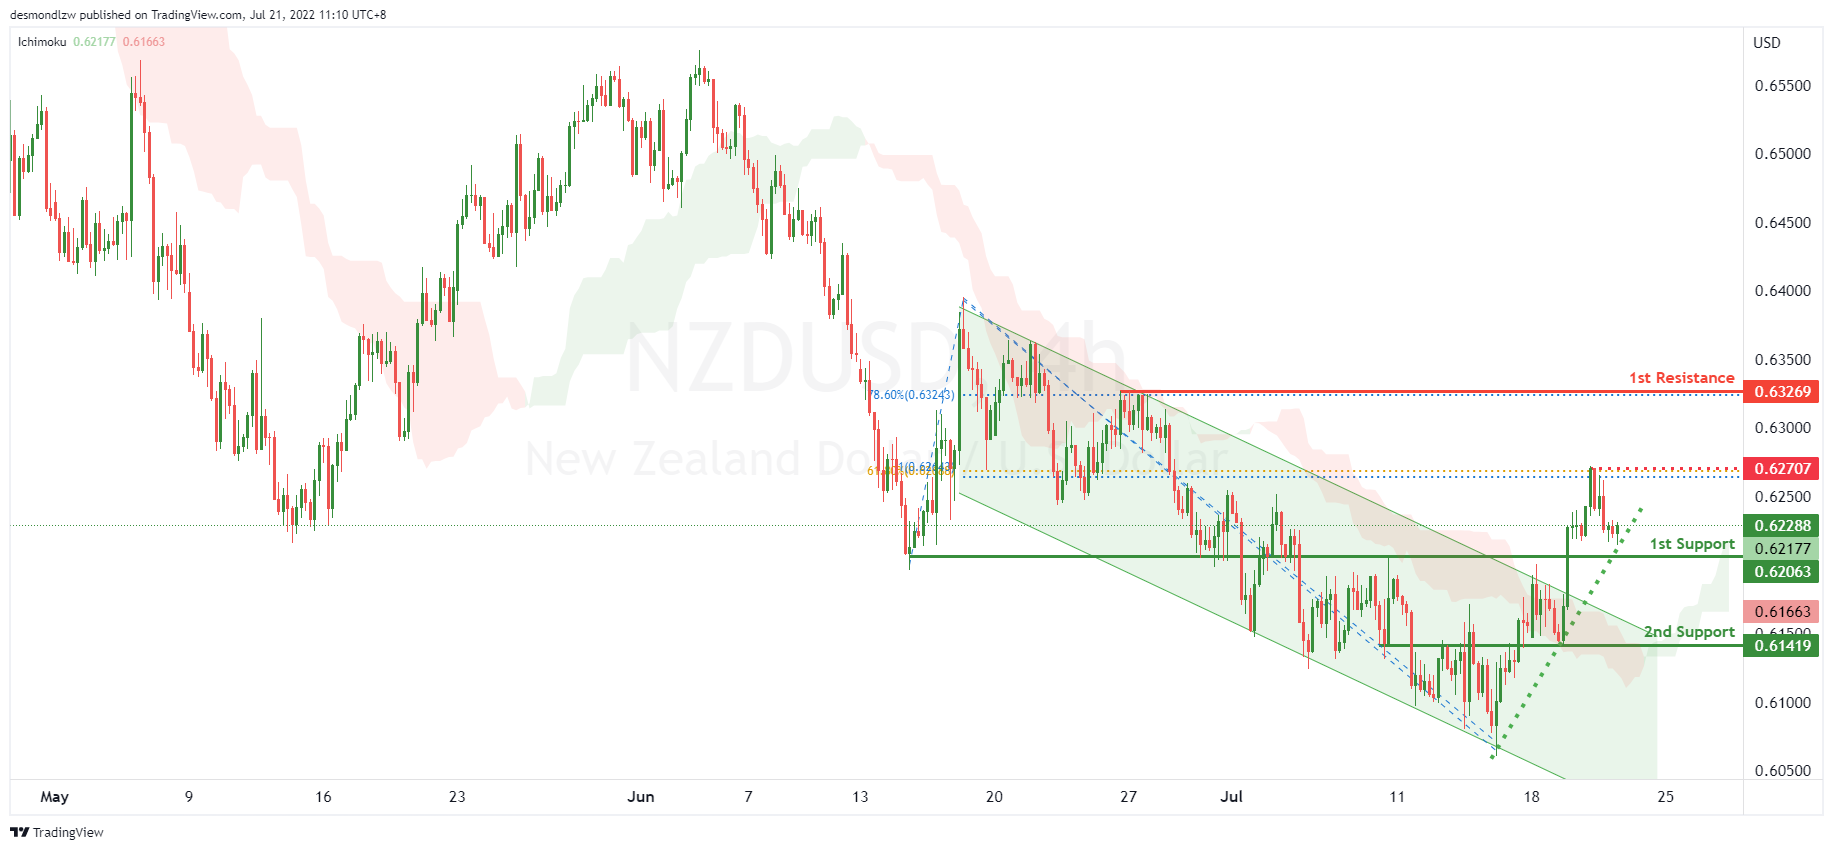
NZD/USD:
On the H4, with price recently breaking the descending trend channel, short term ascending support and moving above the ichimoku cloud, we have a bullish bias that price will rise from the 1st support at 0.62177 at the overlap support. If price breaks the intermediary resistance at 0.62707 at the swing high in line with the 61.8% fibonacci retracement and 100% fiboancci projection, we will have upside confirmation that price will rise to the 1st resistance at 0.63269 at the swing high in line with the 78.6% fibonacci retracement. Alternatively, price may break the support structure at the 1st support and drop to the 2nd support at 0.61419 at the pullback support.
Areas of consideration:
- H4 time frame, 1st support at 0.62177
- H4 time frame, 1st resistance at 0.63269
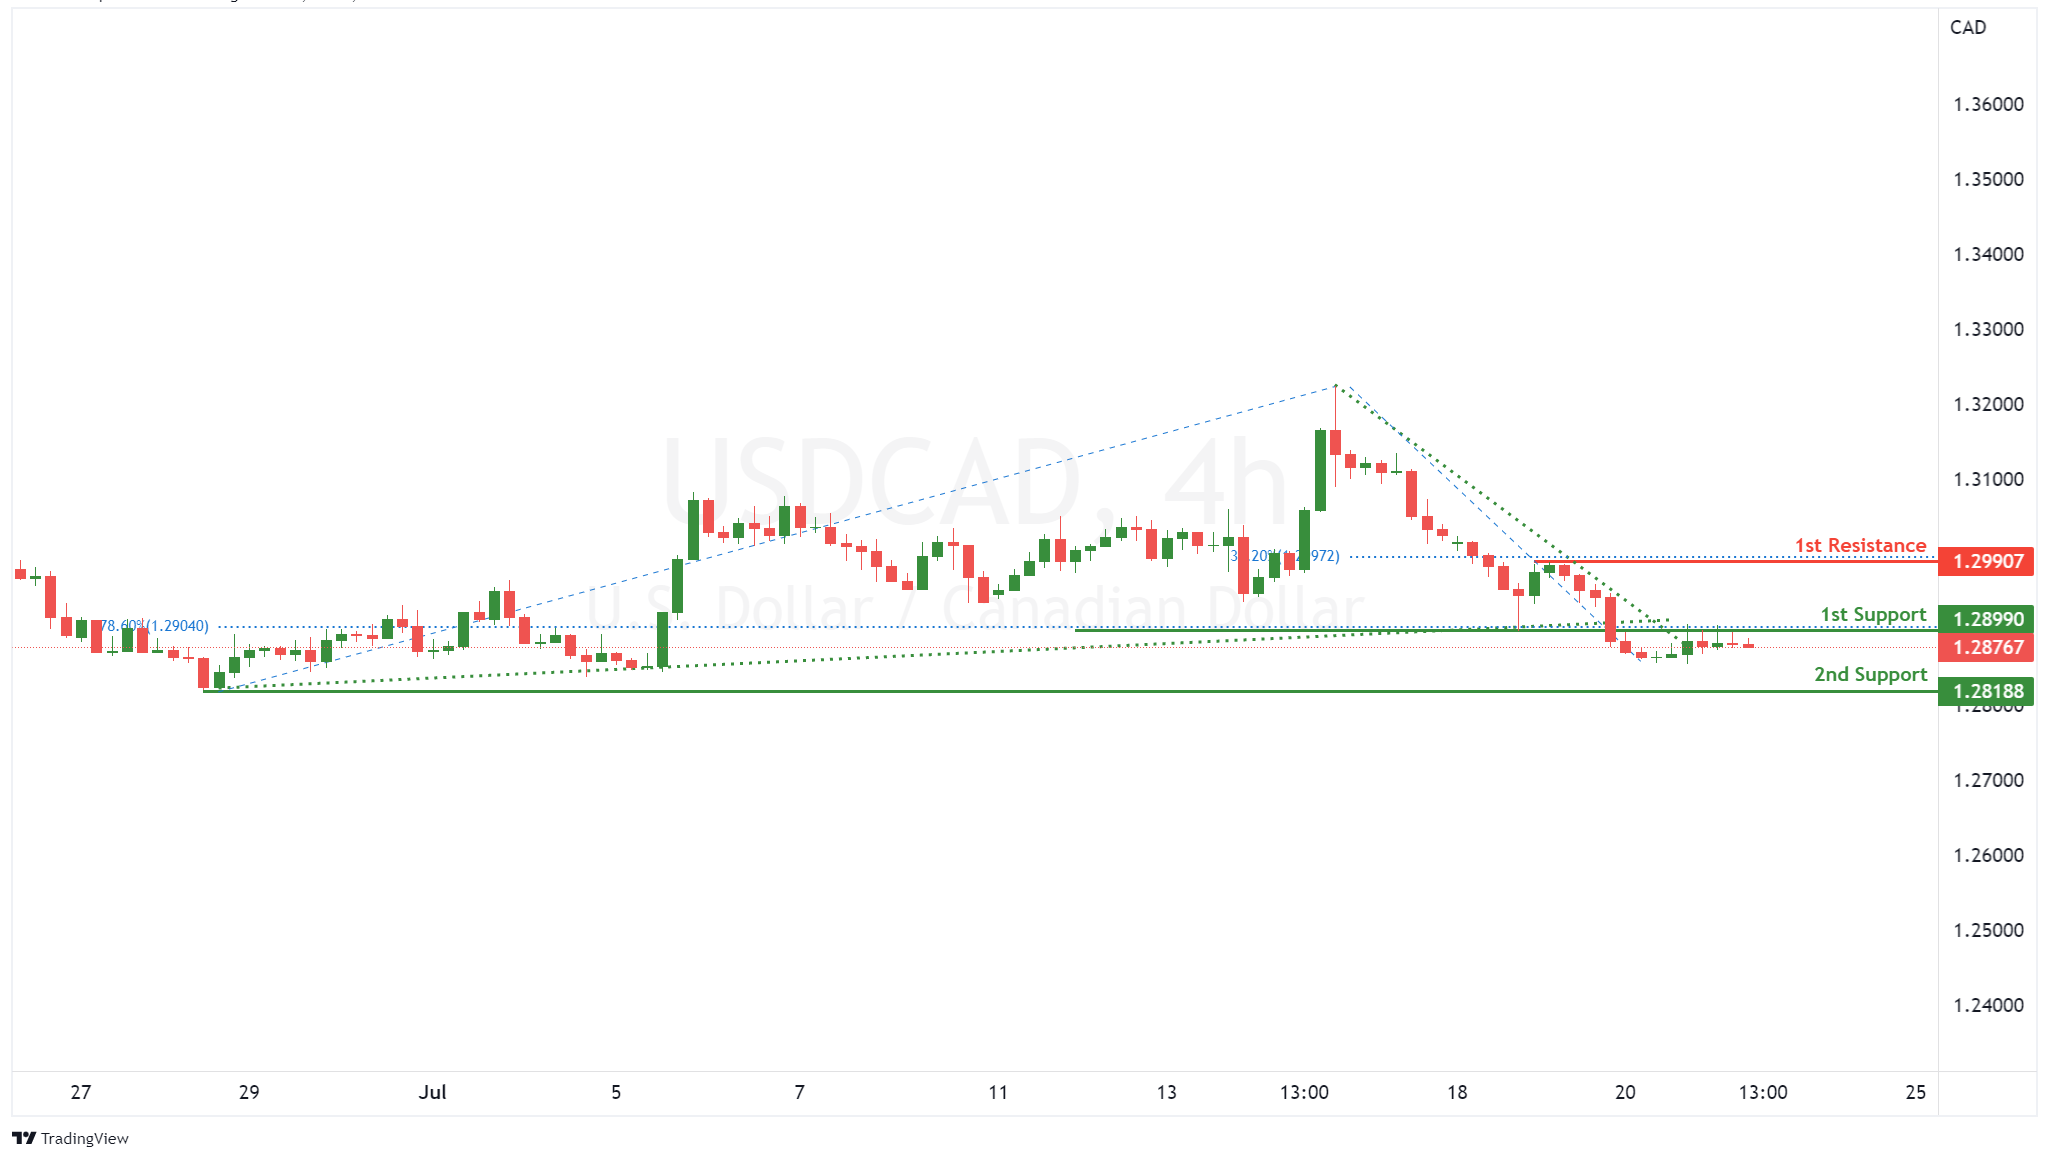
USD/CAD:
On the H4, prices seem to be range bound although it broke the key resistance level at 1.307. It came back down forming a descending trend with a bearish bias currently testing at the 50% fibonacci retracement level. If prices break 1.285 level, it may pullback further to test at the 61.8% fibonacci retracement level. Alternatively if price bounces off this support level, it may look to test at the next key level at 61.8% fibonacci retracement
Areas of consideration:
- H4 time frame, 2nd support at 1.2780
- H4 time frame, 1st support at 1.2873
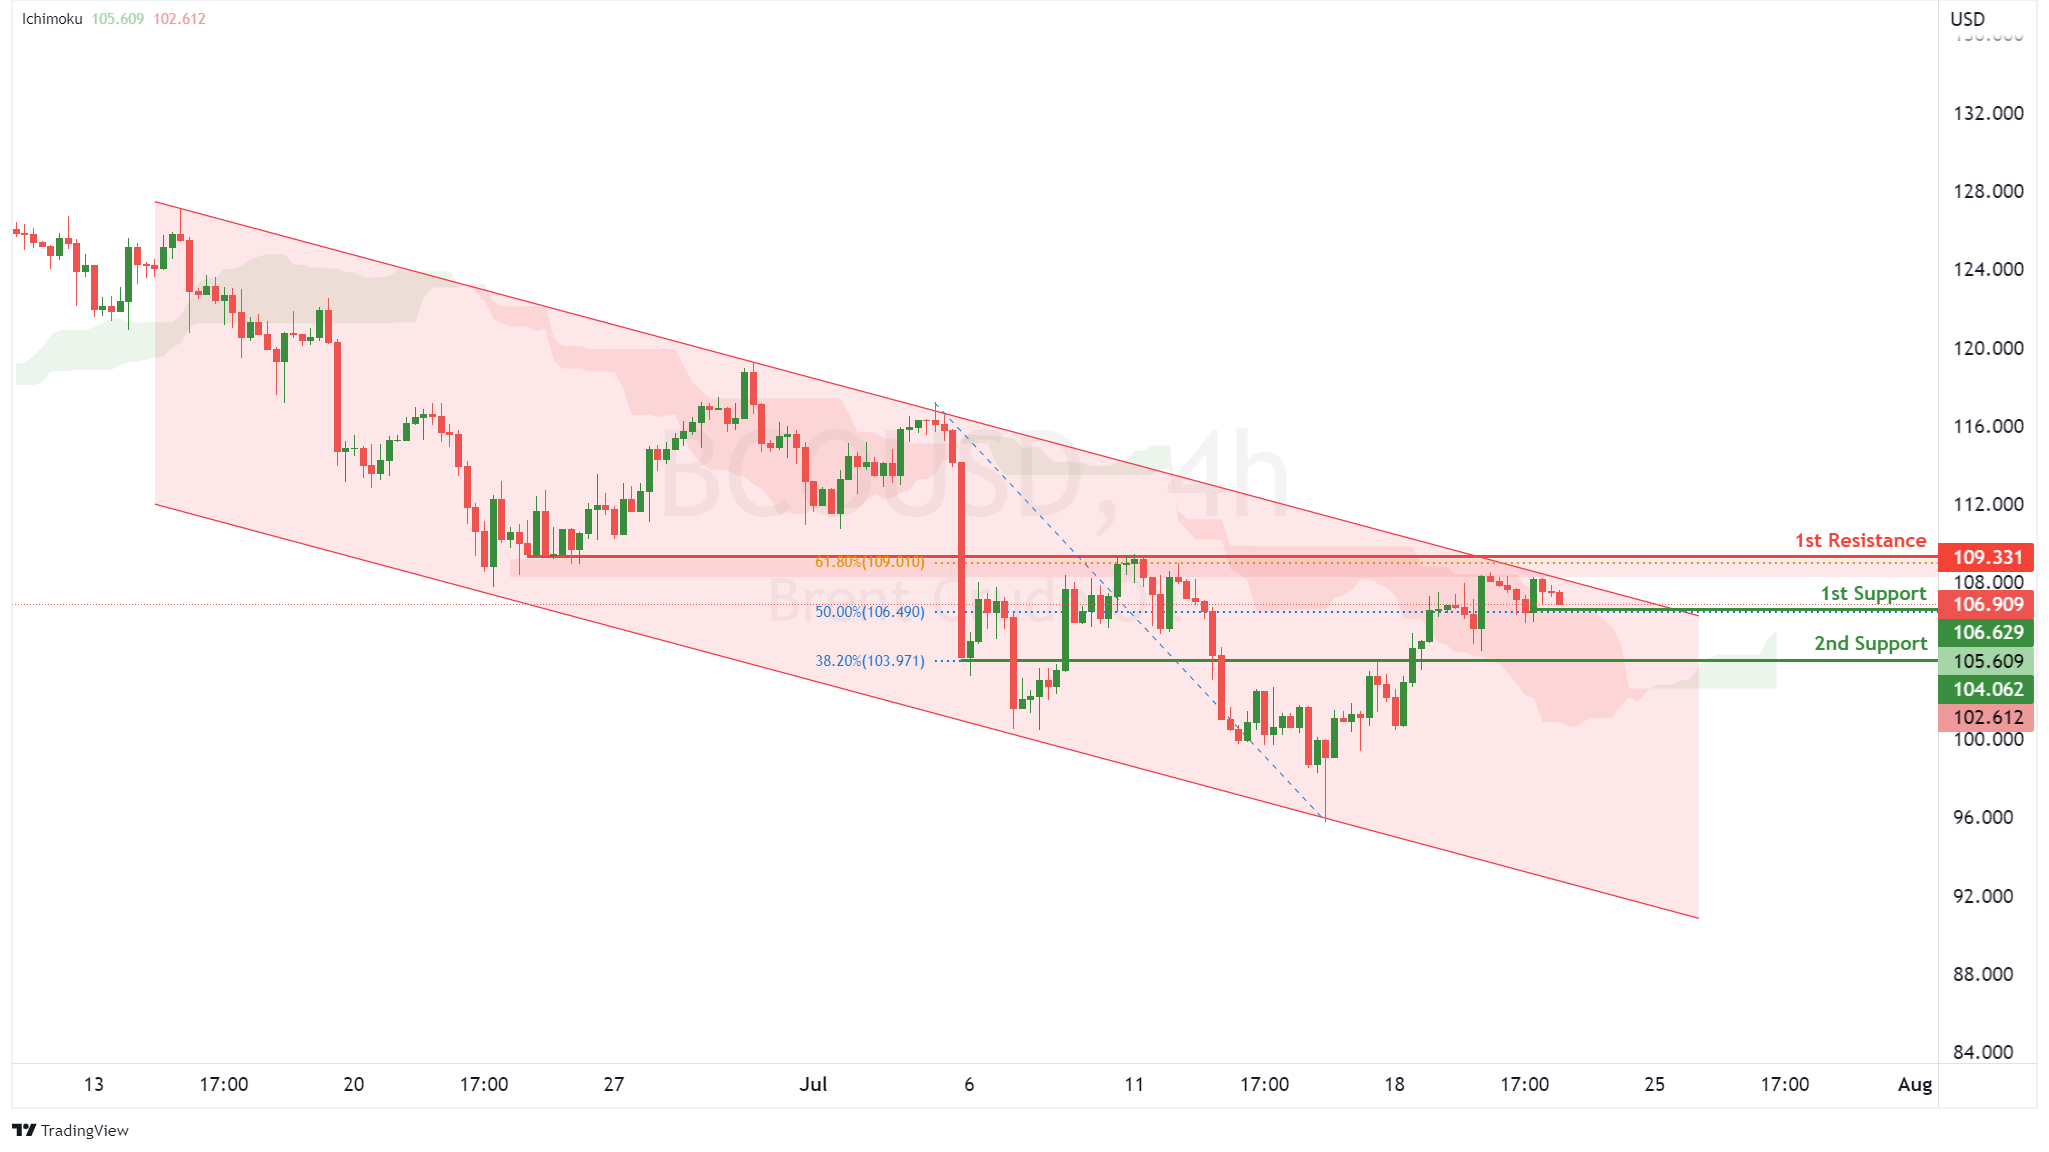
OIL:
On the H4, with price moving along the descending channel and testing the overlap resistance, we have a bearish bias that price might drop from our 1st support at 106.629, which is in line with 50% retracement to 2nd support at 104.062, where the 38.2% fibonacci retracement is. Alternatively, price may rise to 1st resistance at 109.331 in line with 61.8% fibonacci retracement and overlap resistance.
Areas of consideration:
- H4 time frame, 1st support of 106.629
- H4 time frame, 2nd support of 104.062
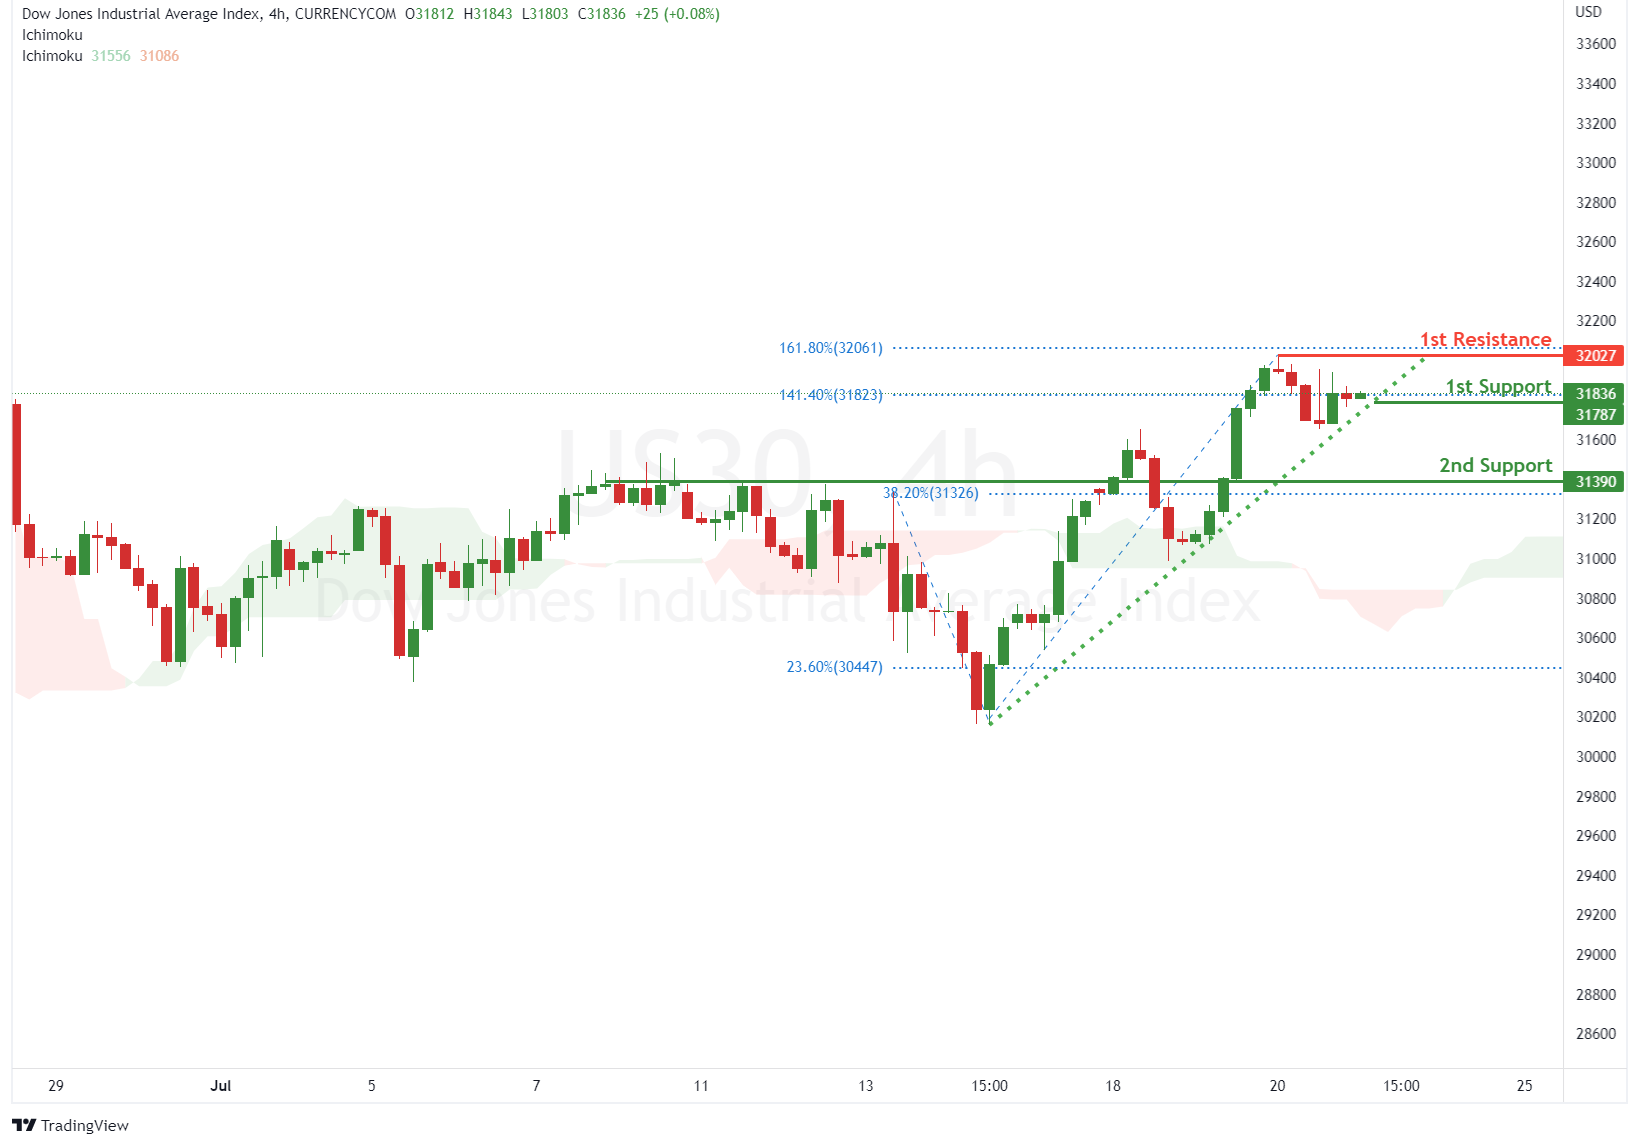
Dow Jones Industrial Average:
On the H4, with price moving in a ascending trendline and moving above ichimoku cloud, we have a bullish bias that price might rise from our 1st support at 31787, which is in line with 141.4% fibonacci retracement to our 1st resistance at 32034, which is in line with 161.8% fibonacci retracement. Alternatively, price may reverse off the 1st support and drop to the 2nd support at 31390, which is in line with the 38.2% fibonacci retracement.
Areas of consideration:
- H4 time frame, 1st support of 31787
- H4 time frame, 1st resistance at 32034


