
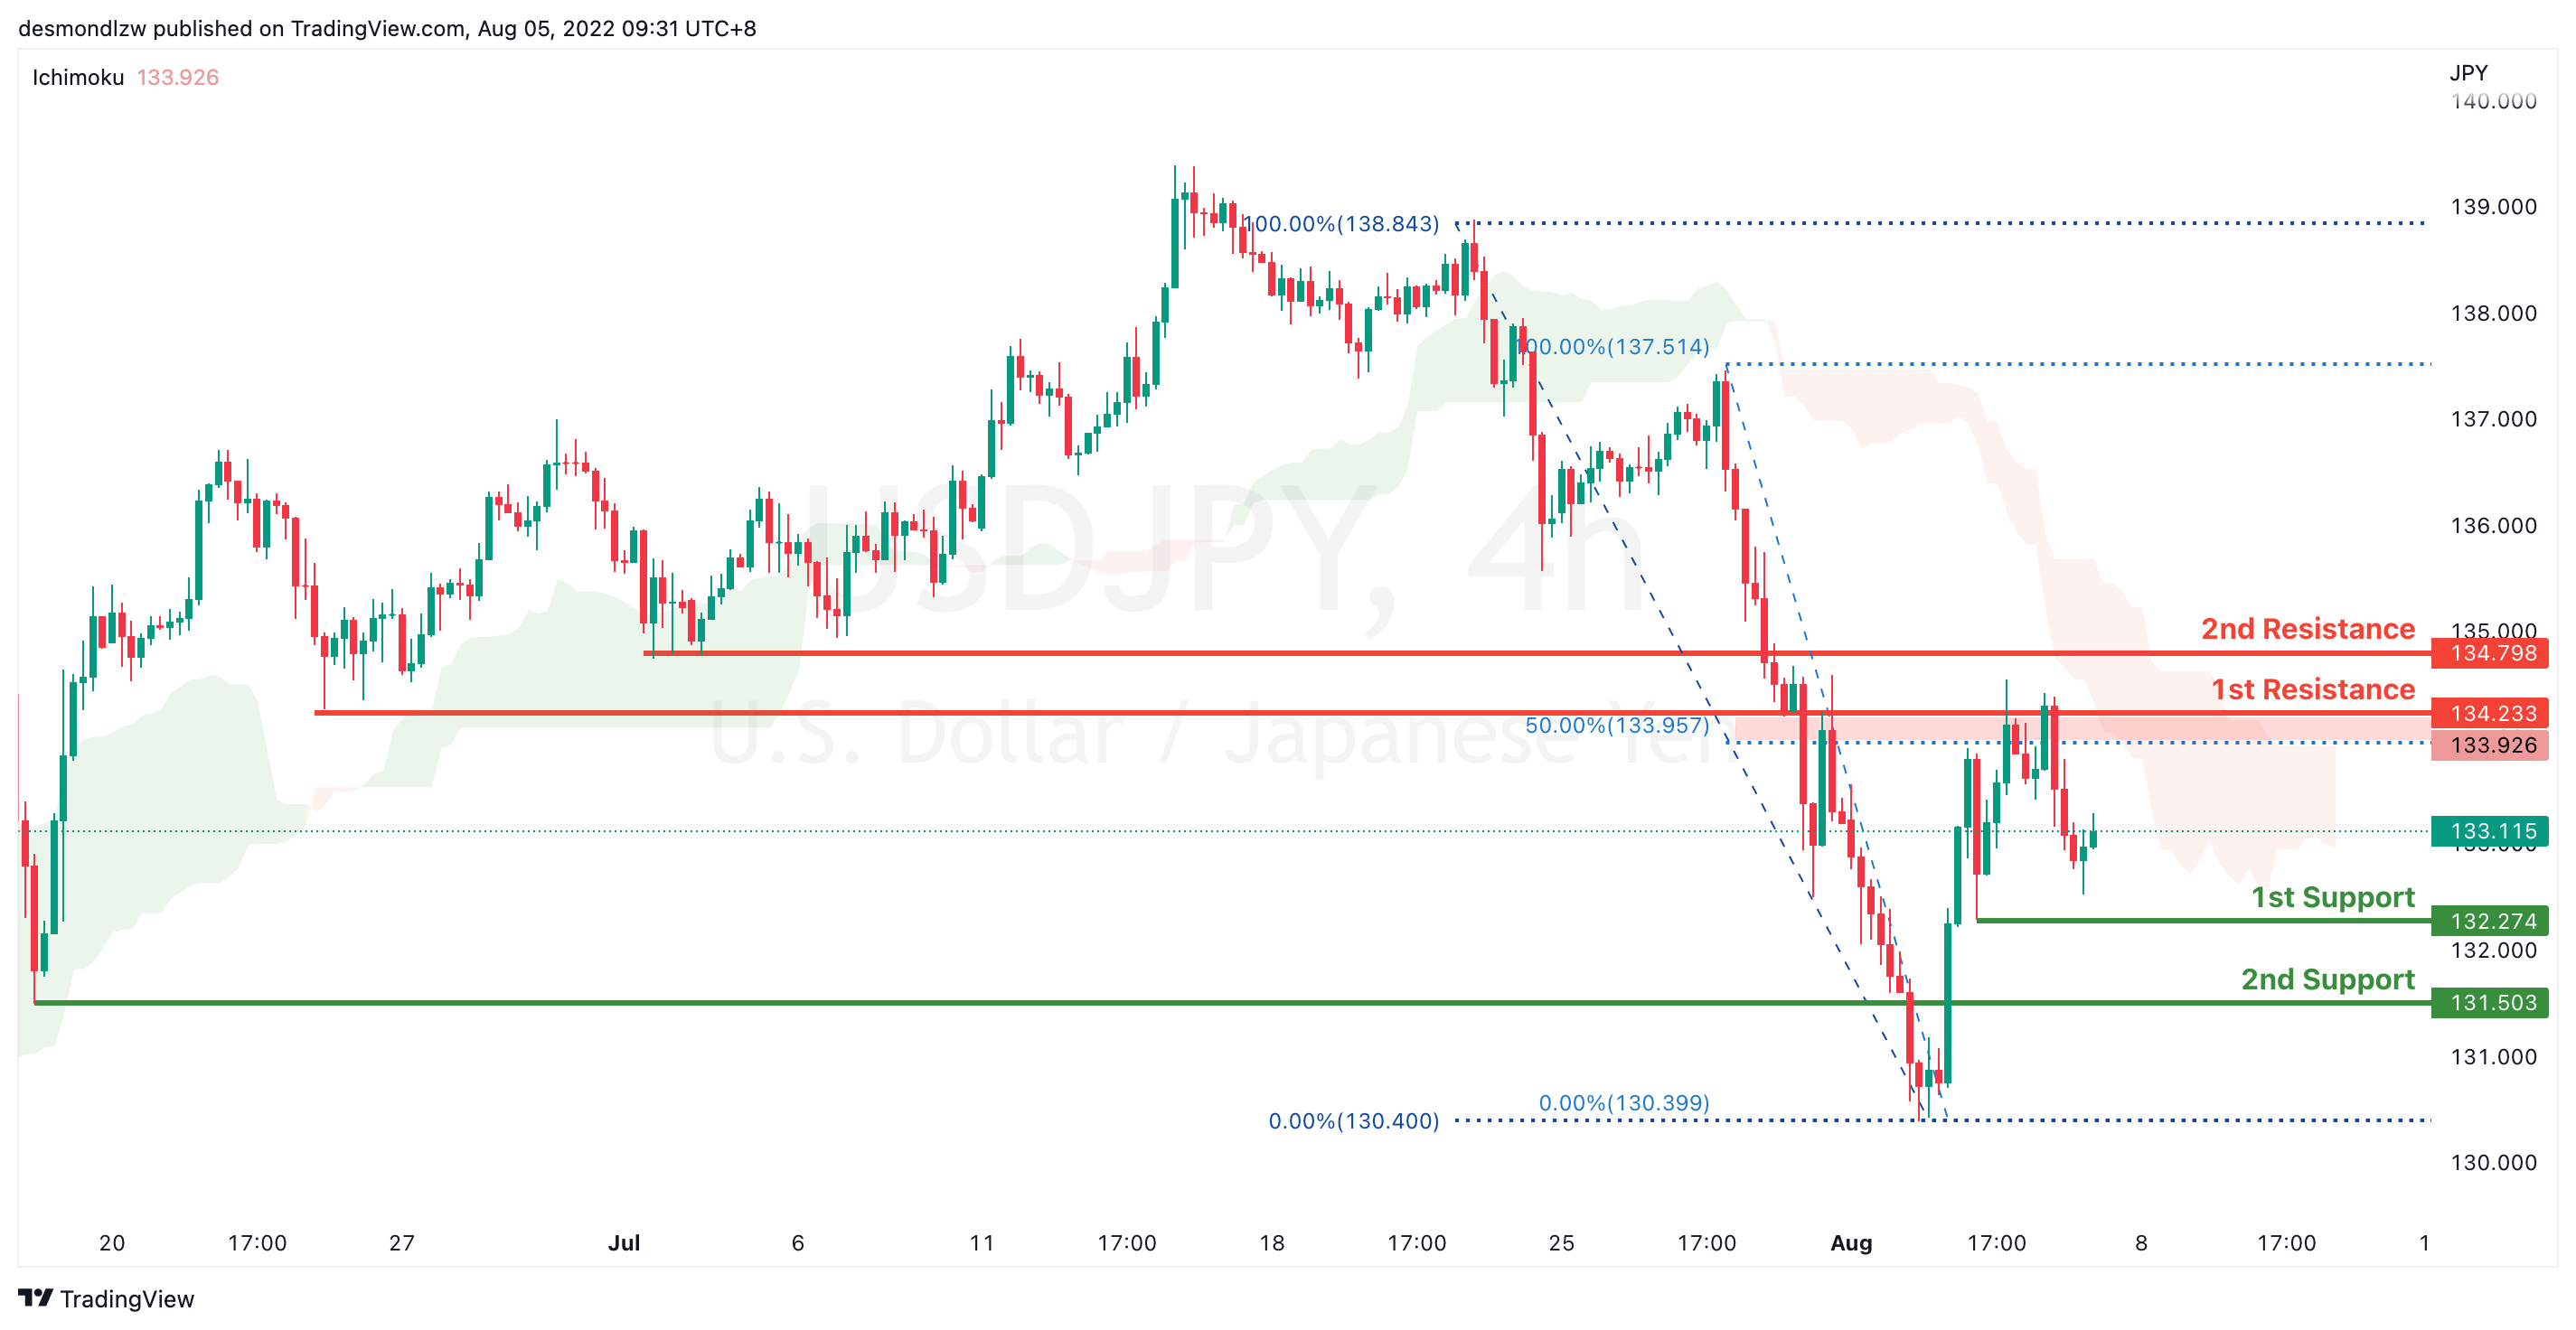
USD/JPY:
On the H4, price is slightly bullish biased as it fails to break the first support. It is now going to test at the first support at the first resistance where the 50% retracement sits at 134.233. If prices were to break the first resistance it will go to the second resistance at the previous swing low 134.798. Alternatively, price could pull back to test at the first support 132.274
Areas of consideration:
- H4 time frame, 1st resistance at 134.233
- H4 time frame, 1st support at 132.274
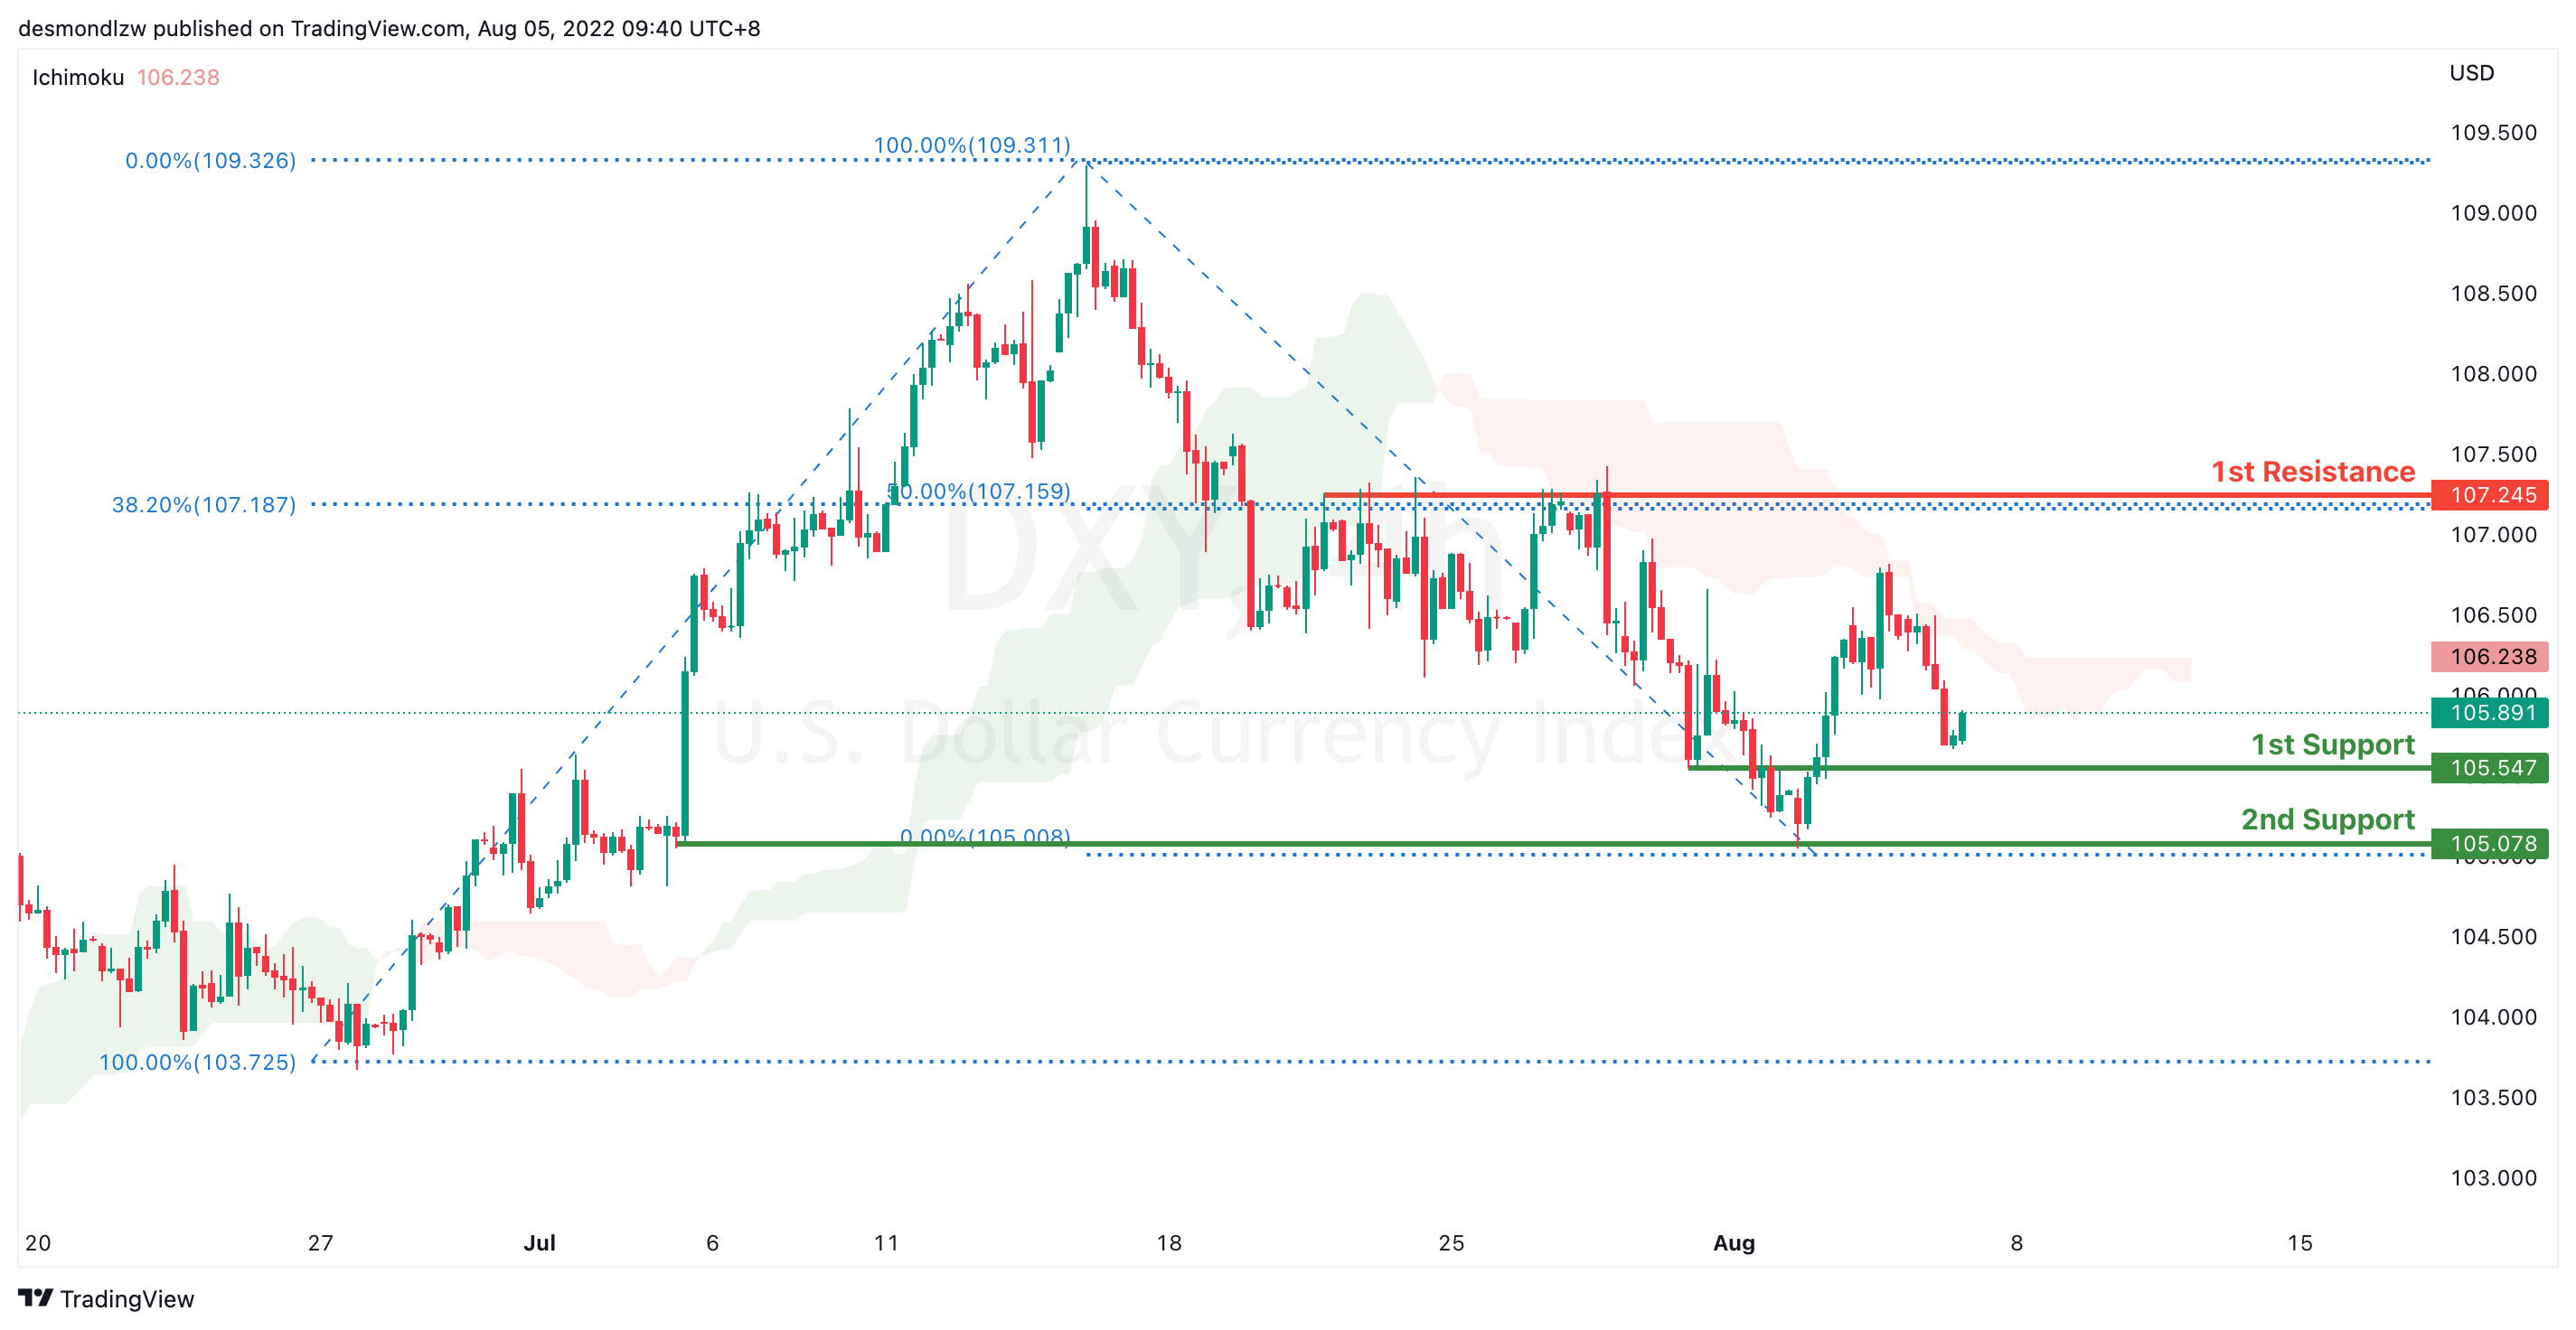
DXY:
On the H4, prices have broken the ascending trend into an overall bearish biased trend. Prices has confirmed descending momentum, still respecting the Ichimoku cloud. It is now pulling back to test first support at 105.547 which is the previous swing low. If price were to break this key level, it will pull back further to test at second support 105.078. Alternatively, price could bounce back and test at 107.245 which coincides with 38.2% Fibonacci retracement
Areas of consideration:
- H4 time frame, 1st resistance at 107.245
- H4 time frame, 1st support at 105.547
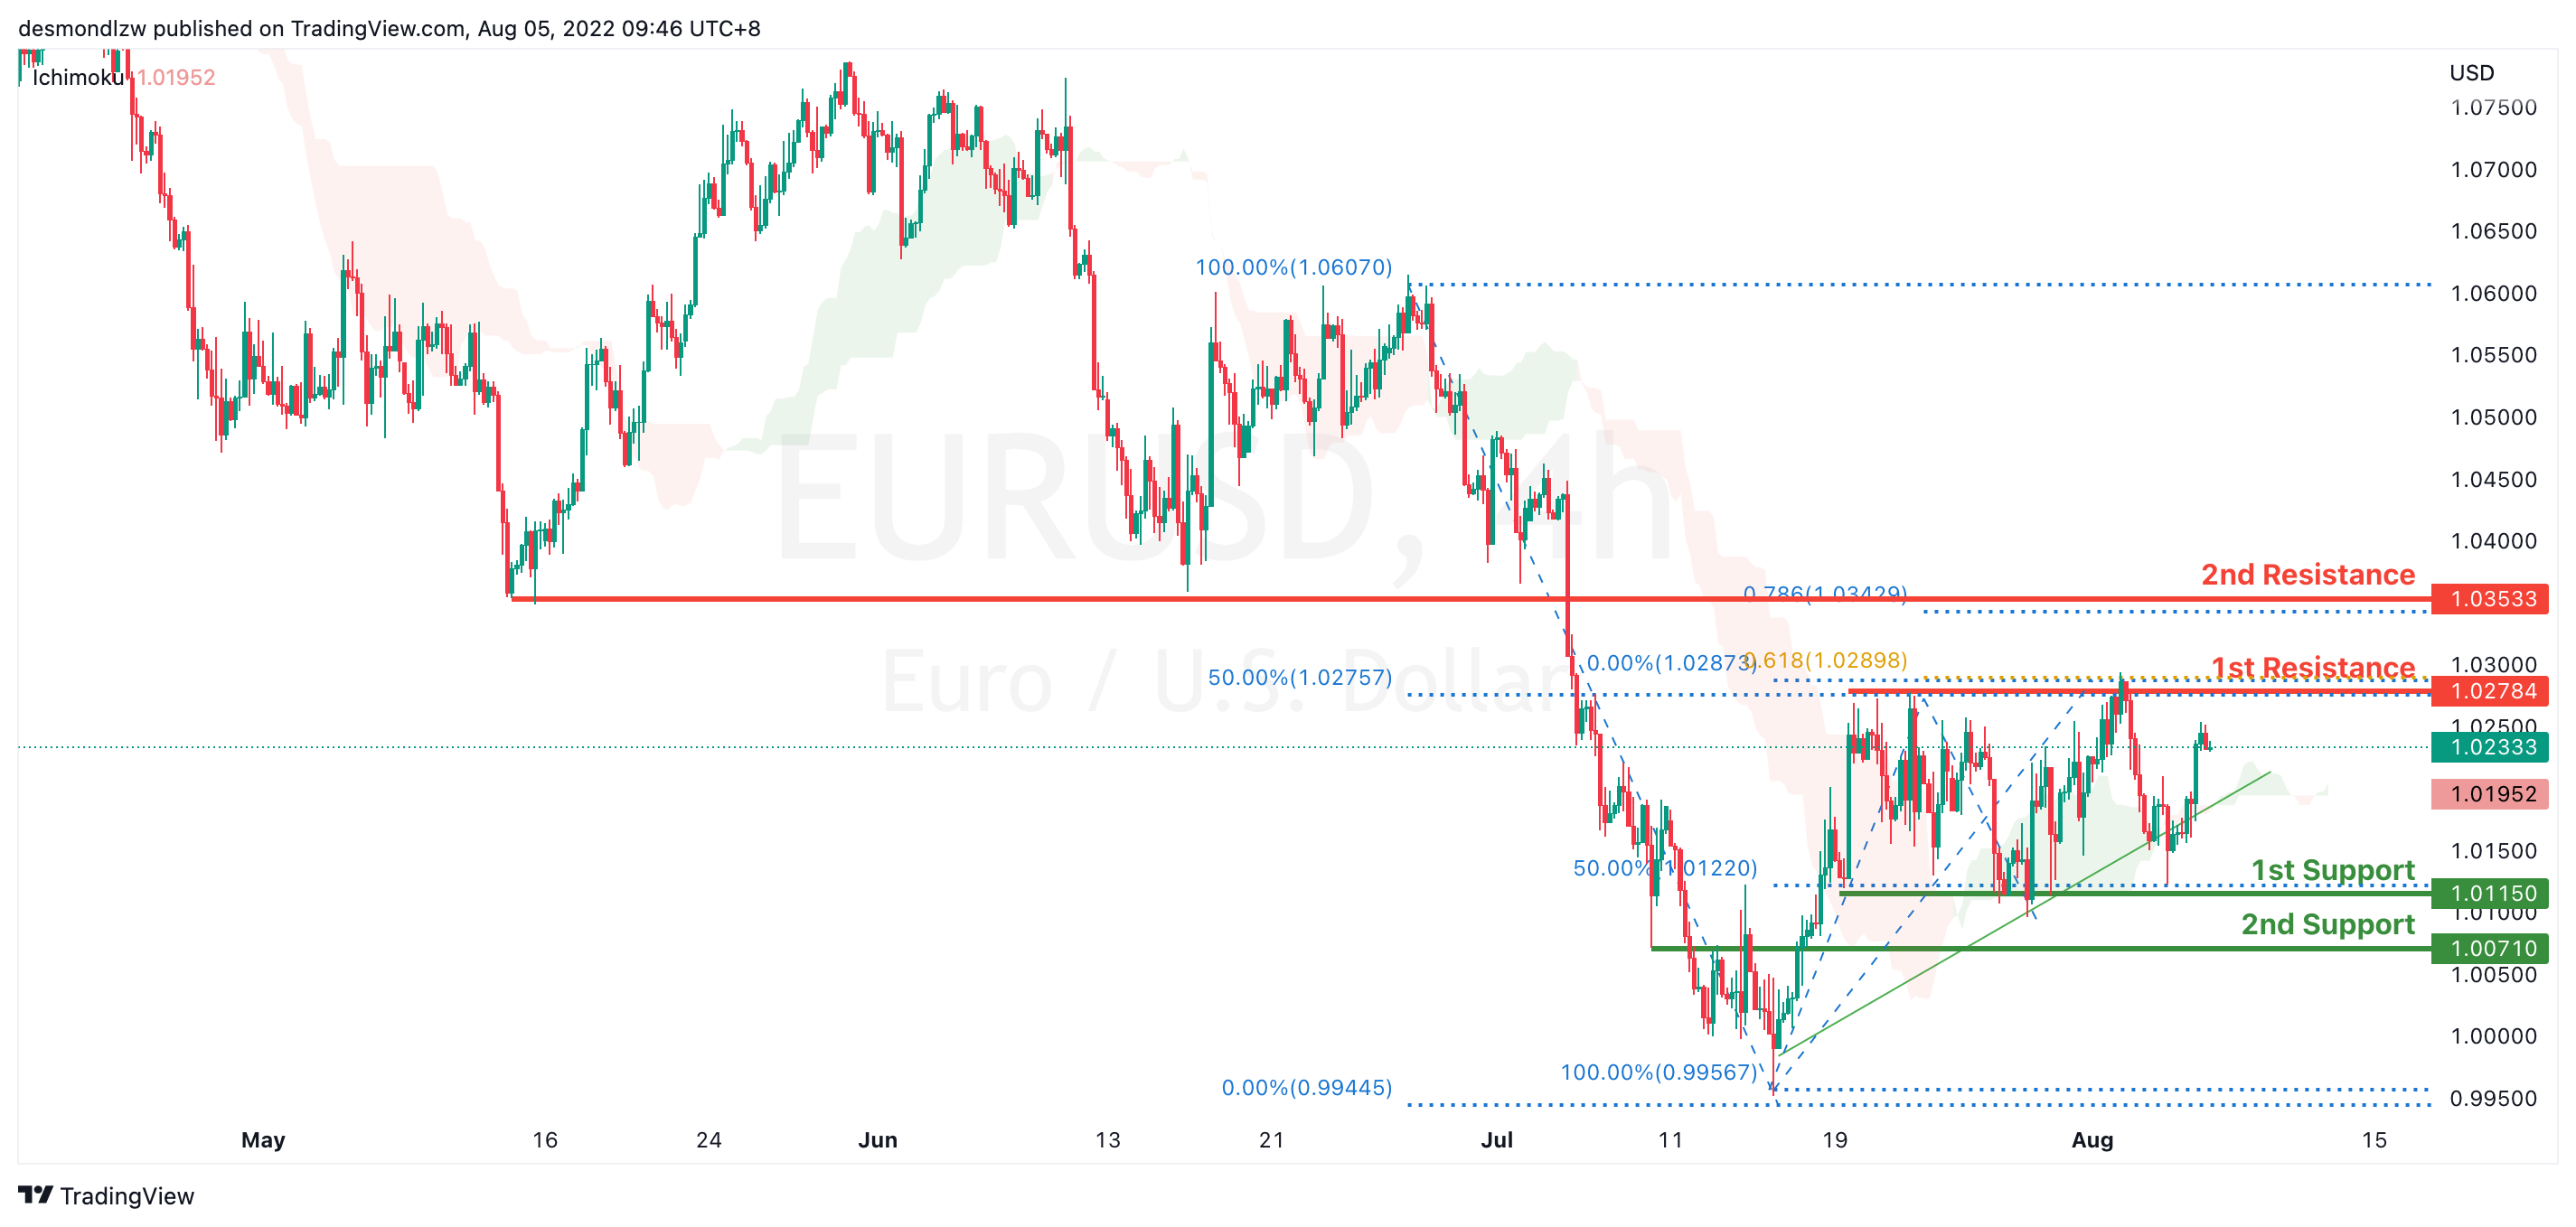
EUR/USD :
On the H4, prices have broken the bearish trend moving into a bullish biased trend. Price is pulling back to test the first resistance 1.027, which coincides with 61.8% Fibonacci projection and 50% retracement. If prices break 1st resistance, it will test the 2nd resistance at 1.03533. Alternatively, If price fails to break the first resistance it might test the first support at 1.011 level
Areas of consideration :
- H4 1st resistance at 1.027
- H4 1st support at 1.011
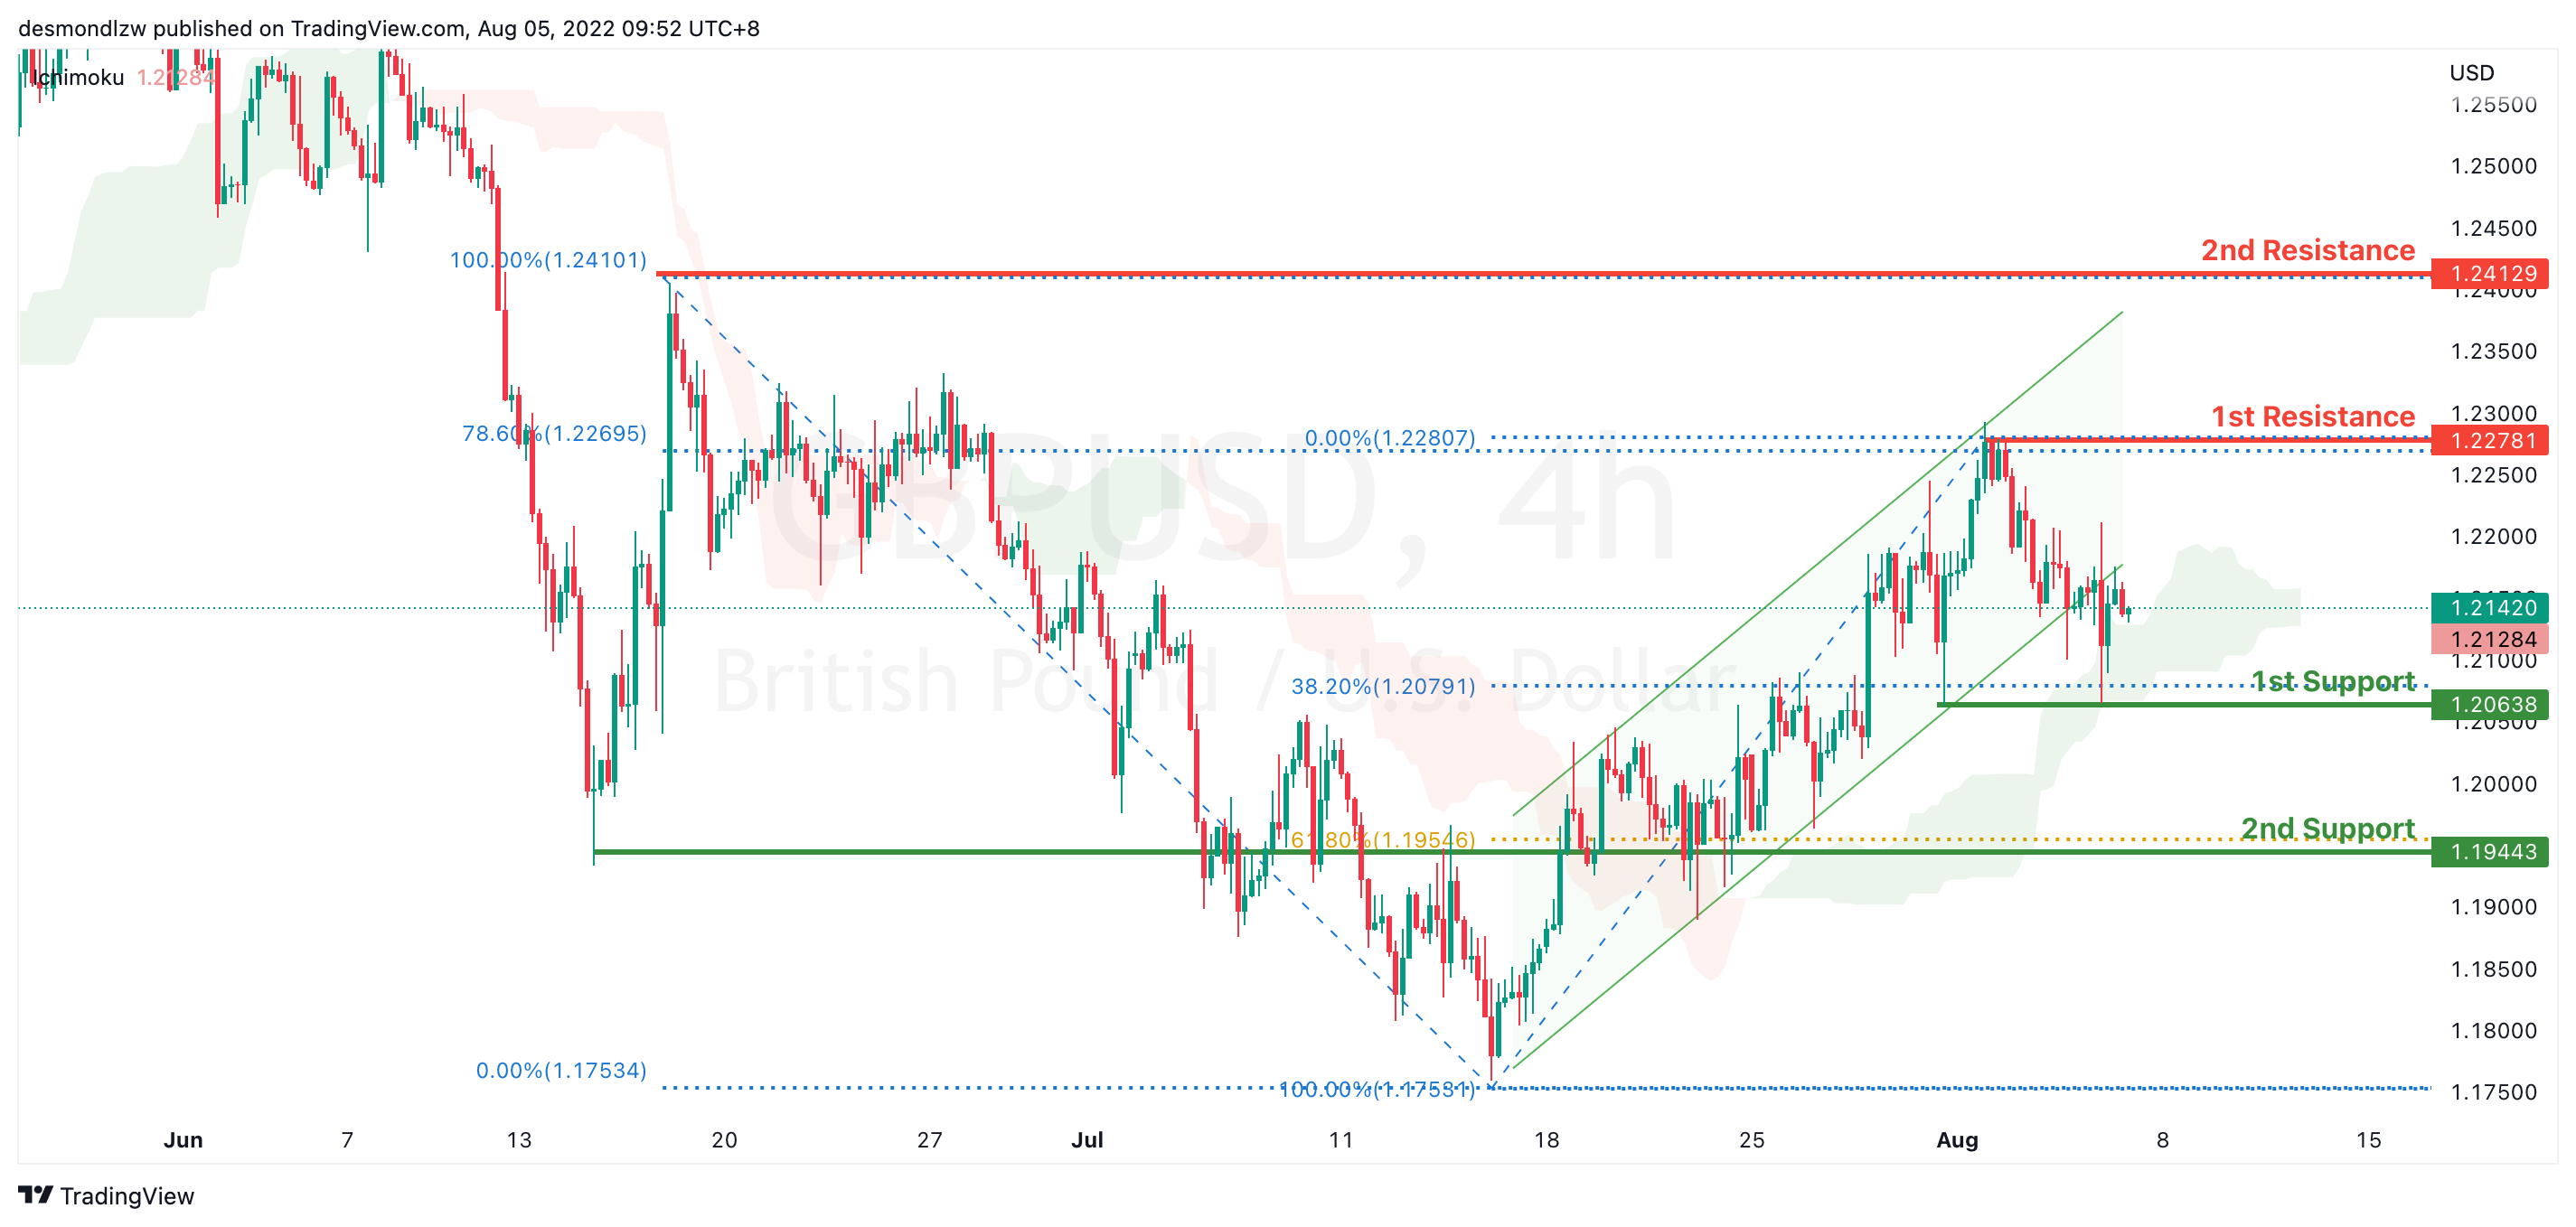
GBP/USD:
On the H4, with prices breaking the ascending channel we are now slightly bearish biased. Price is now testing the first support at 1.208 which coincides with 38.2% Fibonacci retracement. If price break supports and confirms downside trend, we would expect downside momentum to carry price to 2nd support at 1.194 61.8% Fibonacci retracement. Alternatively, price could bounce back to test at 78.6% Fibonacci retracement at 1.227
Areas of consideration:
- H4 1st resistance at 1.227
- H4 1st support at 1.2106
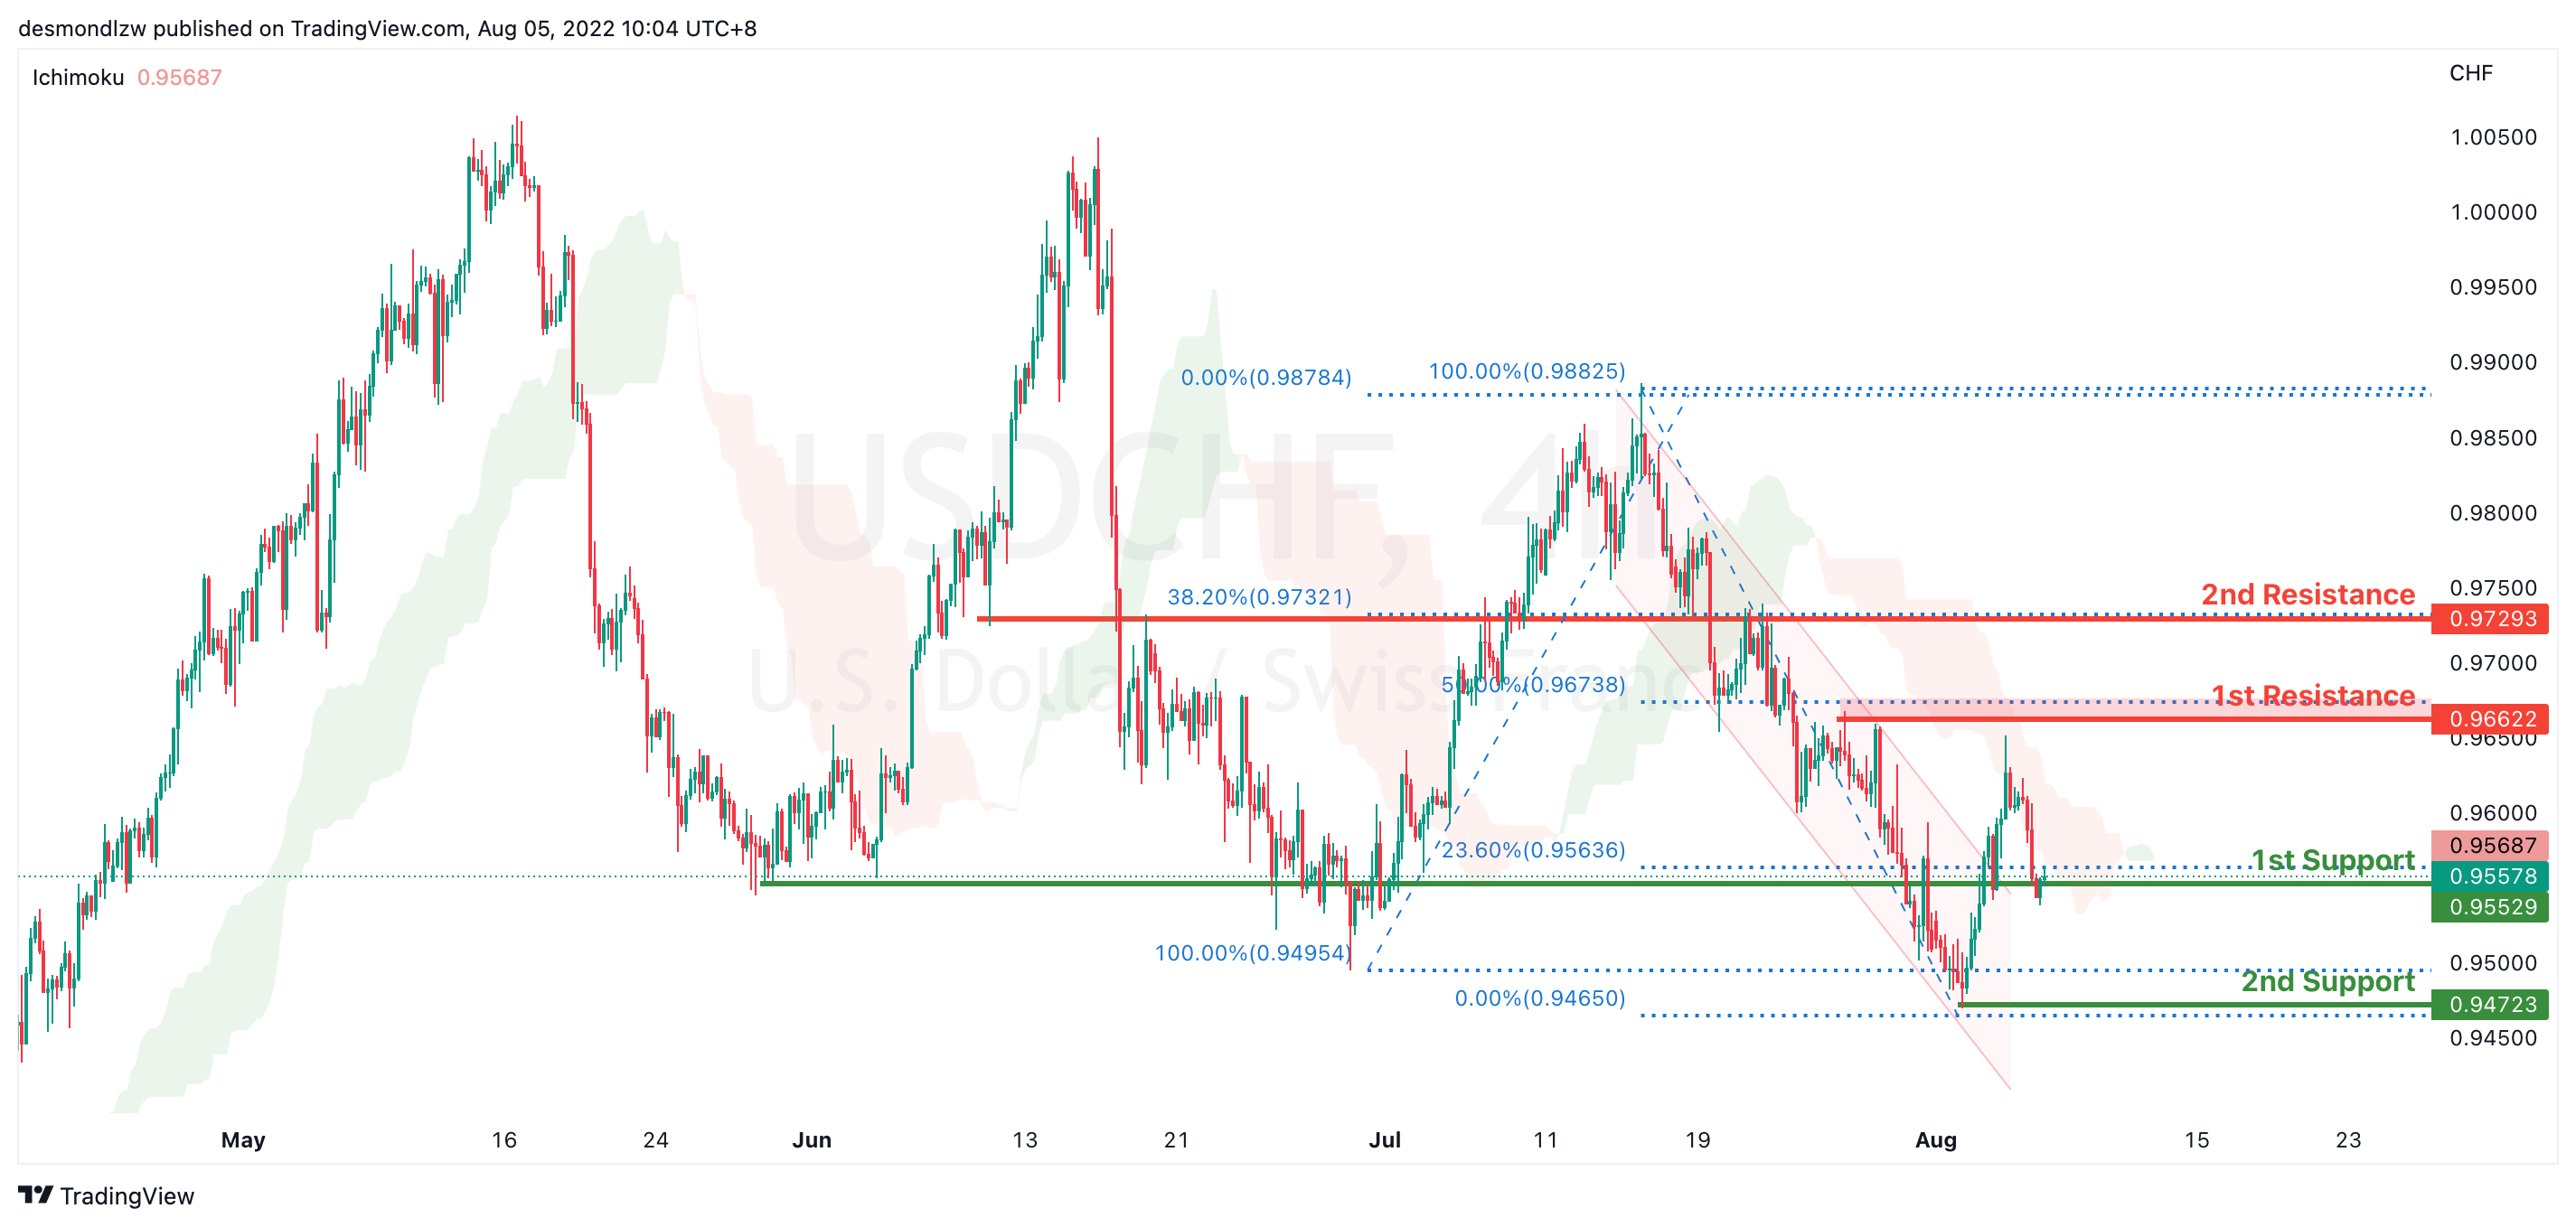
USD/CHF:
On the H4, prices have signalled a slightly bearish momentum. It has rejected the 1st resistance at 0.966 which is also the 50% Fibonacci retracement to test at the 1st support 0.955 23.6% fibonacci retracement. If prices break this key level, it will pull back further to test at the second support at 0.947. Alternatively price could bounce back to test at 1st resistance 0.966
Areas of consideration
- H4 1st resistance at 0.966
- H4 1st support at 0.955
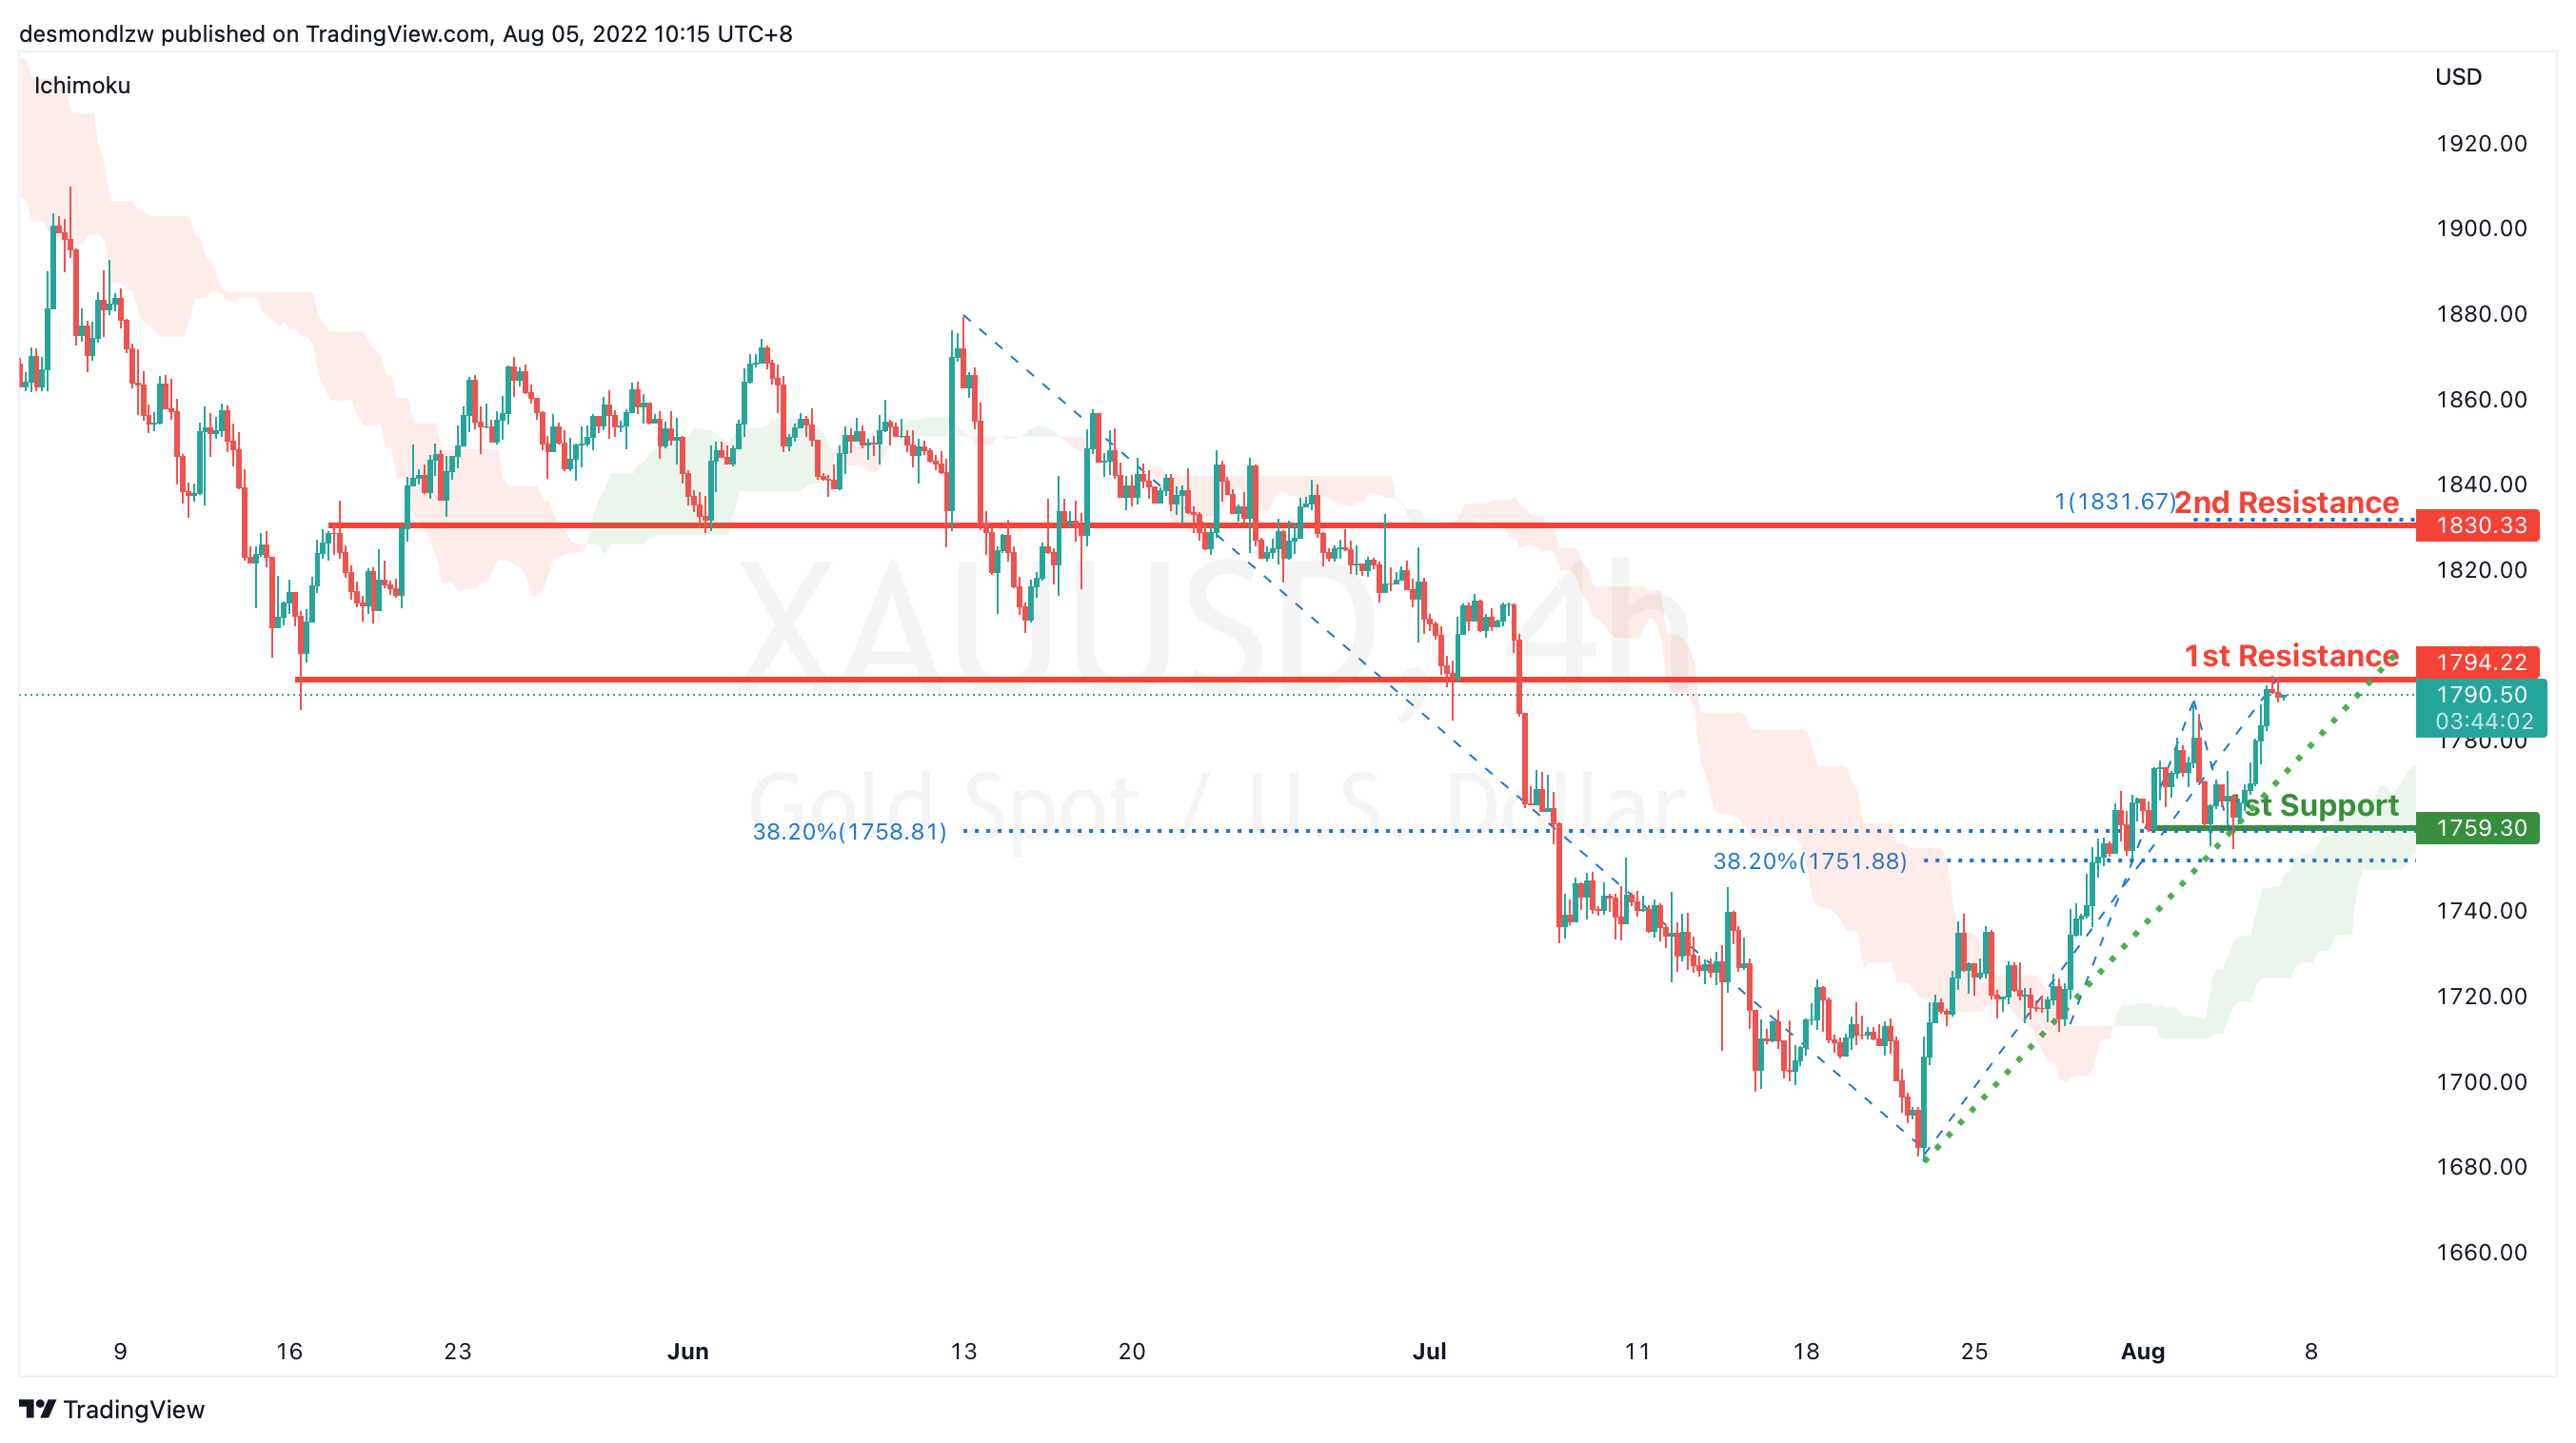
XAU/USD (GOLD):
On the H4, with prices going along the ascending trendline and moving above ichimoku cloud, we have a bullish bias that price may rise from the 1st resistance at 1794.22, which is in line with the overlap support to 2nd resistance at 1830.33 where the 100% fibonacci projection is. Alternatively, prices may drop to 1st support at 1759.30,which is in line with 38.2% fibonacci retracement.
Areas of consideration:
- H4 time frame, 1st resistance at 1794.22
- H4 time frame, 2nd resistance at 1830.33
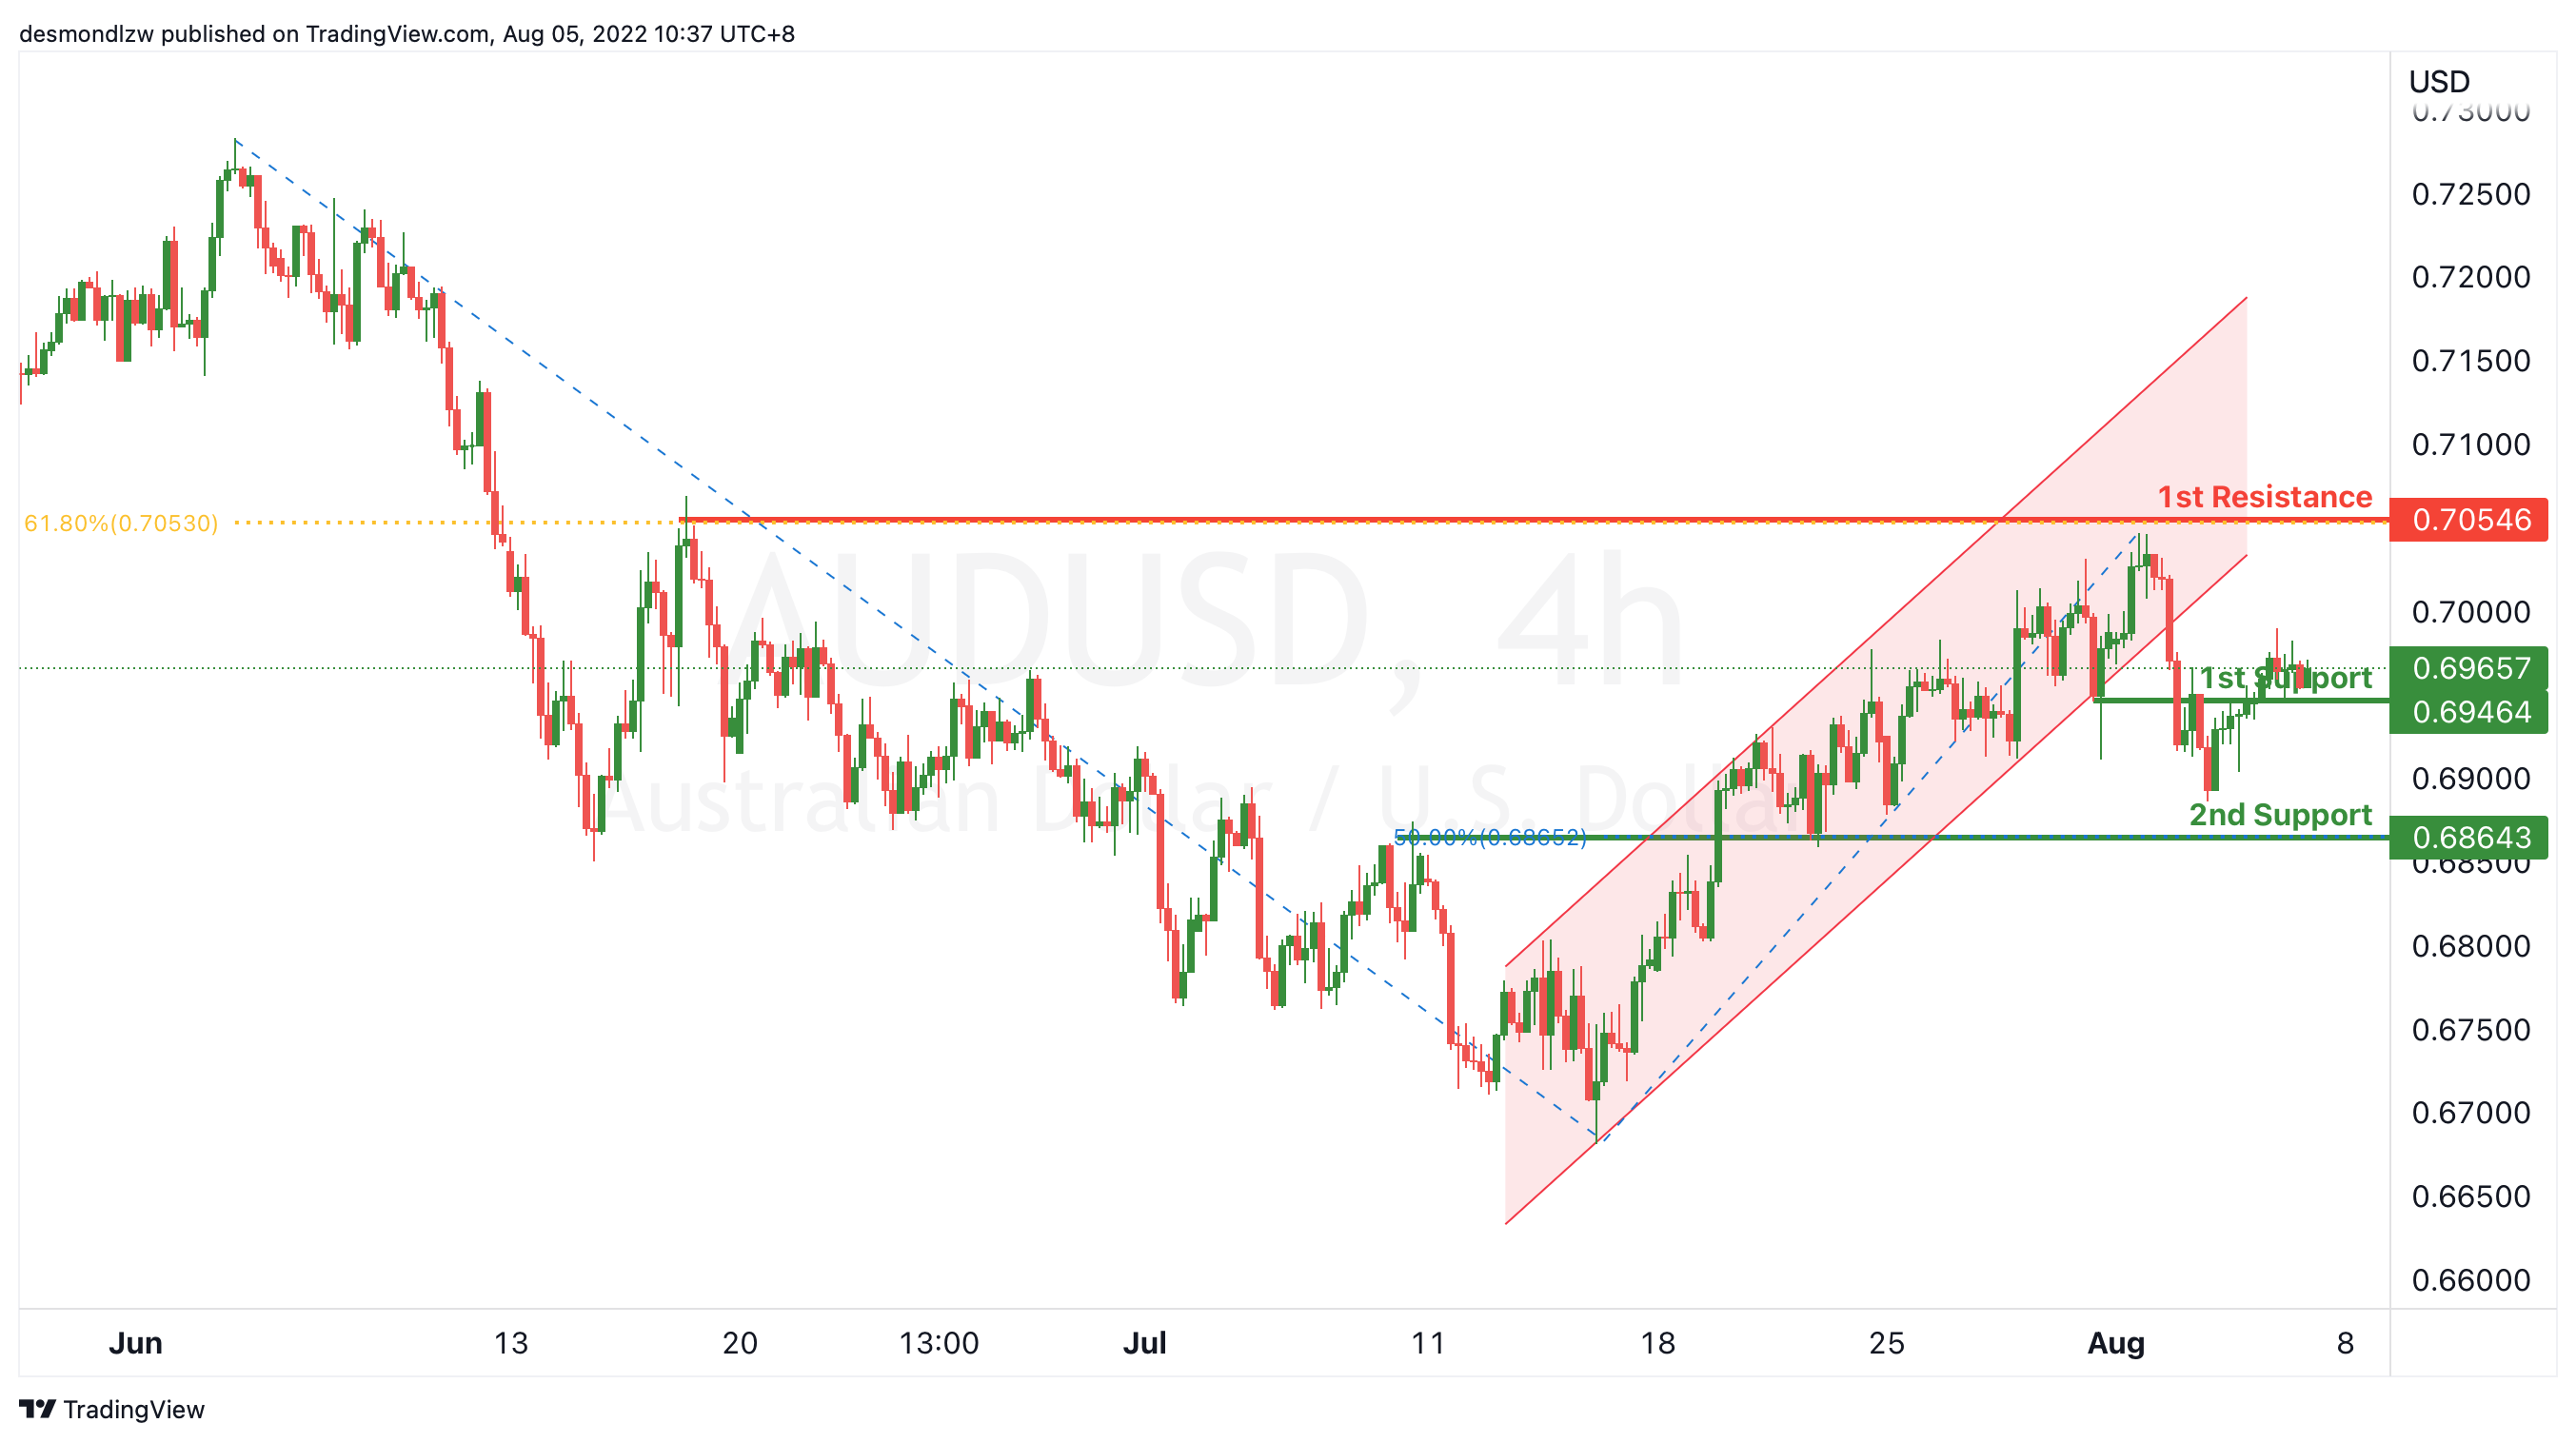
AUD/USD:
On the H4, with price breaking the ascending trend channel, we have a bearish bias that price will drop from the 1st support at 0.69657, where the pullback resistance is to the 2nd support at 0.68643 where the 50% fibonacci retracement is. Alternatively, price may rise to the 1st resistance at 0.70546 which is in line with 61.8% fibonacci retracement.
Areas of consideration
- H4 1st support at 0.69657
- H4 2nd support at 0.68643
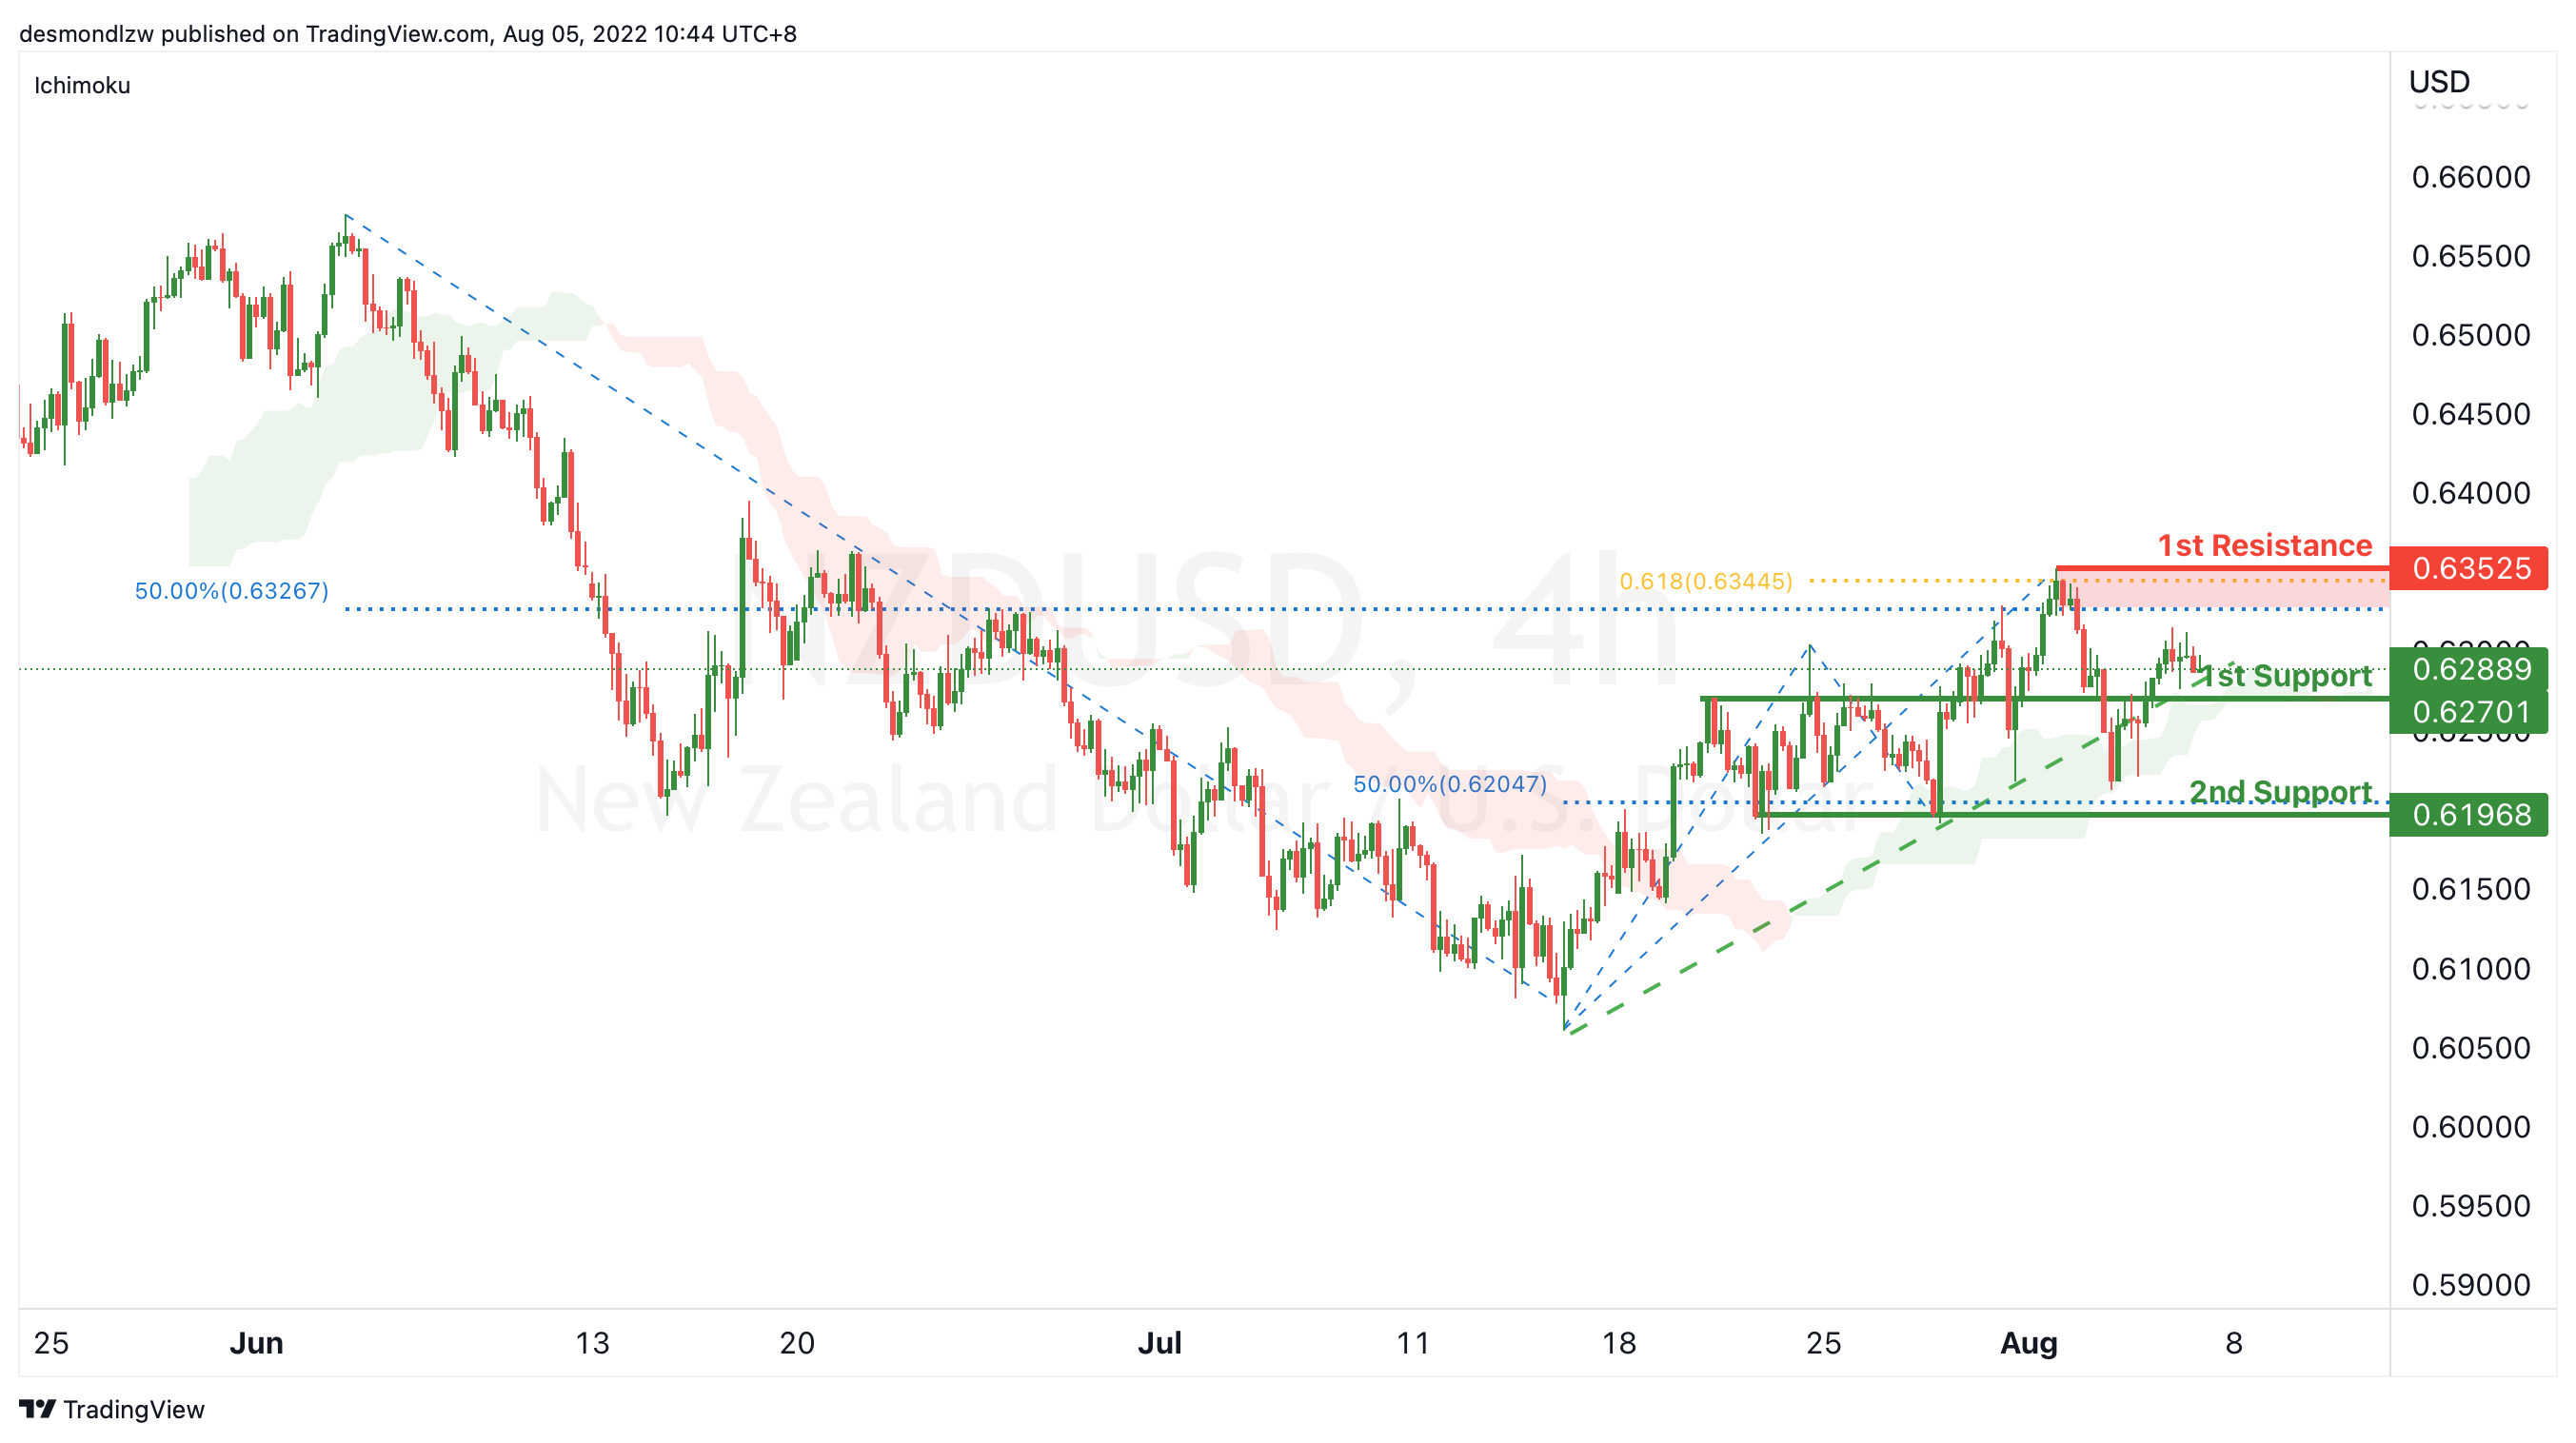
NZD/USD:
On the H4, with price moving along the ascending trendline, we have a bullish bias that price may rise from the 1st support at 0.62701 where overlap resistance is to the 1st resistance at 0.63525 at the swing high, 61.8% fibonacci projection and 50% fibonacci retracement. Alternatively, price may reverse off the 1st support and drop to 2nd support at 0.61968 where the swing low support and 50% fibonacci retracement are.
Areas of consideration:
- H4 time frame, 1st support at 0.62701
- H4 time frame, 1st resistance at 0.63525
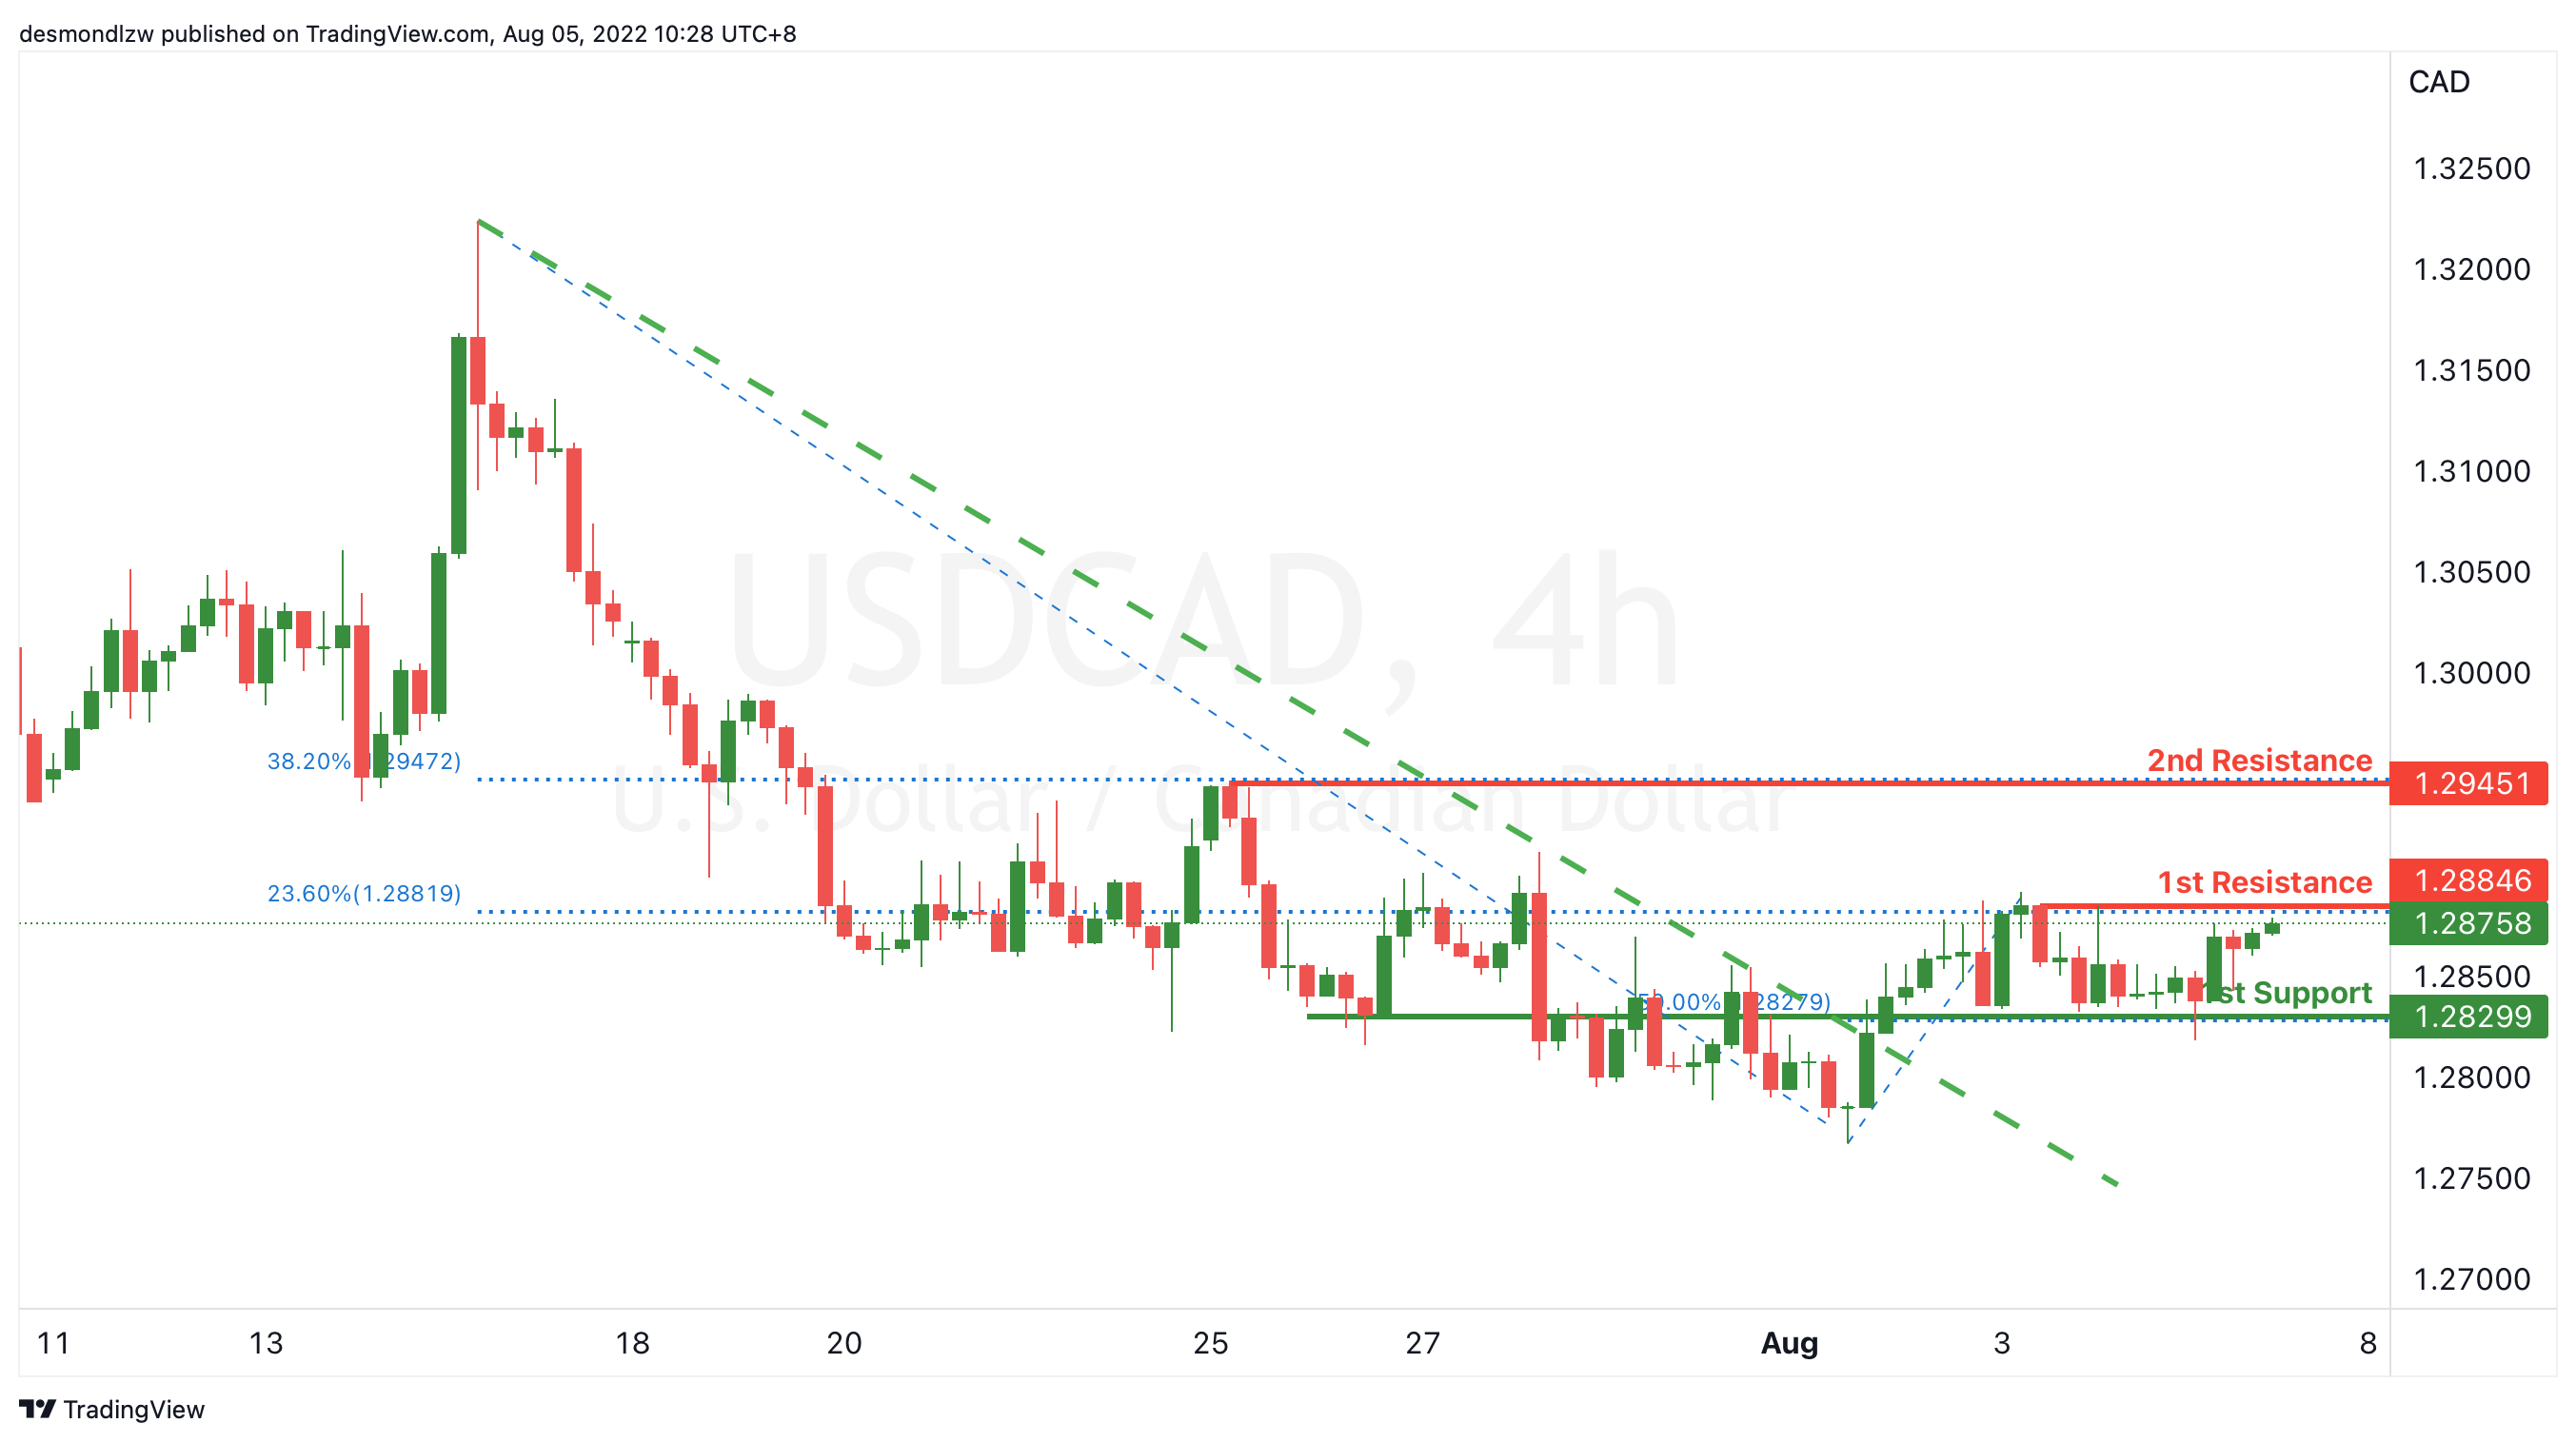
USD/CAD:
On the H4, with the price breaking the descending trendline and below ichimoku cloud, we have a bullish bias that the price may rise from our 1st resistance at 1.28846, which is in line with 23.6% fibonacci retracement to our 2nd resistance at 1.29451, which is in line with the 38.2% fibonacci retracement. Alternatively, the price may drop to the 1st support at 1.28299, which is in line with 50% fibonacci retracement.
Areas of consideration:
- H4 time frame, 1st resistance at 1.28846
- H4 time frame, 2nd resistance at 1.29451
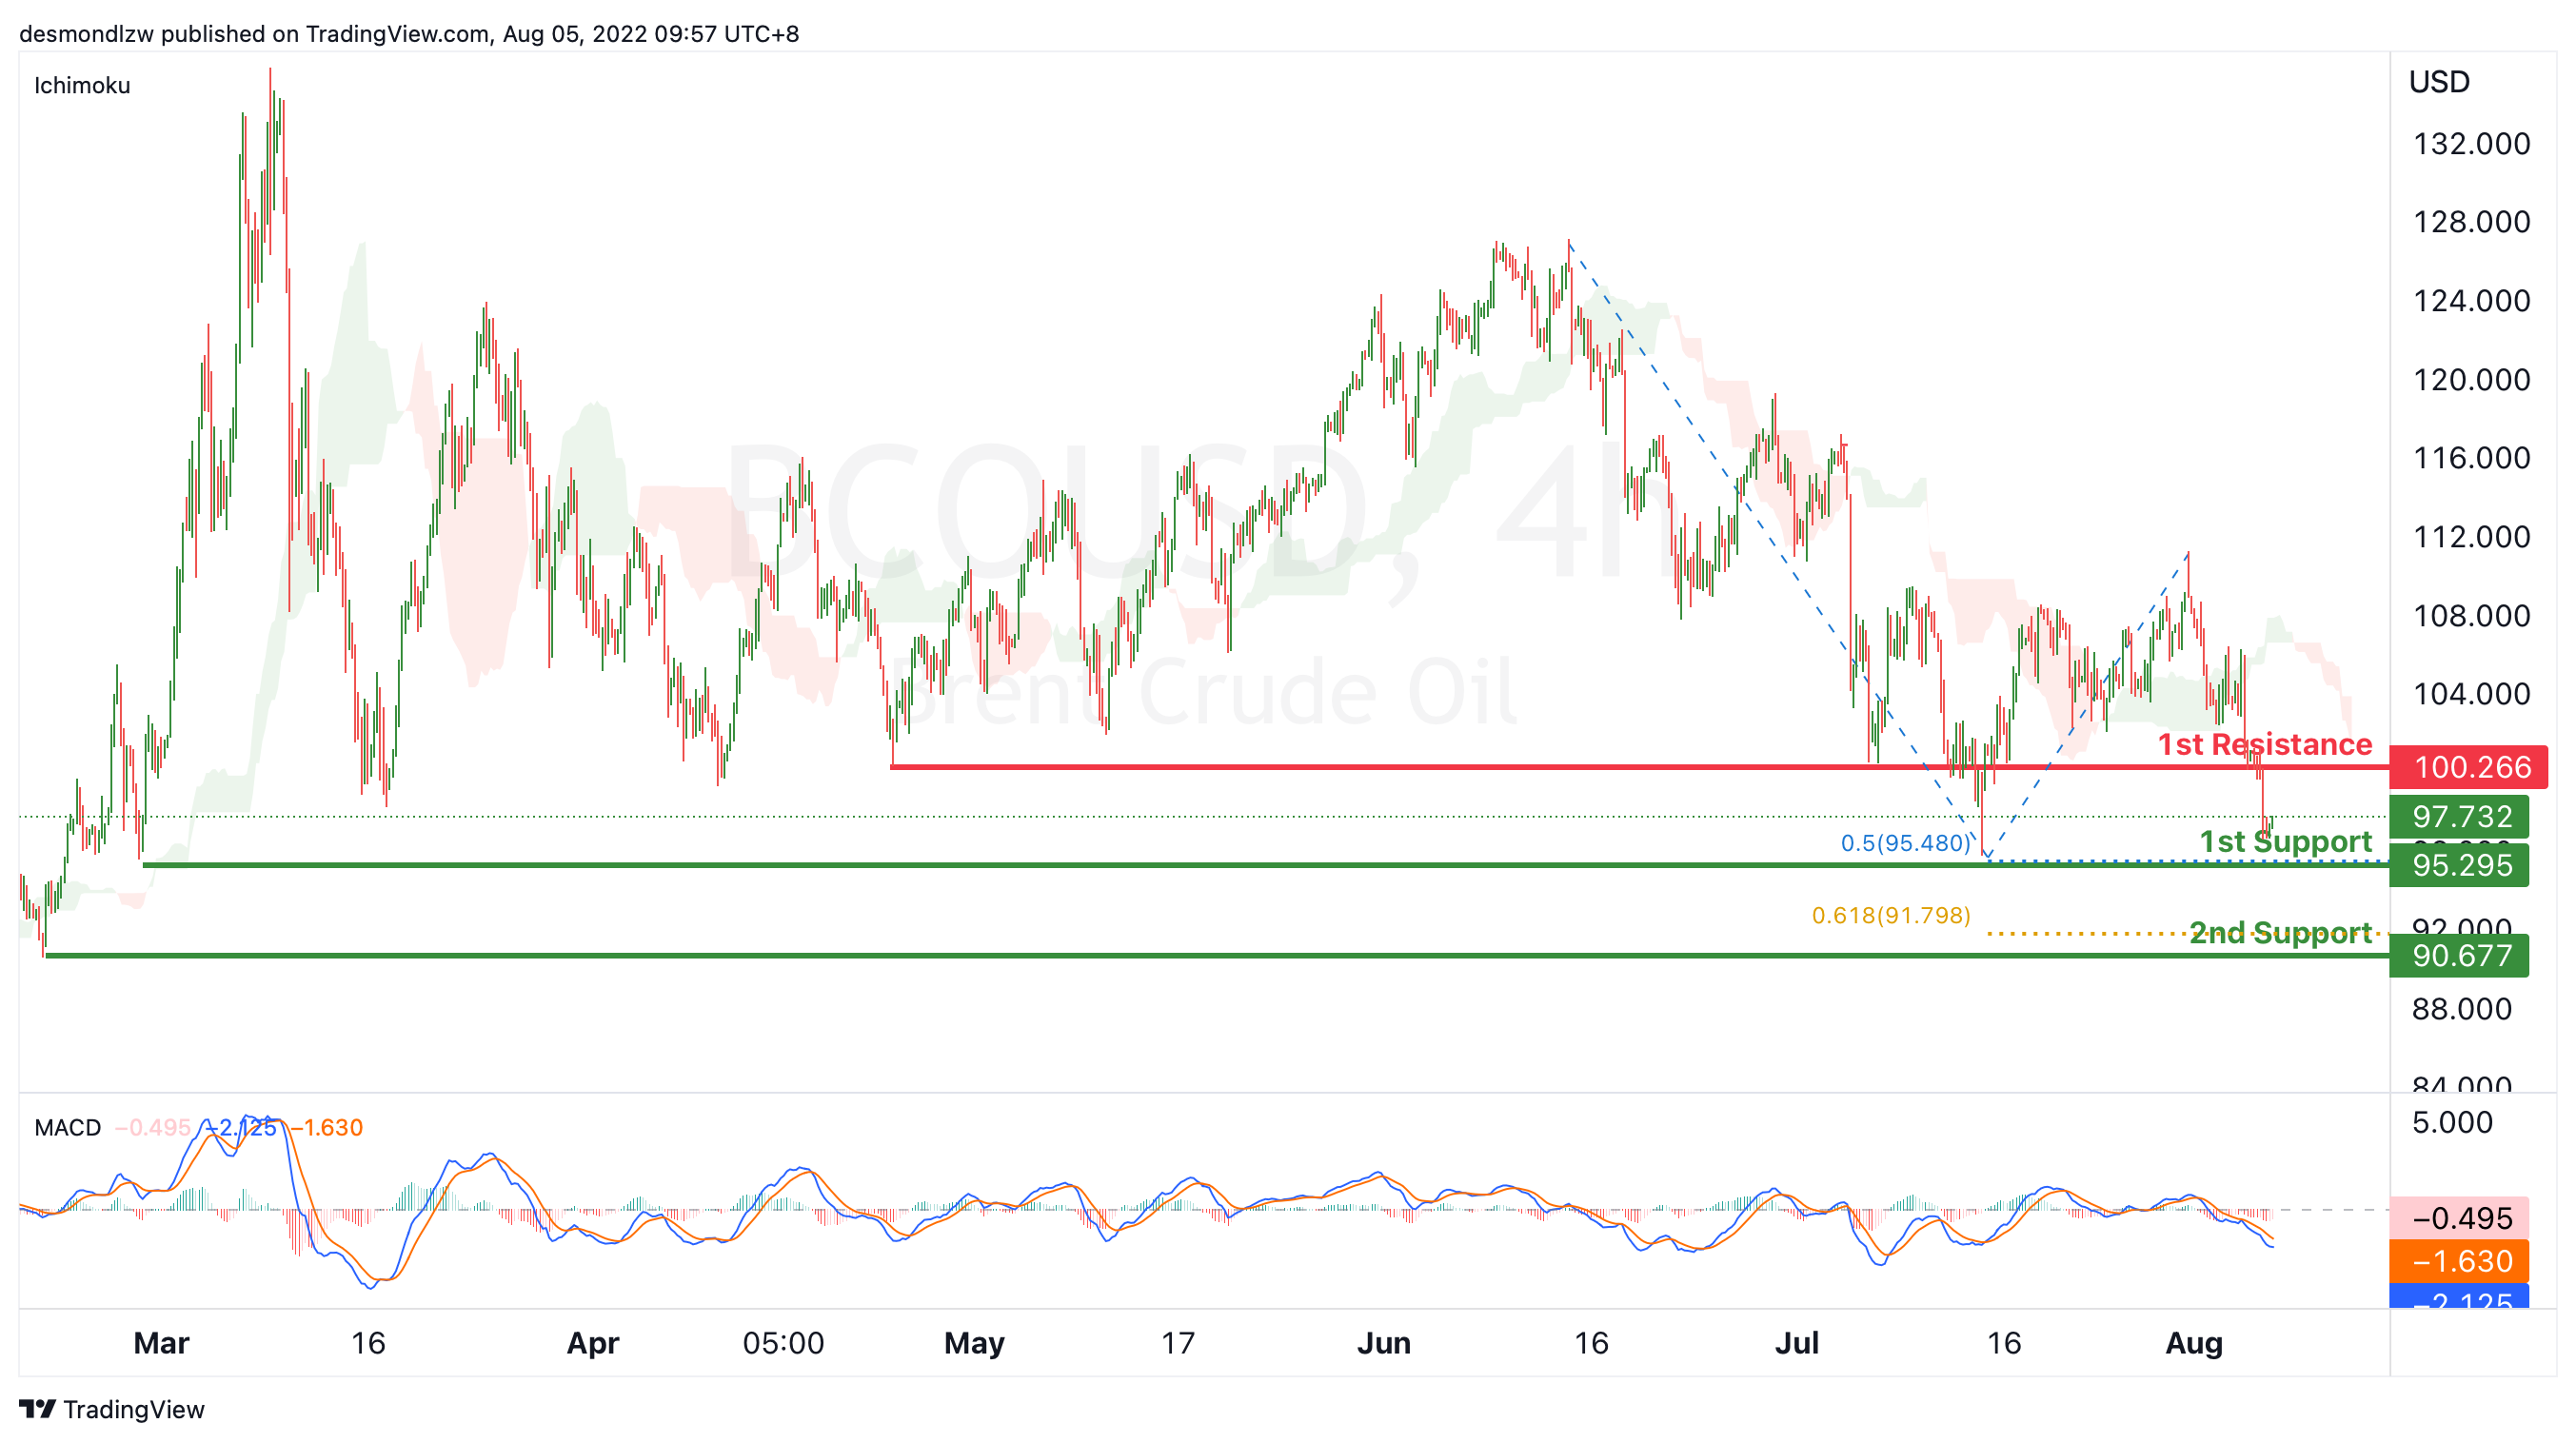
OIL:
On the H4, with price going below the ichimoku cloud and the momentum of MACD histogram is decreasing under zero axis, we have a bearish bias that price might drop from the 1st support at 95.295, where the swing low support and 50% fibonacci projection are to 2nd support at 90.677, where the pullback support and 61.8% fibonacci projection are. Otherwise, the price may rise to our 1st resistance at 100.266, where the swing low support is.
Areas of consideration:
- H4 time frame, 1st support of 95.295
- H4 time frame, 2nd support of 90.677
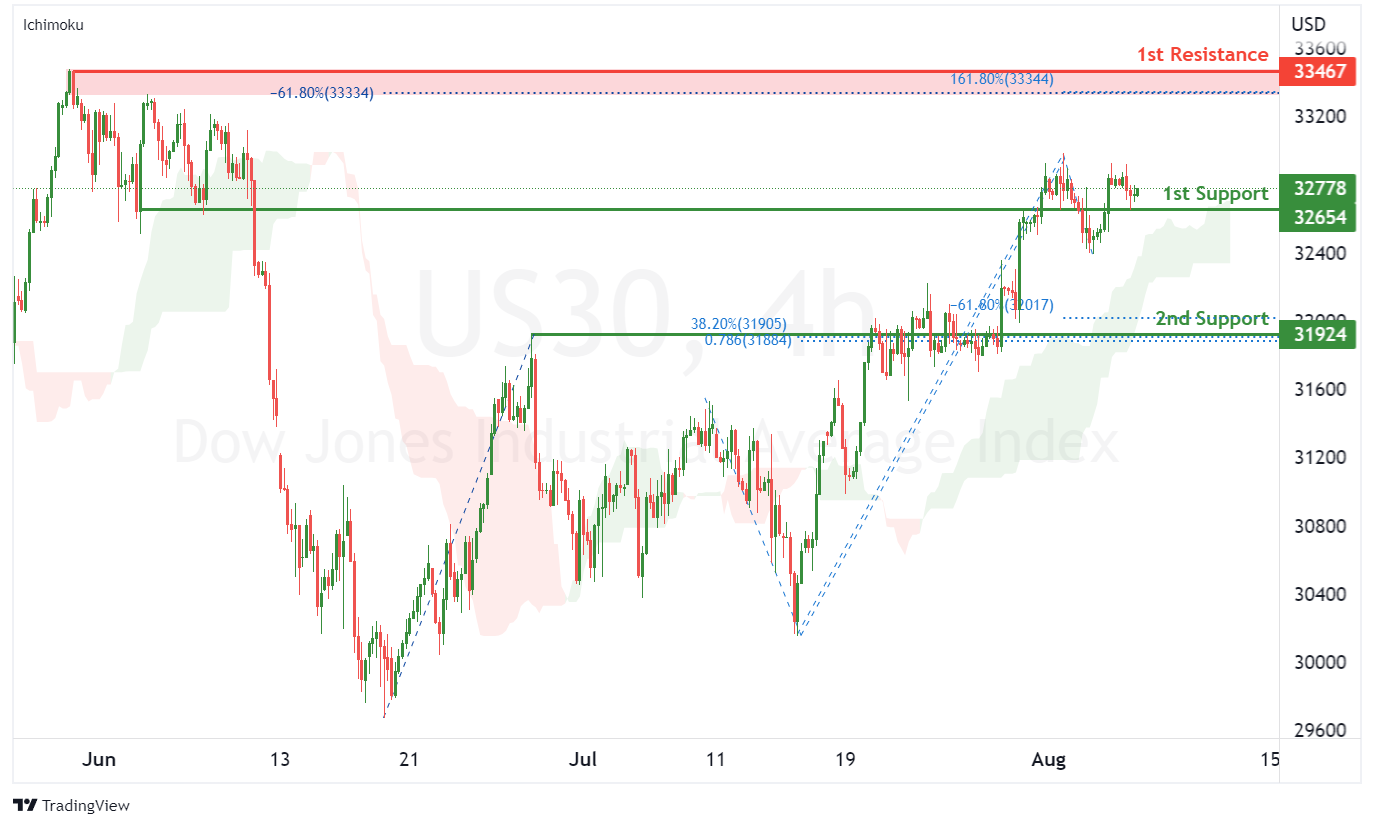
Dow Jones Industrial Average:
On the H4, with price moving above the ichimoku indicator, we have a bullish bias that price will rise from the 1st support at 32654 where the pullback support is to the 1st resistance at 33467 where the swing high resistance, 161.8% fibonacci extension and -61.8% fibonacci expansion are. Alternatively, price could break 1st support structure and drop to 2nd support at 31924 where the pullback support, -61.8% fibonacci expansion, 38.2% fibonacci retracement and 78.6% fibonacci projection are.
Areas of consideration:
- H4 time frame, 1st resistance of 33467
- H4 time frame, 1st support at 32654
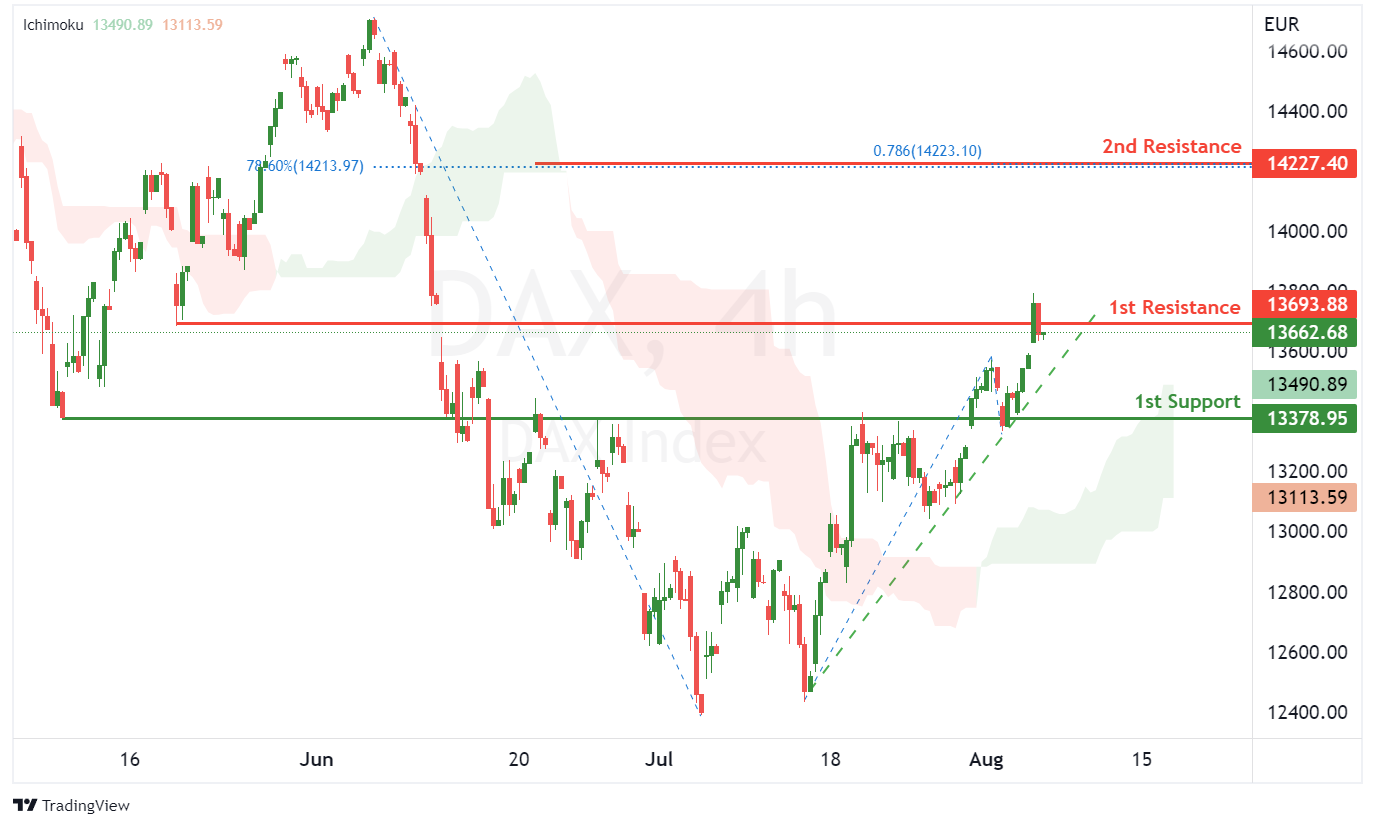
DAX:
On the H4, with price moving above the ichimoku indicator and along the ascending trendline, we have a bullish bias that price will rise to 1st resistance at 13693.88 where the pullback resistance is. Once there is upside confirmation of price breaking 1st resistance structure, we would expect bullish momentum to carry price to 2nd resistance at 14227.40 in line with 78.6% fibonacci projection and 78.6% fibonacci retracement. Alternatively, price could drop to 1st support at 13378.95 where the overlap support is.
Areas of consideration:
- H4 time frame, 1st resistance of 13693.88
- H4 time frame, 1st support at 13378.95
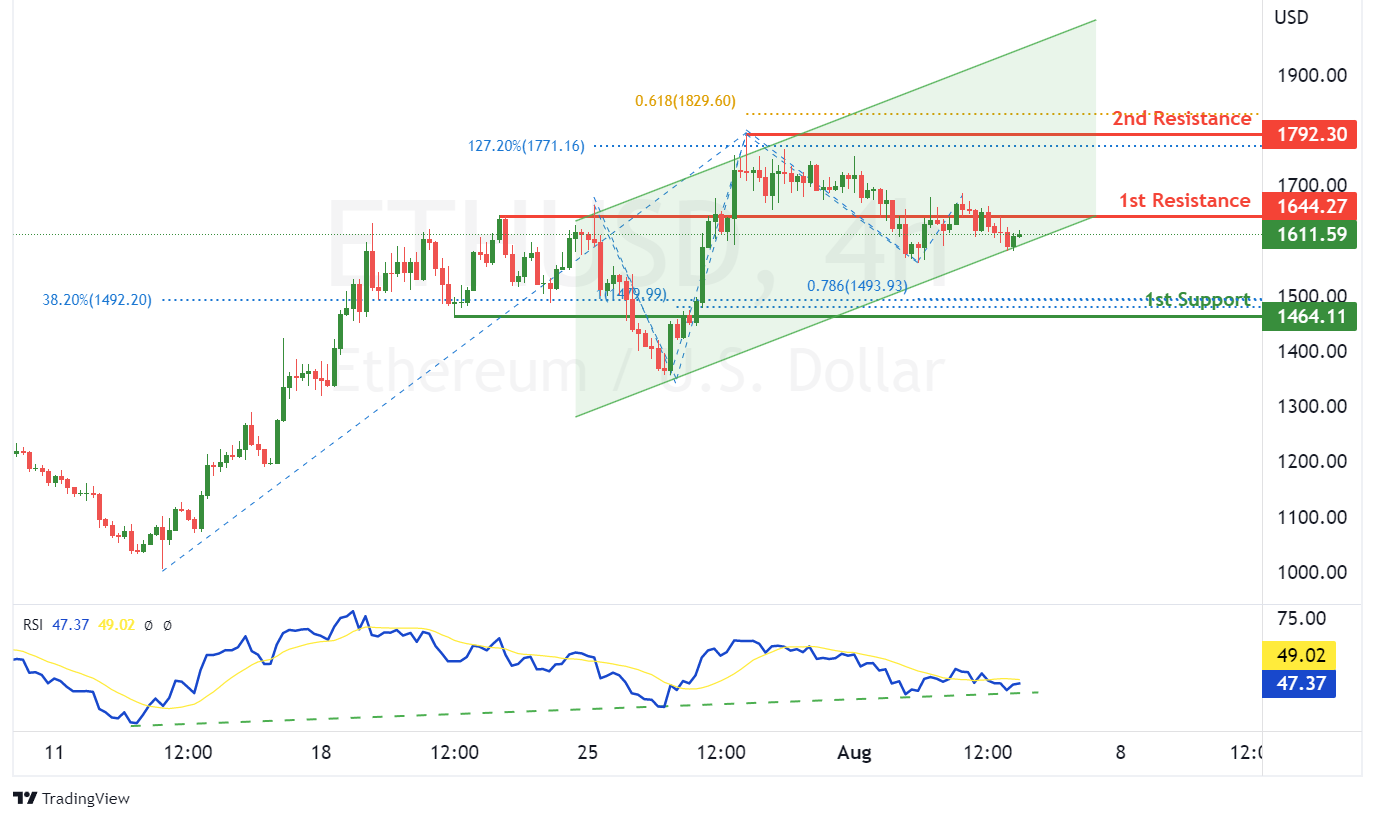
ETHUSD:
On the H4, with RSI moving along an ascending trendline and price moving within an ascending channel, we have a bullish bias that price will rise to 1st resistance at 1644.27 where the overlap support is. Once there is upside confirmation that price has broken 1st resistance structure, we would expect bullish momentum to carry price to 2nd resistance at 1792.30 where the swing high resistance, 127.2% fibonacci extension and 61.8% fibonacci projection are. Alternatively, price could drop to 1st support at 1464.11 where the pullback support, 78.6% fibonacci projection, 100% fibonacci projection and 38.2% fibonacci retracement are.
Areas of consideration:
- H4 time frame, 1st resistance of 1644.27
- H4 time frame, 1st support at 1464.11
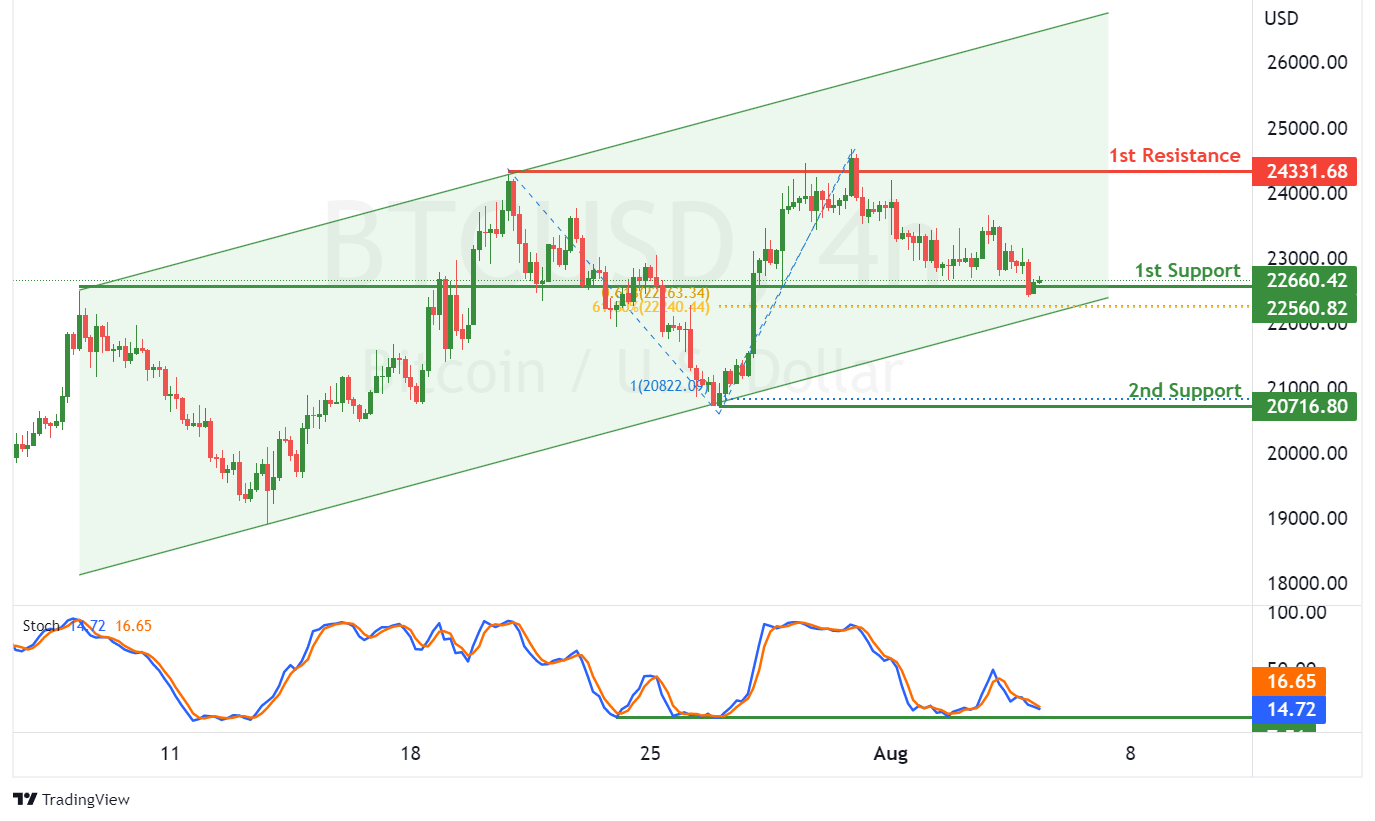
BTCUSD:
On the H4, with price moving within a bullish channel and expected to bounce from the stochastic support, we have a bullish bias that price will rise from our 1st support at 22560.82 where the pullback support, 61.8% fibonacci retracement and 61.8% fibonacci projection are to the 1st resistance at 24331.68 where the pullback resistance is. Alternatively, price could break 1st support structure and drop to 2nd support at 20716.80 where the swing low support and 100% fibonacci projection are.
Areas of consideration:
- H4 time frame, 1st resistance of 24331.68
- H4 time frame, 1st support at 22560.82
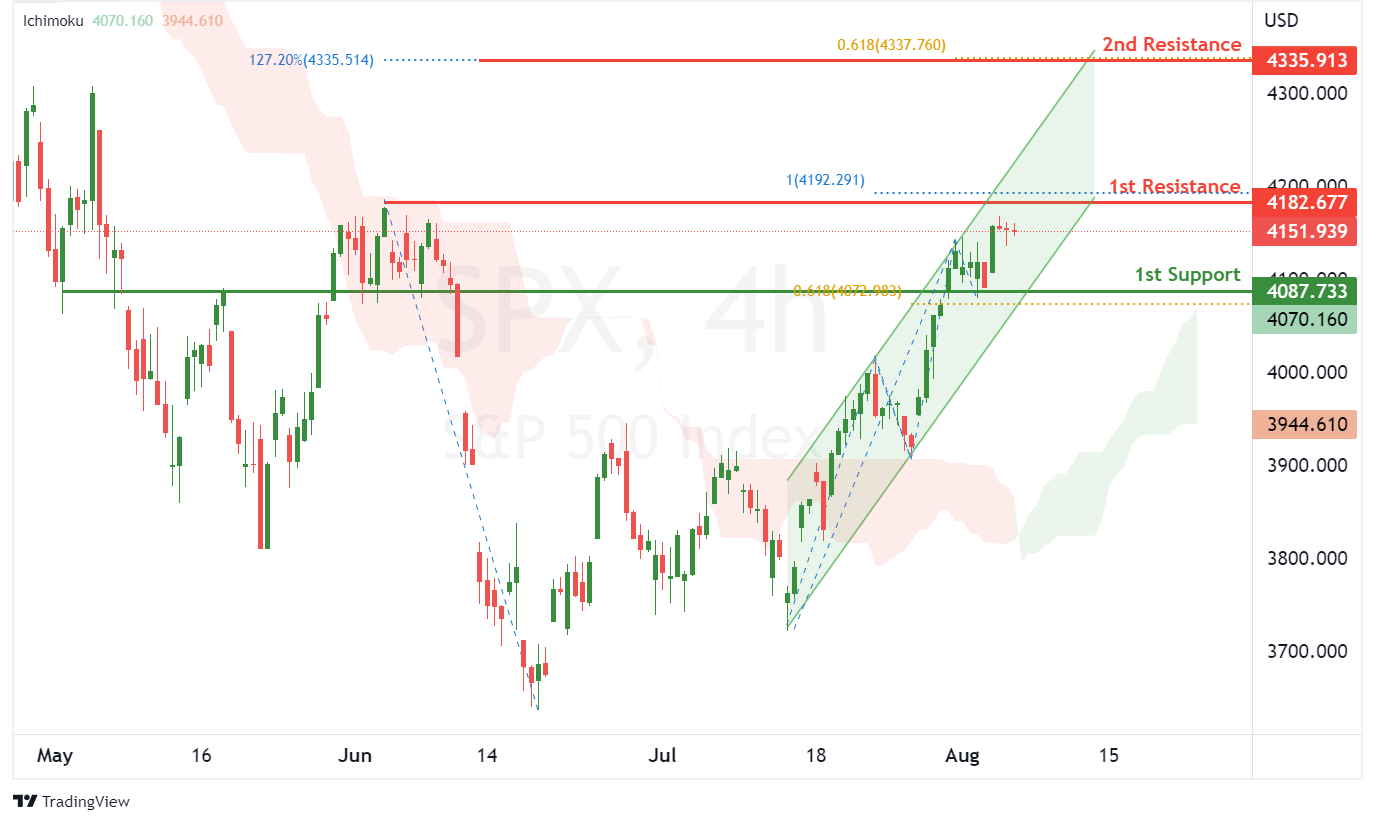
S&P 500:
On the H4, with price moving above the ichimoku indicator and within an ascending channel, we have a bullish bias that price will rise to our 1st resistance at 4182.677 where the swing high resistance and 100% fibonacci projection are. Once there is upside confirmation that price has broken the 1st resistance structure, we would expect bullish momentum to carry price to 2nd resistance at 4335.913 where the 127.2% fibonacci extension and 61.8% fibonacci projection are. Alternatively, price could drop to 1st support at 4087.733 where the overlap support and 61.8% fibonacci projection are.
Areas of consideration:
- H4 time frame, 1st resistance of 4182.677
- H4 time frame, 1st support at 4087.733


