
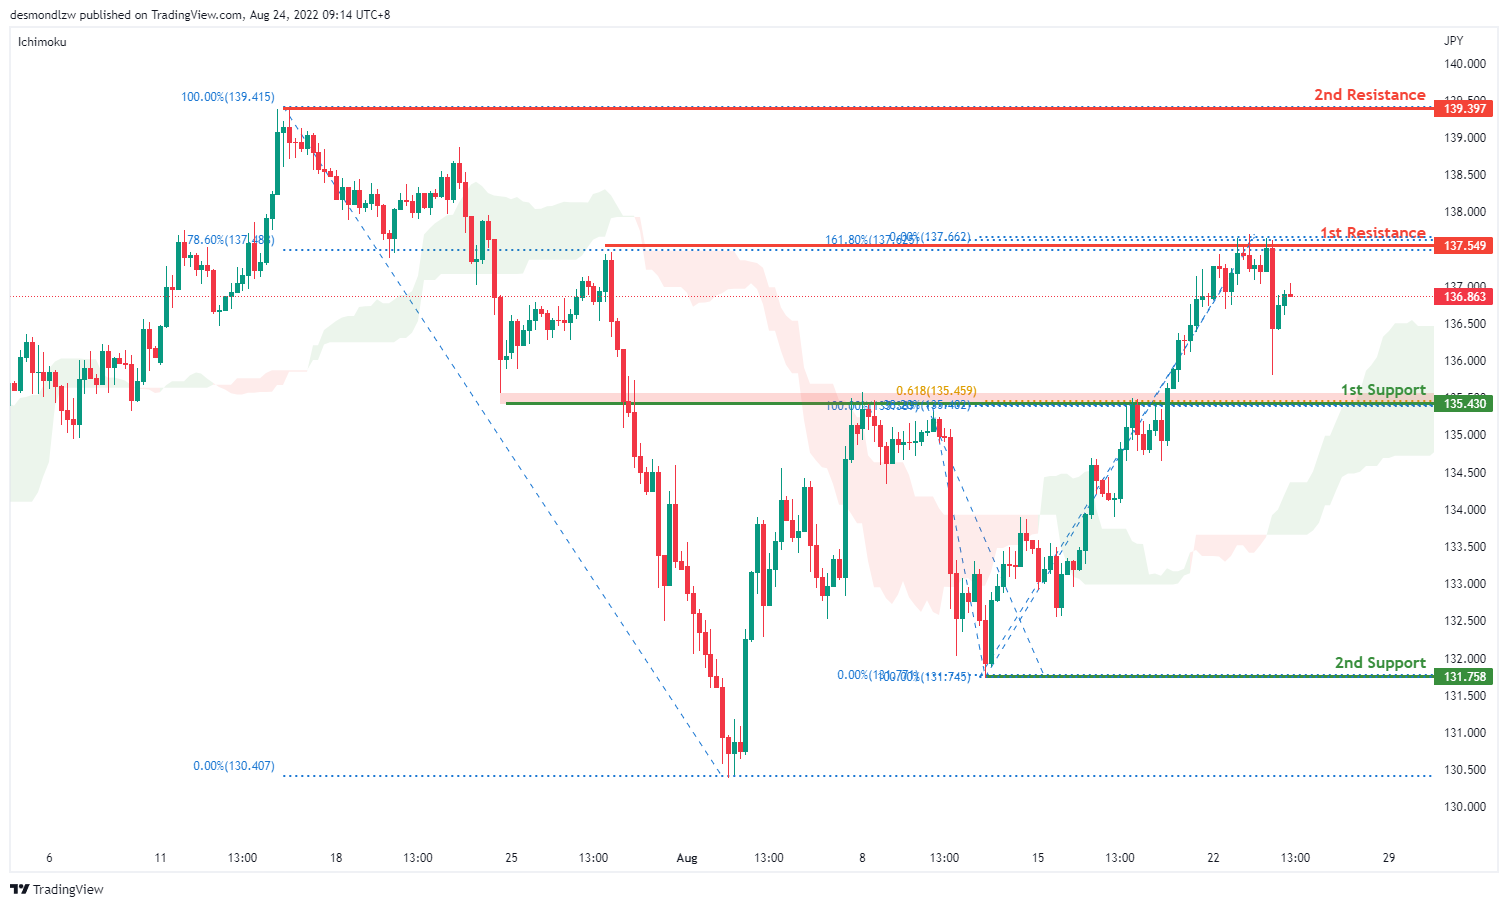
USD/JPY:
On the H4 chart, price has confirmed a bullish momentum breaking the previous high and tested the first resistance at 137.549 where the 78.6% fibonacci retracement and 161.8% extension sits. It has pulled back slightly but if bullish momentum continues, it will bring the price to 139.397 where the swing high sits. Alternatively if price pulls back, it should test the first support at 135.430 where the 61.8% projection sits and the second support at 131.758 where the swing low sits
Areas of consideration:
- H4 time frame, 1st resistance at 137.549
- H4 time frame, 1st support at 135.430
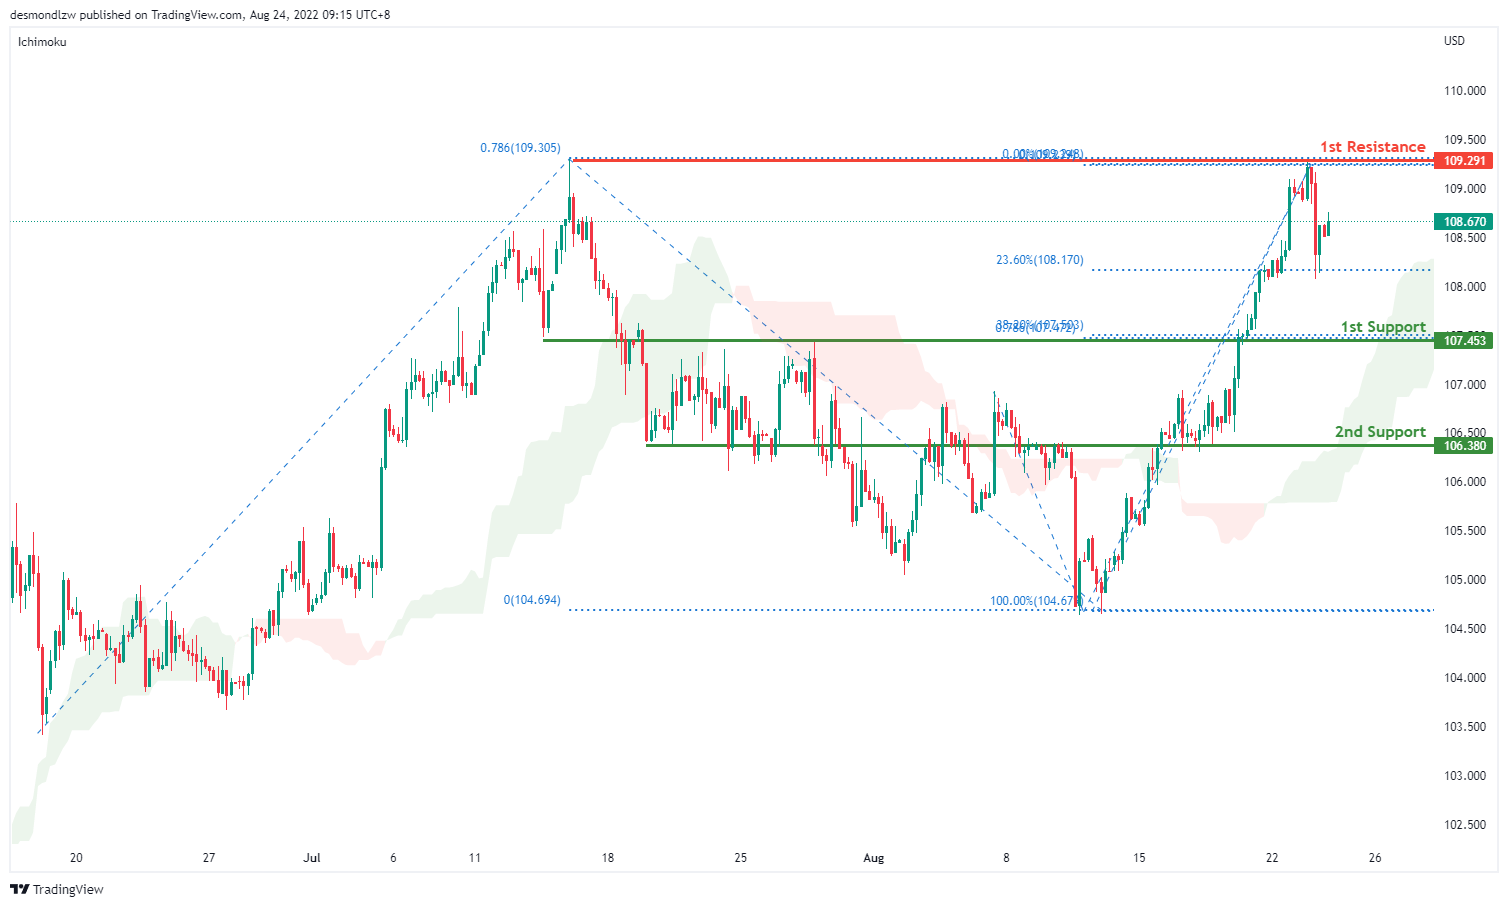
DXY:
On the H4, prices seem to be moving in an ascending trend and is in a bullish momentum. Price has tested first resistance at 109.291 where the 78.6% Fibonacci projection and the previous swing high sits and has pulled back slightly to the 23.6% retracement levels. If price fails to break the first resistance, it should pull back to test the first support at 107.453 where the 38.2% retracement and 78.6% projection sits and subsequently the second support at 106.380 where the 61.8% retracement sits
Areas of consideration:
- H4 time frame, 1st resistance at 109.291
- H4 time frame, 1st support at 107.453
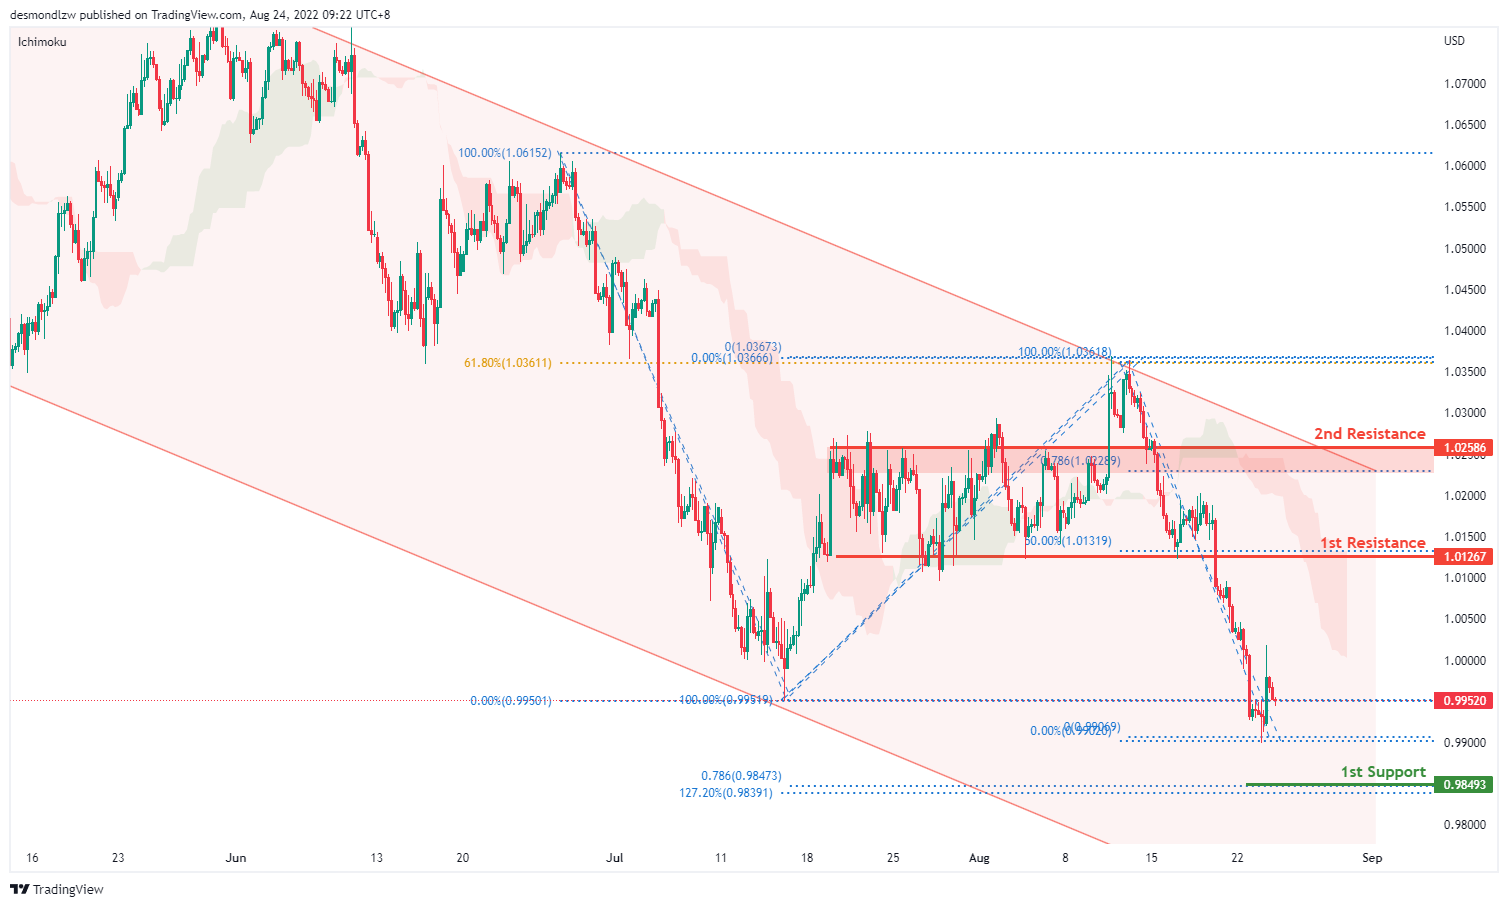
EUR/USD :
On the H4, prices have broken the ascending trend and are below the ichimoku indicator, we are bearish bias. Prices are testing the first support at 0.9955 where the 61.8% projection sits. Alternatively, prices could pull back to test the first resistance at 1.0116 where the previous swing low sits and subsequently the second resistance at 1.0353 where the 61.8% retracement and swing high sits
Areas of consideration :
- H4 1st resistance at 1.0116
- H4 1st support at 0.9955
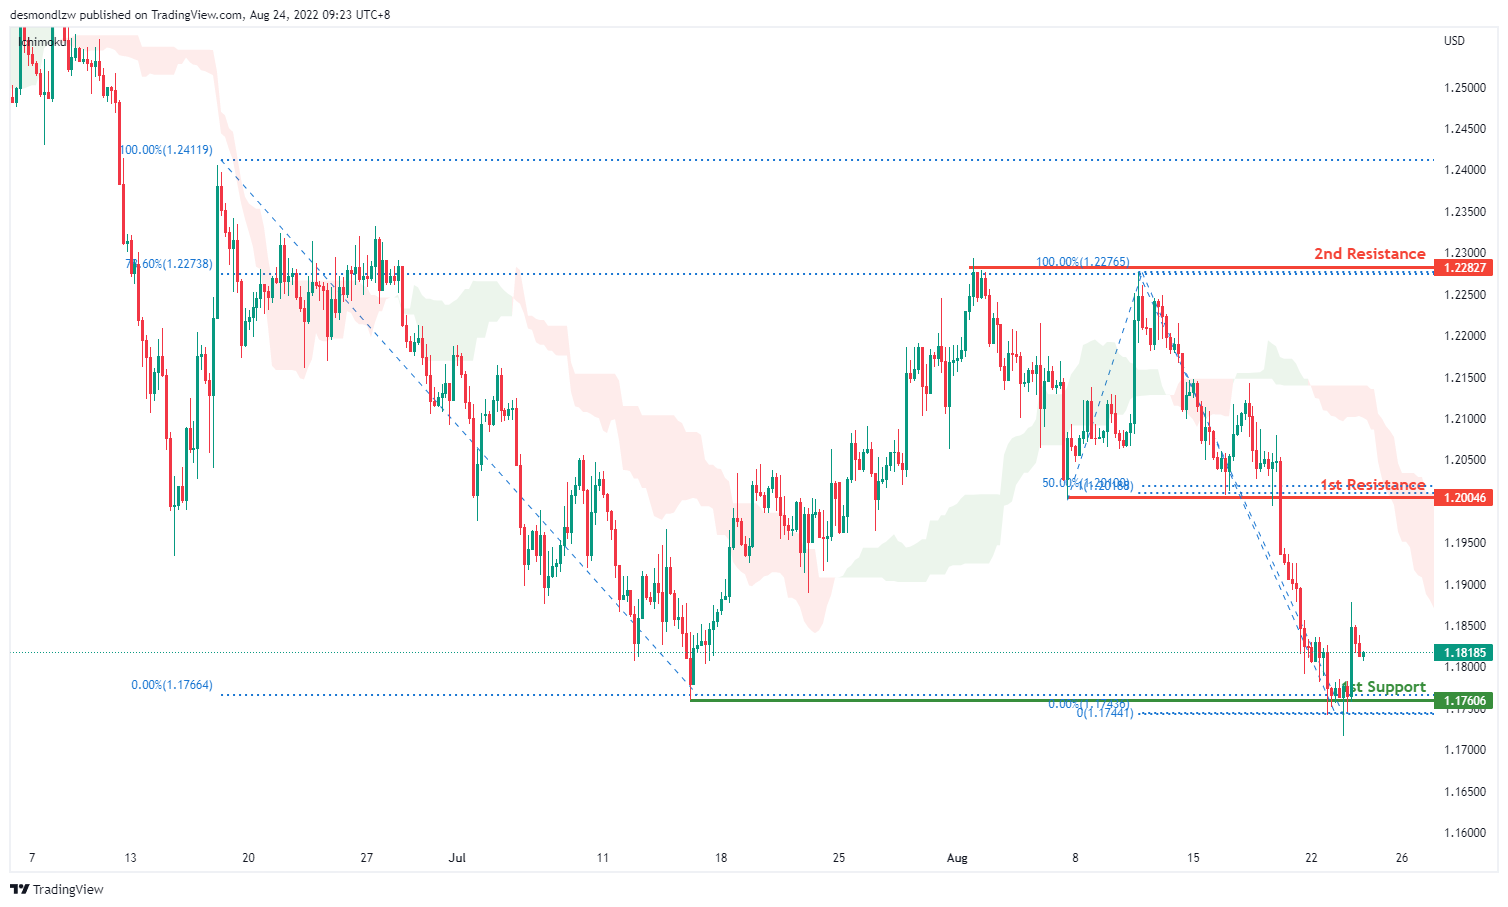
GBP/USD:
On the H4, prices seem to be in a bearish momentum. It is currently testing the first support at 1.1760 where the swing low sits. Alternatively, price can pull back to test the first resistance at 1.2004 where the 50% retracement and 100% projection sits. Subsequently testing the second resistance at 1.2282 where 78.6% retracement and the swing high sits
Areas of consideration:
- H4 1st resistance at 1.2004
- H4 1st support at 1.1760
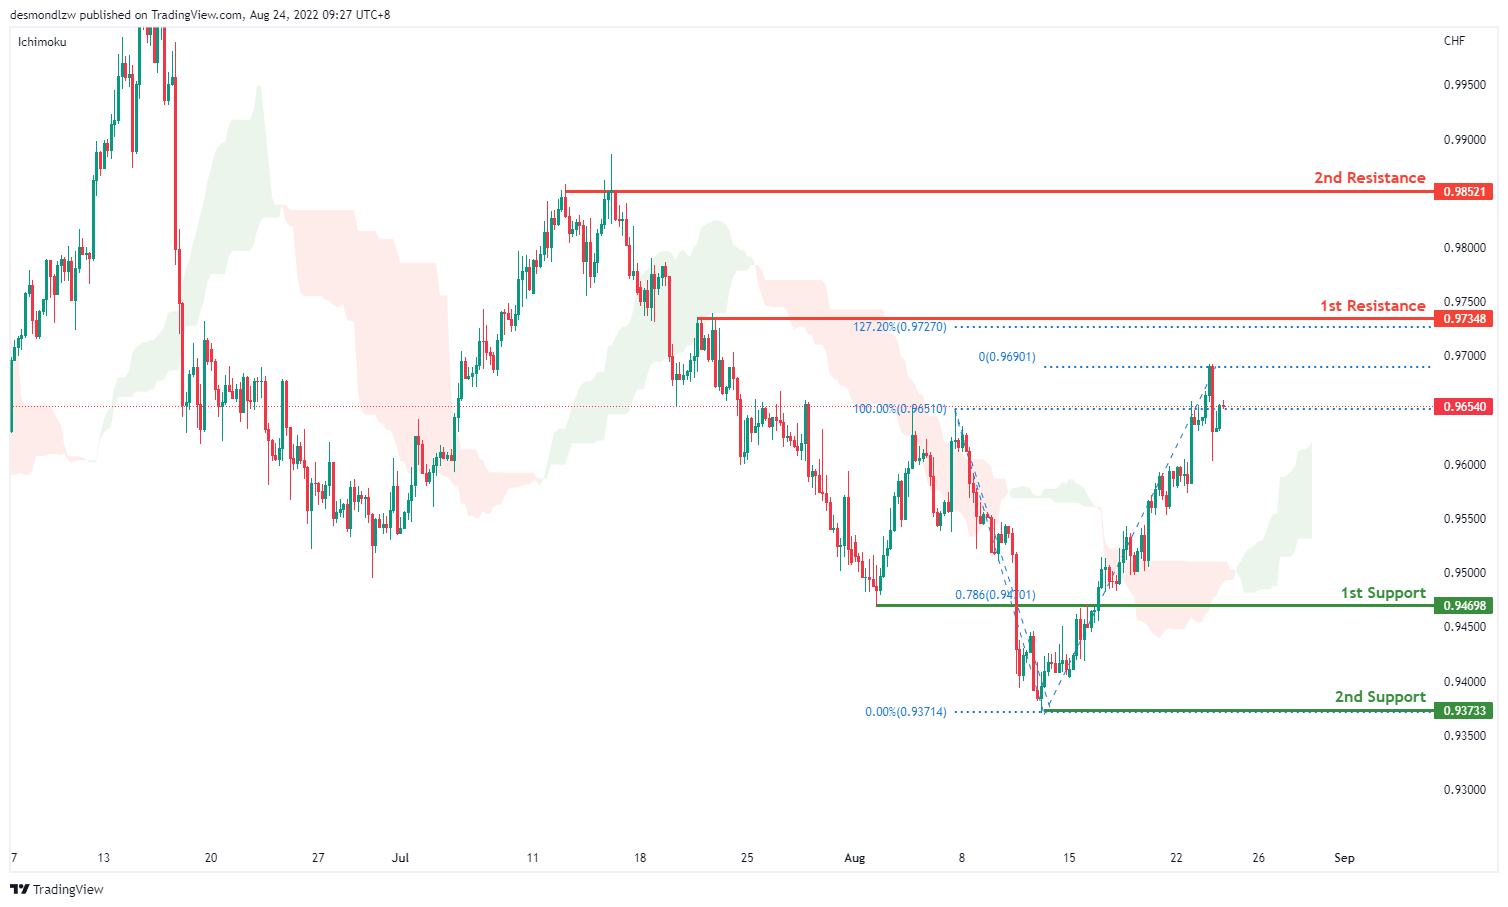
USD/CHF:
On the H4, with prices moving above the ichimoku cloud and breaking the descending trend, we are bullish bias. Price is testing the first resistance at 0.9657 where the previous swing high sits. If price continues with the bullish momentum it will test the second resistance at 0.9734. Alternatively, prices could test the intermediate support at 0.9469 where the swing low sits and then the first support at 0.9369 where the 78.6% fibonacci retracement sits
Areas of consideration
- H4 1st support at 0.9369
- H4 1st resistance at 0.9657
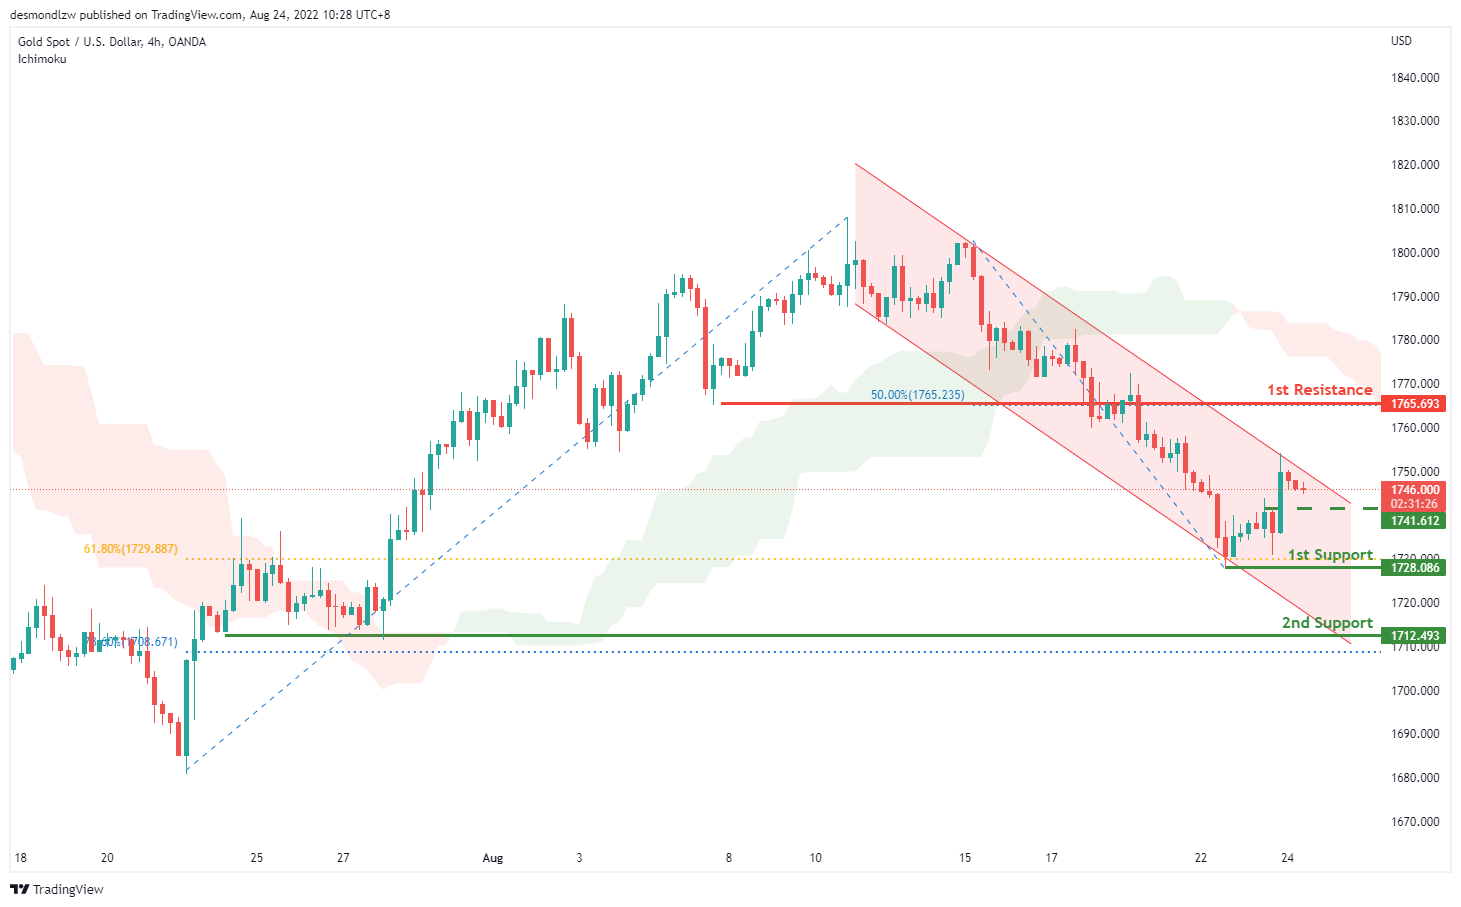
XAU/USD (GOLD):
On the H4, with prices moving within the descending trendline, below ichimoku cloud, we have a bearish bias that the price may drop to the 1st support at 1728.086, which is in line with the 61.8% fibonacci retracement, if the price break this level, it may drop to the 2nd support at 1712.493, where the 78.6% fibonacci retracement and swing low are. Alternatively, the price may pullback and rise to the 1st resistance at 1765.693, where the 50% fibonacci retracement is. Take note the 1741.612 could be our intermediate support, which is in line with the pullback support.
Areas of consideration:
- H4 time frame, 1st support at 1728.086
- H4 time frame, 2nd support at 1712.493
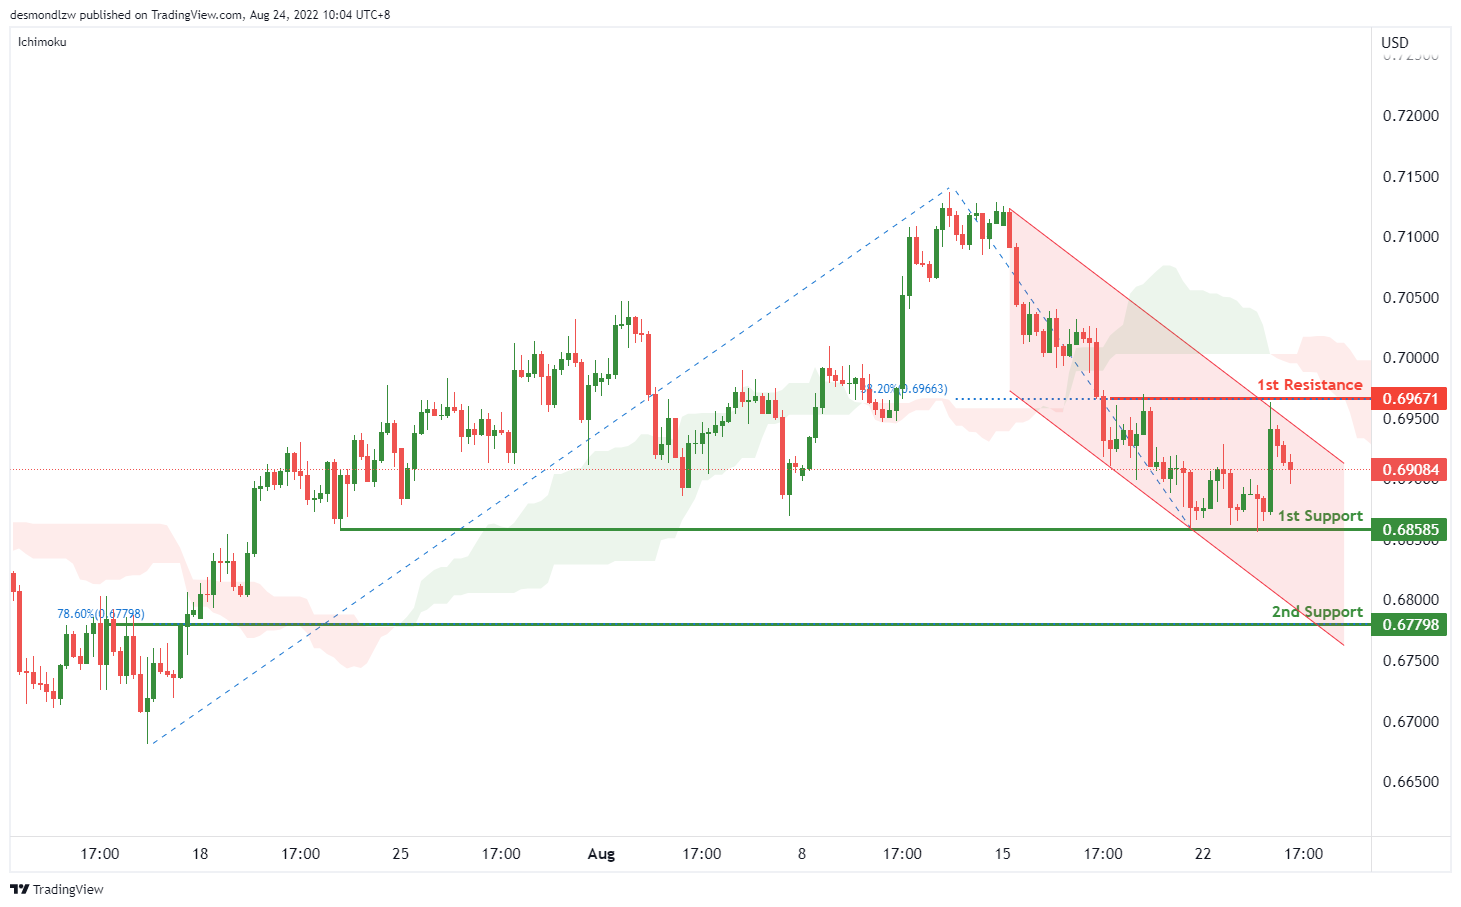
AUD/USD:
On the H4, with the price going within the descending channel and below ichimoku cloud, we have a bearish bias that the price may drop to the 1st support at 0.68585, which is in line with the previous swing low. If the price breaks the 1st support, we can expect it to drop to the 2nd support at 0.67798, where the 78.6% fibonacci retracement is. Alternatively, the price may rise to the 1st resistance at 0.69671, where the swing high and 38.2% fibonacci retracement are.
Areas of consideration
- H4 1st support at 0.68585
- H4 2nd support at 0.67798
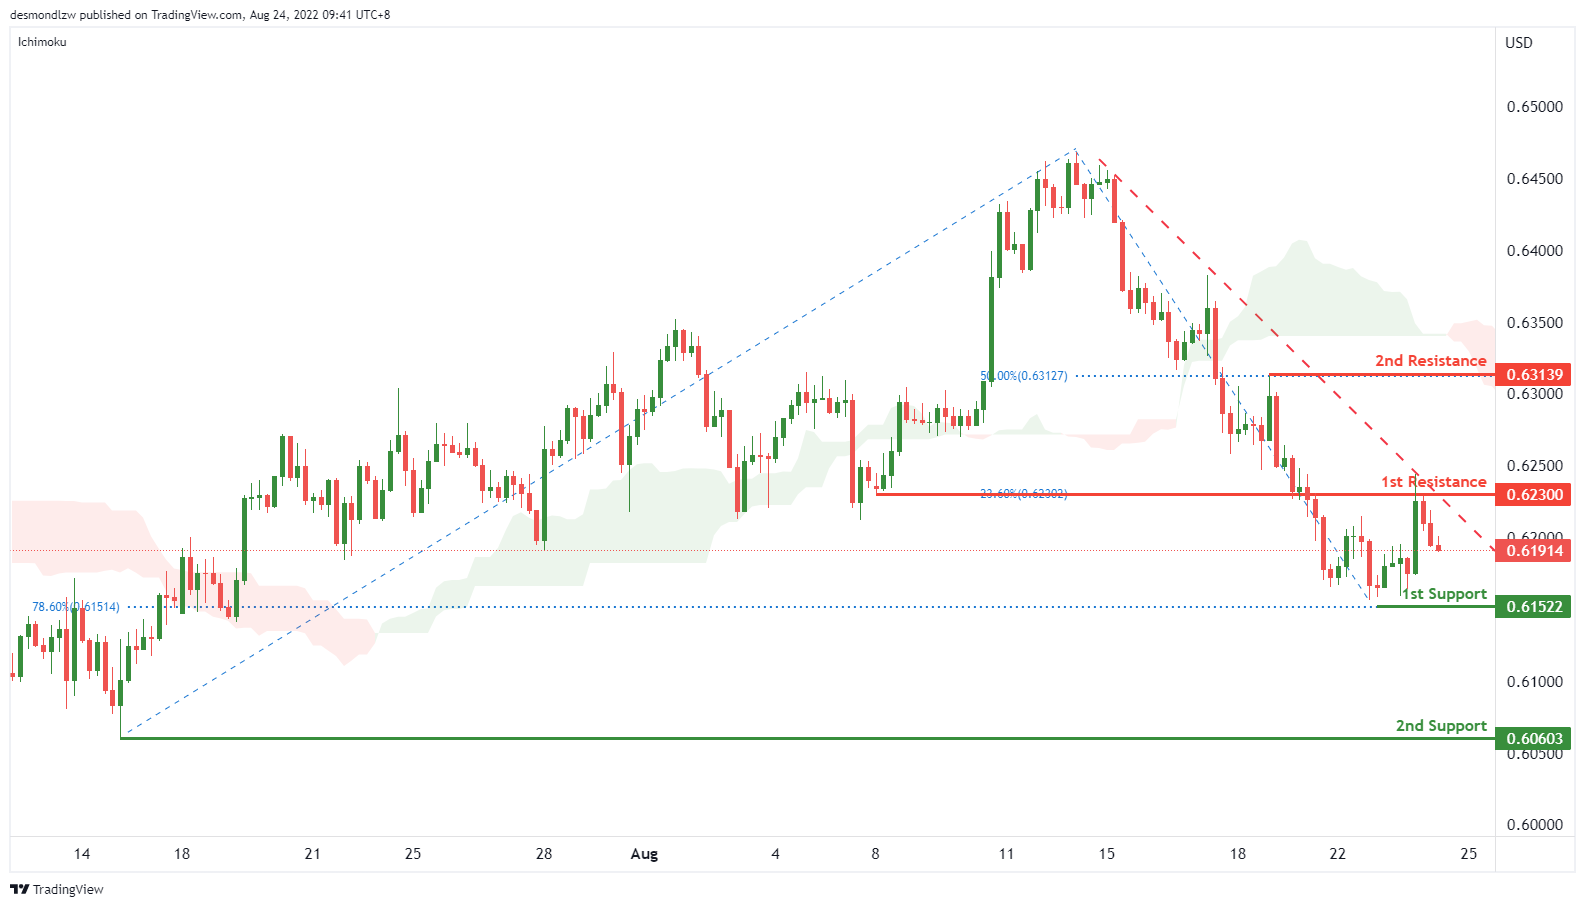
NZD/USD:
On the H4, with the price moving within the descending trendline, below ichimoku cloud, we have a bearish bias that the price may drop to the 1st support at 0.61522, which is in line with the 78.6% fibonacci retracement and pervious swing low, if the price continue dropping, the price may drop to the 2nd support at 0.60603, which is in line with the swing low. Alternatively, the price may rise to the 1st resistance at0.62300, where the 23.6% fibonacci retracement and overlap resistance are. If the price break this resistance level, we can expect the price rise to the 2nd resistance at 0.63139, which is in line with the swing high and 50% fibonacci retracement.
Areas of consideration:
- H4 time frame, 1st support at 0.61471
- H4 time frame, 2nd support at 0.60603
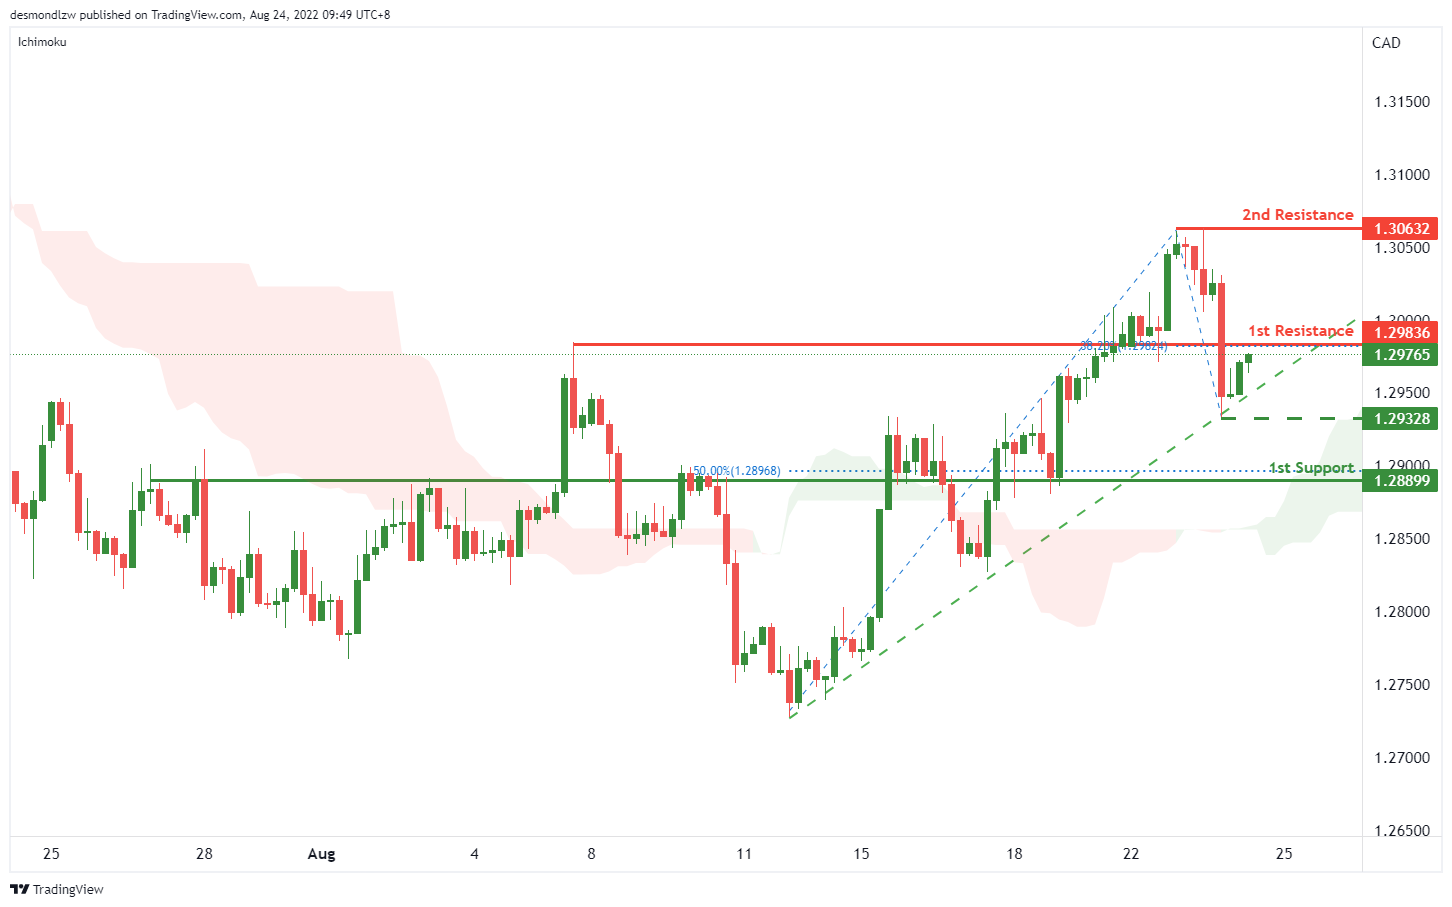
USD/CAD:
On the H4, with the price above the ichimoku cloud and moving within the ascending trendline, we have a bullish bias that if the price break the 1st resistance at 1.29836, which is the current swing high and 38.2% fibonacci retracement, the price may rise to the 2nd resistance at 1.30632, which is in line with the swing high. Alternatively, the price may drop to the 1st support at 1.28899, where the 50% fibonacci retracement is. Take note the price of 1.29328 could be the intermediate support, if the price breaks this support, the ascending trendline will be broken.
Areas of consideration:
- H4 time frame, 1st resistance at 1.29836
- H4 time frame, 2nd resistance at 1.30632
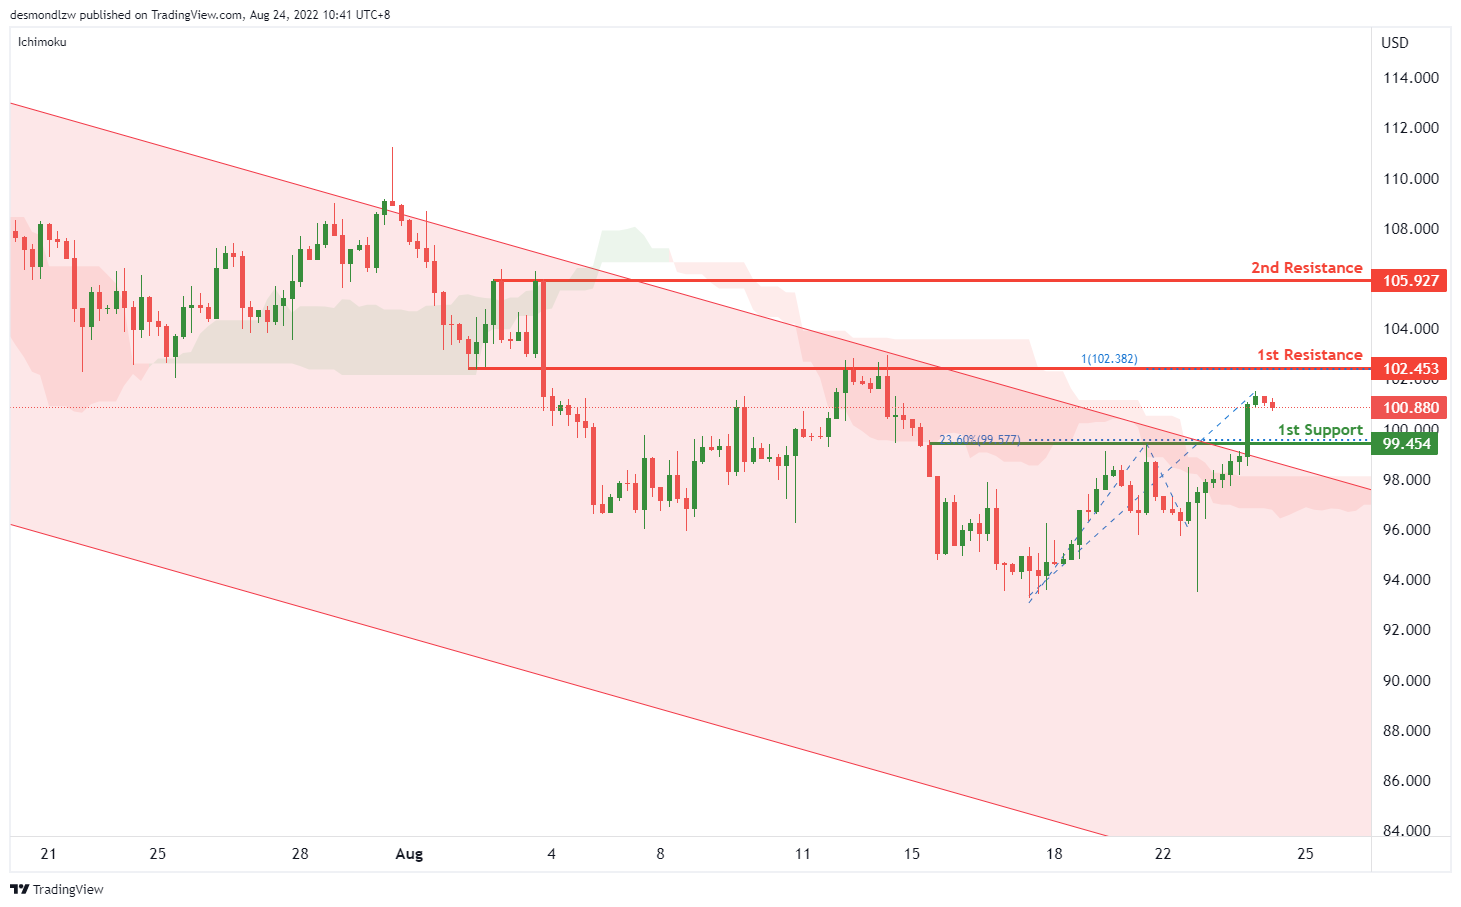
OIL:
On the H4, with price breaking the descending channel and above ichimoku cloud, we have a bullish bias that the price may rise to the 1st resistance at 102.453, where the 100% fibonacci projection and overlap resistance are. If the price breaks this level, we can expect the price to rise to the 2nd resistance at 105.927, where the swing highs are. Alternatively, the price may drop to the 1st support at 99.454, where the 23.6% fibonacci retracement and pullback support are.
Areas of consideration:
- H4 time frame, 1st resistance at 102.453
- H4 time frame, 2nd resistance at 105.927
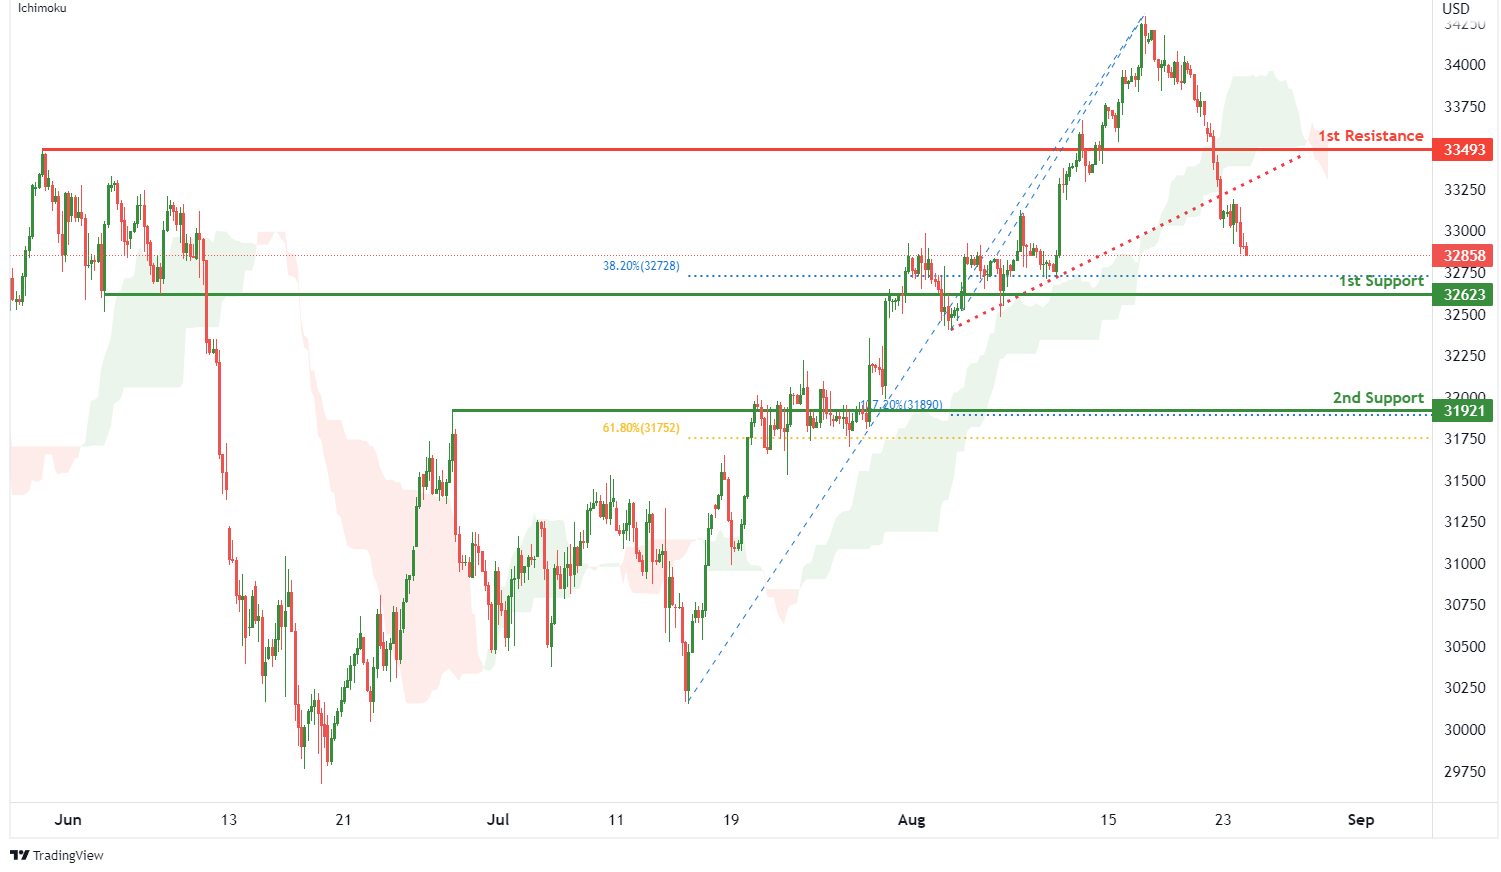
Dow Jones Industrial Average:
On the H4, with price breaking out of the ascending trendline and moving below the ichimoku indicator, we have a bearish bias that price will drop to 1st support at 32623 where the pullback support and 38.2% fibonacci retracement are. Once there is downside confirmation of price breaking 1st support, we would expect bearish momentum to carry price to 2nd support at 31921 where the pullback support, 61.8% fibonacci retracement and 127.2% fibonacci extension are. Alternatively, price could rise to 1st resistance at 33493 where the pullback resistance is.
Areas of consideration:
- H4 time frame, 1st resistance of 33493
- H4 time frame, 1st support at 32623
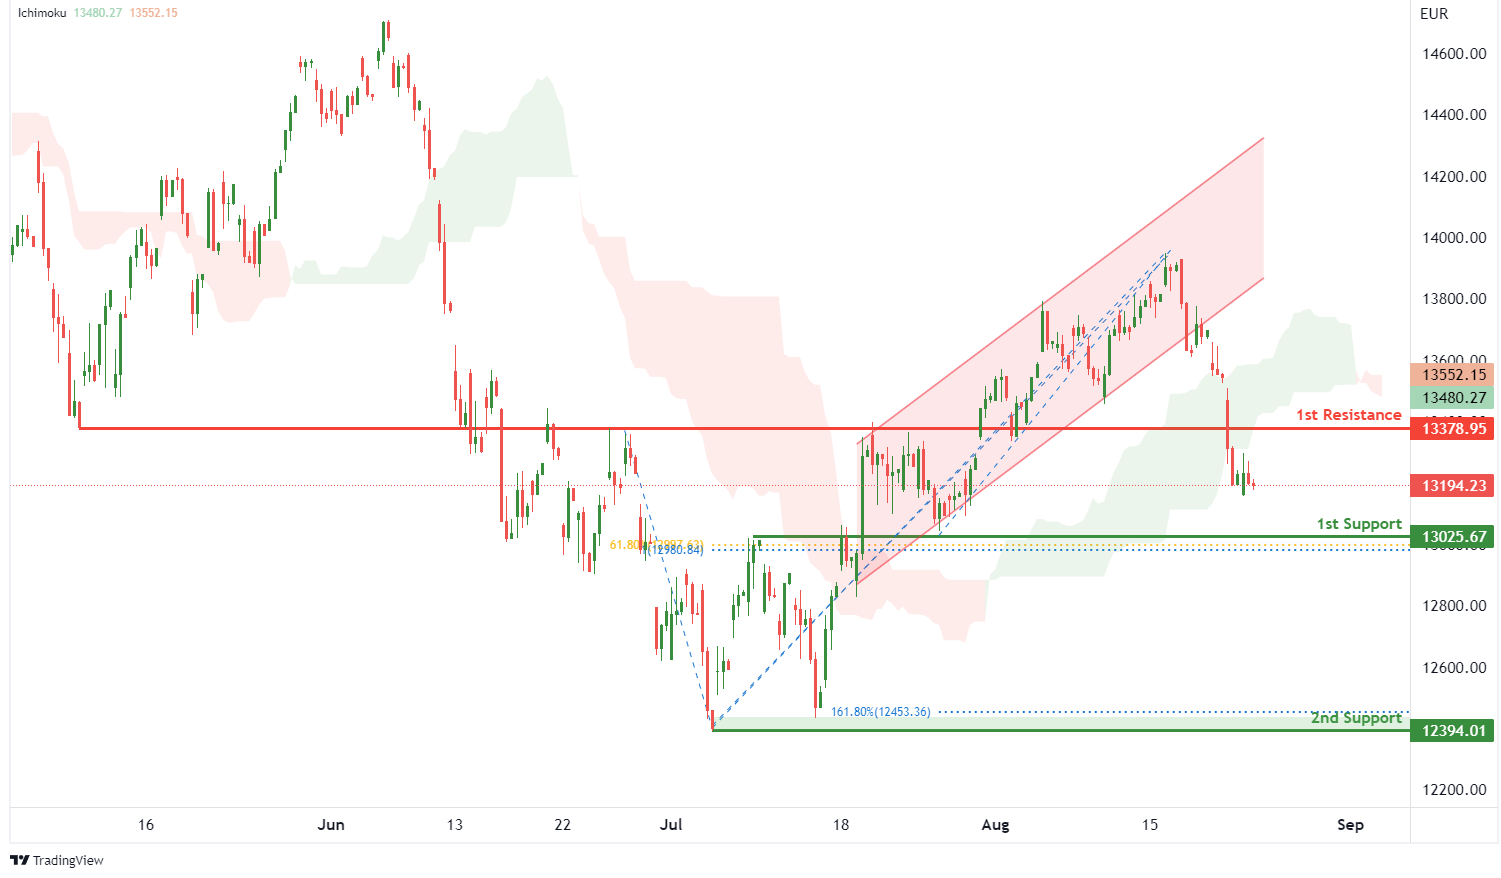
DAX:
On the H4, with price breaking out of an ascending channel and moving below the ichimoku indicator, we have a bearish bias that price will drop to the 1st support at 13025.67 where the pullback support, 61.8% fibonacci retracement and 100% fibonacci projection are. Once there is downside confirmation that price has broken 1st support, we would expect bearish momentum to carry price to 2nd support at 12394.01 where the swing low support and 161.8% fibonacci extension are. Alternatively, price could rise to 1st resistance at 13378.95 where the overlap resistance is.
Areas of consideration:
- H4 time frame, 1st resistance of 13378.95
- H4 time frame, 1st support at 13025.67
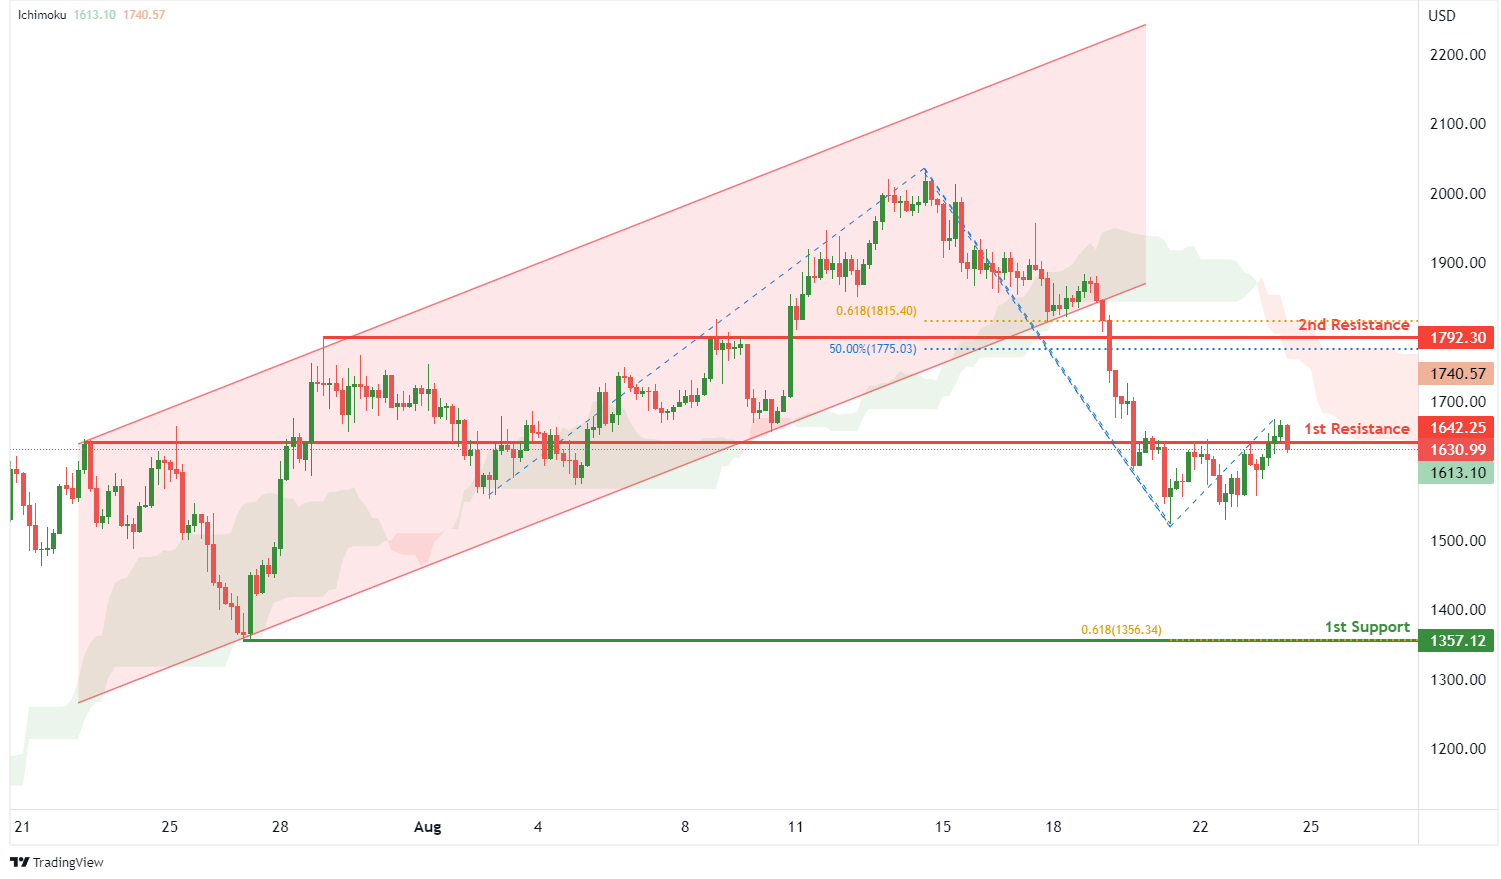
ETHUSD:
On the H4, with price breaking out of an ascending channel and moving below the ichimoku indicator, we have a bearish bias that price will drop from the 1st resistance at 1642.25 where the pullback resistance is to the 1st support at 1357.12 where the swing low support and 61.8% fibonacci projection are. Alternatively, price could break 1st resistance and rise to 2nd resistance at 1792.30 where the overlap resistance, 50% fibonacci retracement and 61.8% fibonacci projection are.
Areas of consideration:
- H4 time frame, 1st resistance of 1642.25
- H4 time frame, 1st support at 1357.12
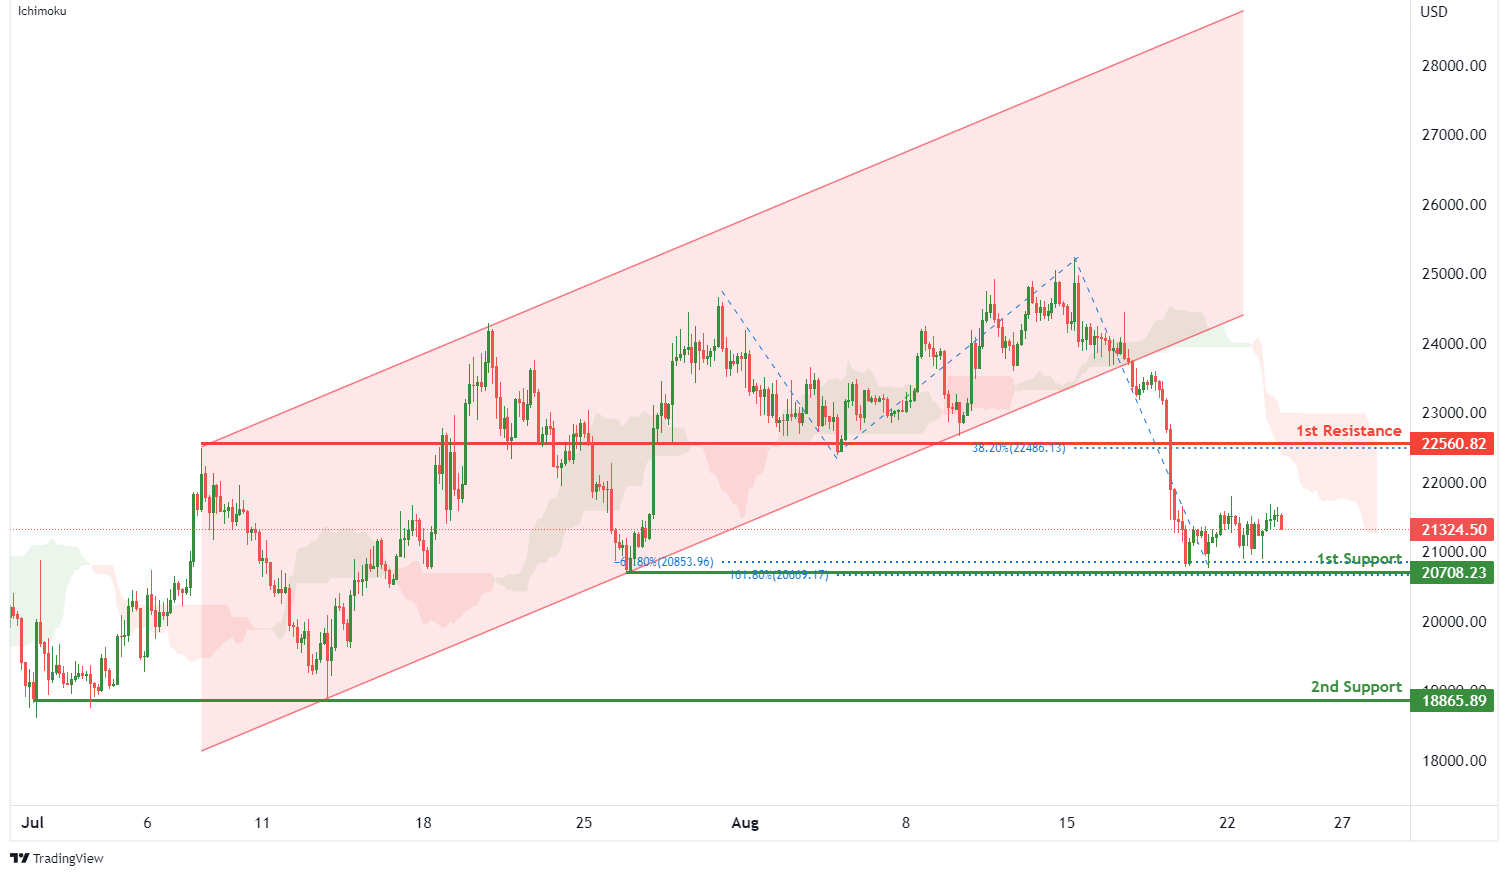
BTCUSD:
On the H4, with price breaking out of a bullish channel and moving below the ichimoku indicator, we have a bearish bias that price will drop to 1st support at 20708.23 where the -61.8% fibonacci expansion, 161.8% fibonacci extension and swing low support are. Once we have downside confirmation of price breaking 1st support structure,we would expect bearish momentum to carry price to 2nd support at 18865.89 where the swing low support is. Alternatively, price could rise to 1st resistance at 22560.82 where the pullback resistance and 38.2% fibonacci retracement are.
Areas of consideration:
- H4 time frame, 1st resistance of 22560.82
- H4 time frame, 1st support at 20708.23
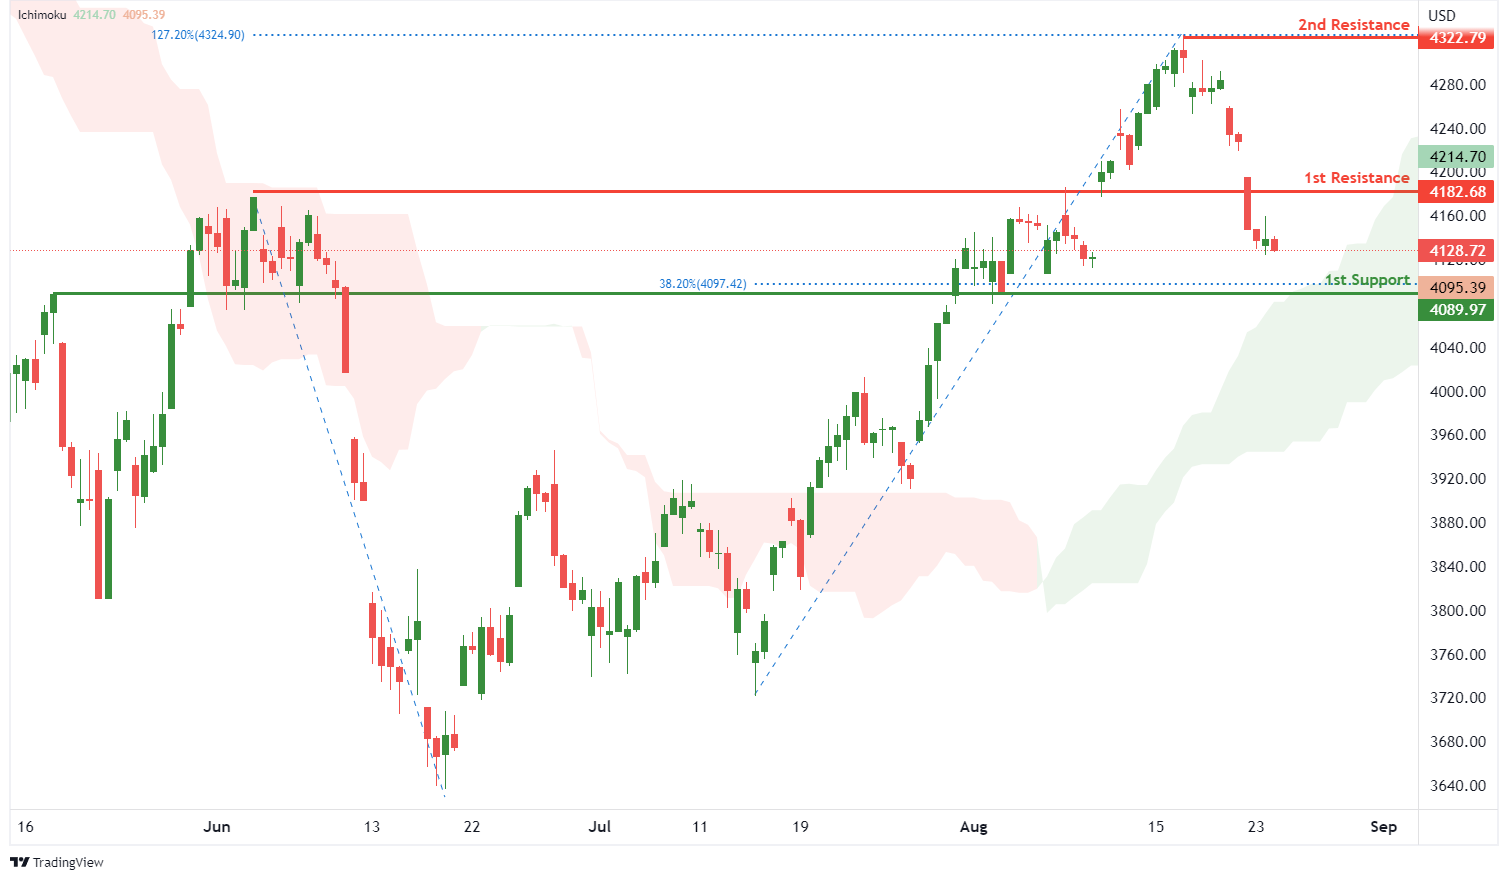
S&P 500:
On the H4, with prices moving above the ichimoku indicator, we have a bullish bias that the price will rise to 1st resistance at 4182.68 where the pullback resistance is. Once there is upside confirmation of price breaking 1st resistance structure, we would expect bullish momentum to carry price to 2nd resistance at 4322.79 where the swing high resistance and 127.2% fibonacci extension are. Alternatively, price could drop to 1st support at 4089.97 where the pullback support and 38.2% fibonacci retracement are.
Areas of consideration:
- H4 time frame, 1st resistance of 4182.68
- H4 time frame, 1st support at 4089.97


