

Currency pair EUR/USD
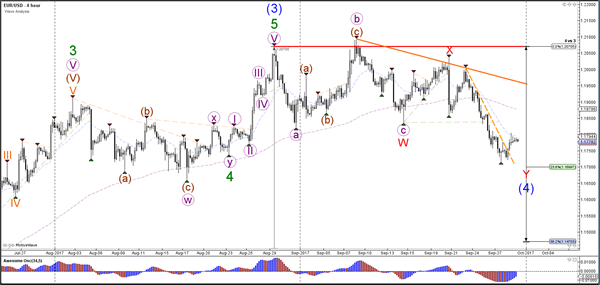
The EUR/USD bounced at the 23.6% Fibonacci support level of wave 4 (blue). Price broke above the steep trend line (dotted orange) and could be ready to test the resistance levels at 1.1850 at 1.1950. A failure to break these resistance zones could indicate a larger expanded correction within wave 4 (blue).
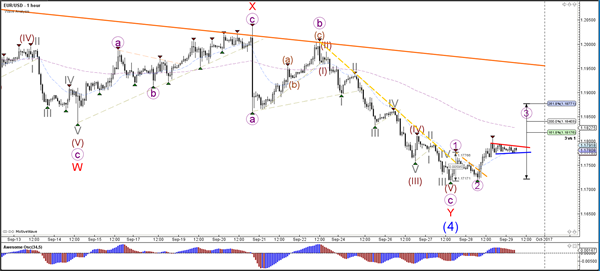
The EUR/USD broke above 2 resistance trend lines (dotted lines) and could be building either a bullish 123 or ABC wave. Price is now building a small triangle (red/blue lines).
Currency pair GBP/USD
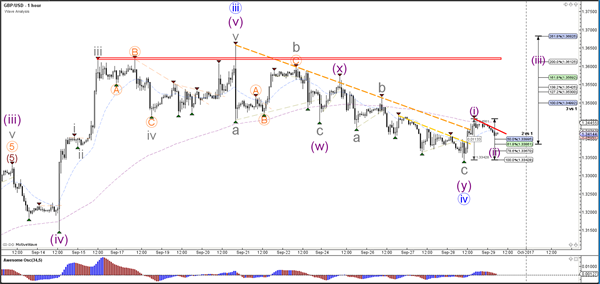
The GBP/USD bounced at the 38.2% Fibonacci level of the potential wave 4 (blue). The Fibonacci levels are acting as a support for a continuation of the uptrend via wave 5.
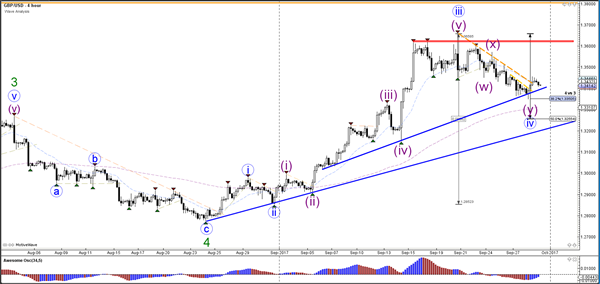
The GBP/USD has also broken above the resistance trend line (dotted lines) and could be building either a wave 123 or ABC. A new break above resistance (red) could indicate a bullish continuation
Currency pair USD/JPY
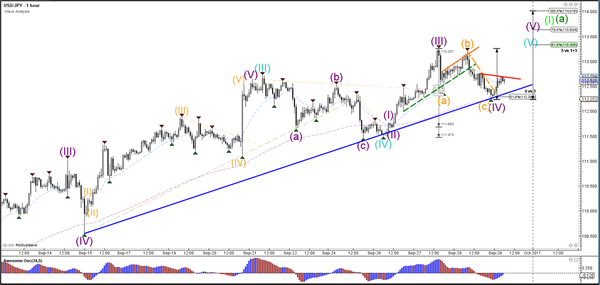
The USD/JPY is testing the support trend line (blue). A bounce could indicate the continuation within wave 5 (blue) whereas a break could indicate the end of wave 1 or wave A at the recent high.
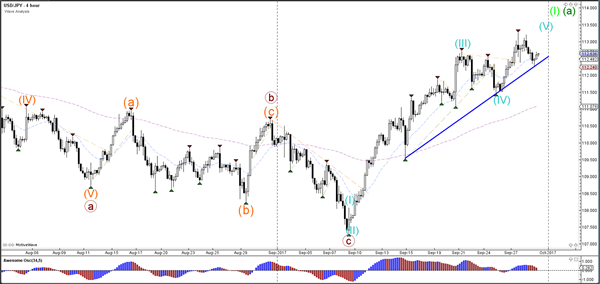
The USD/JPY could potentially have completed an ABC (orange) correction within wave 4 (purple) at the 61.8% Fibonacci support level. The support and resistance trend lines will indicate to which direction price will break.