
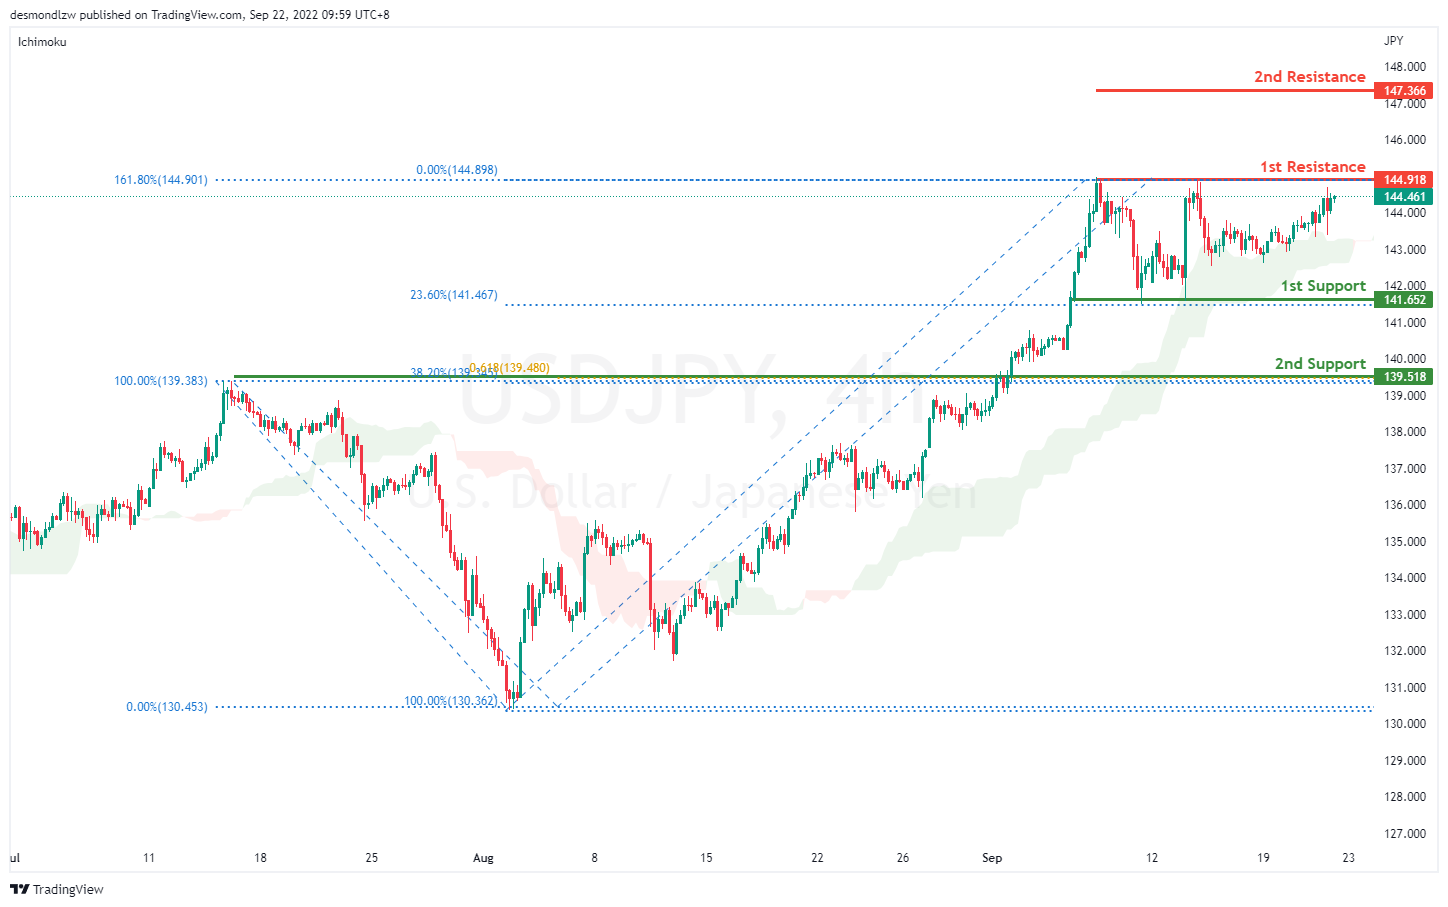
USD/JPY:
On the H4 chart, price is still respecting the ascending momentum. We are still bullish bias- Price is testing above the previous low and if bullish momentum continues, it should bring price to first resistance at 144.918 where the 161.8% extension sits. If it breaks this level, it should bring price to 147.366 where the previous swing high sits. Alternatively it could pull back to the first support at 141.652 where the 23.6% retracement and 100% projection sits then to the second support at 139.518 where the 38.2% retracement, 61.8% projection and overlapping support sits.
Areas of consideration:
- H4 time frame, 1st resistance at 144.918
- H4 time frame, 1st support at 141.652
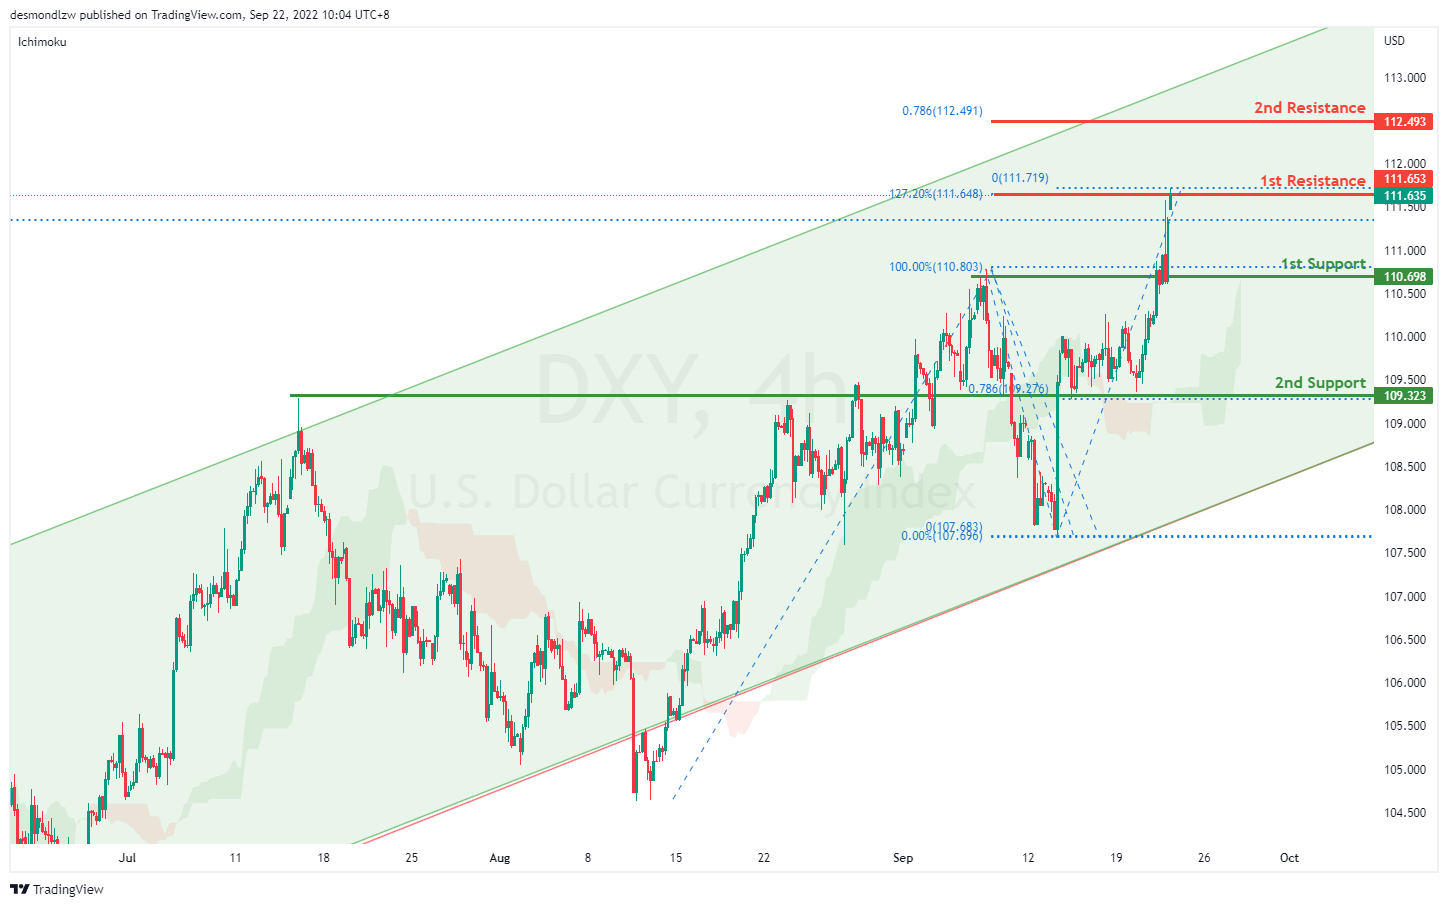
DXY:
On the H4, price is still respecting the bullish channel and has failed to break the first support- we are bullish bias. Price has broken the previous high to test at the first resistance at 111.635 where the 127.2% extension sits. If bullish momentum continues, it should bring price toward the second resistance at 112.493 where the 78.6% projection sits. Alternatively, it could pull back to test the first support at 110.698 where the previous swing high sits then the second support at 109.323 where the 78.6% projection and previous swing high sits
Areas of consideration:
- H4 time frame, 1st resistance at 111.635
- H4 time frame, 1st support at 110.698
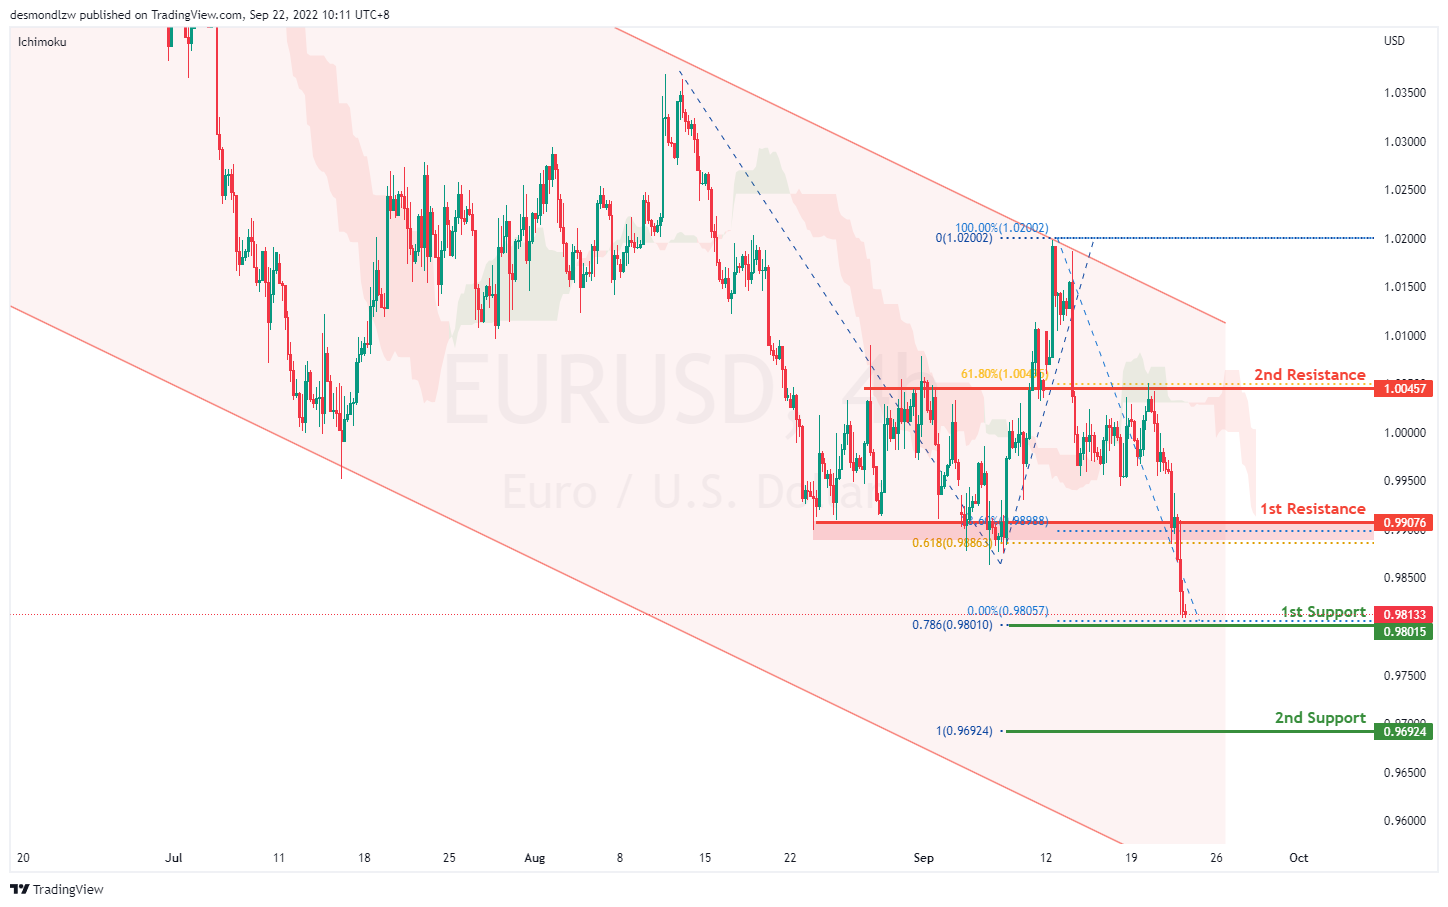
EUR/USD:
On the H4, price is moving within the channel in a descending manner- we are bearish biased. Price is currently testing the first support at 0.9801 where the 78.6% projection sits. If price breaks this level, it will bring prices to the second support at 0.9692 where the 100% projection sits. Alternatively it could pull back to test the first resistance at 0.9907 level where the 23.6% retracement, 61.8% projection and previous swing low sits then to the second resistance at 1.0045 where the 61.8% retracement and previous swing high sits.
Areas of consideration :
- H4 1st resistance at 0.9907
- H4 1st support at 0.9801
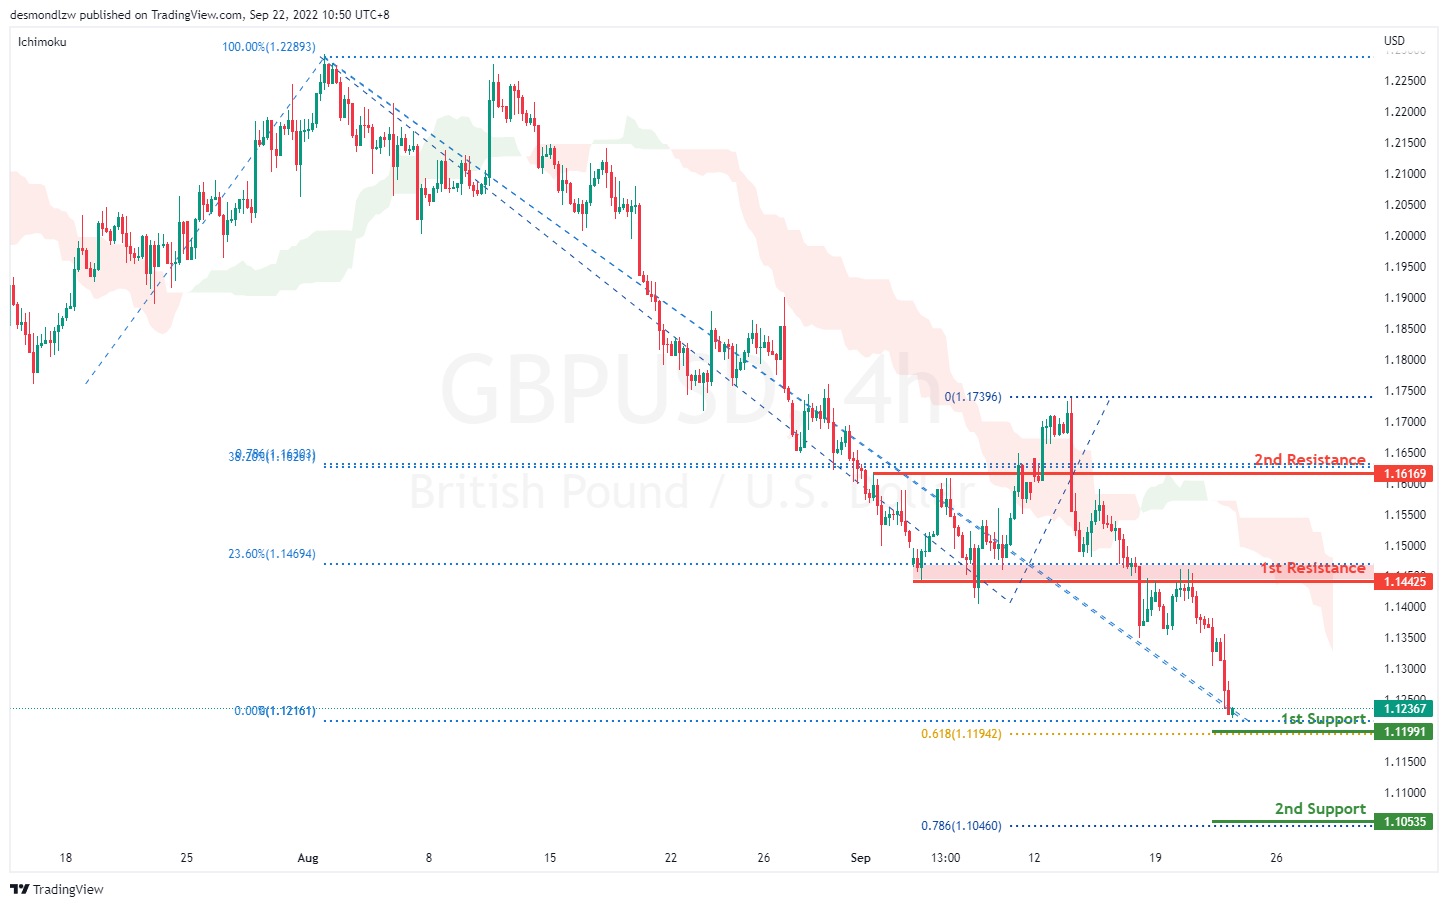
GBP/USD:
On the H4, prices are still moving in a bearish momentum hence we are bearish biassed. If bearish momentum continues, it should test the first support at 1.1199 levels where the 61.8% projection sits then the second support at 1.1053 where the 78.6% projection sits. Alternatively, price could pull back to test the first resistance at 1.1442 where the 23.6% retracement and overlapping resistance sits then the second resistance at 1.1616 where the 38.2% retracement, 78.6% projection and previous swing high sits
Areas of consideration:
- H4 1st resistance at 1.1442
- H4 1st support at 1.1199
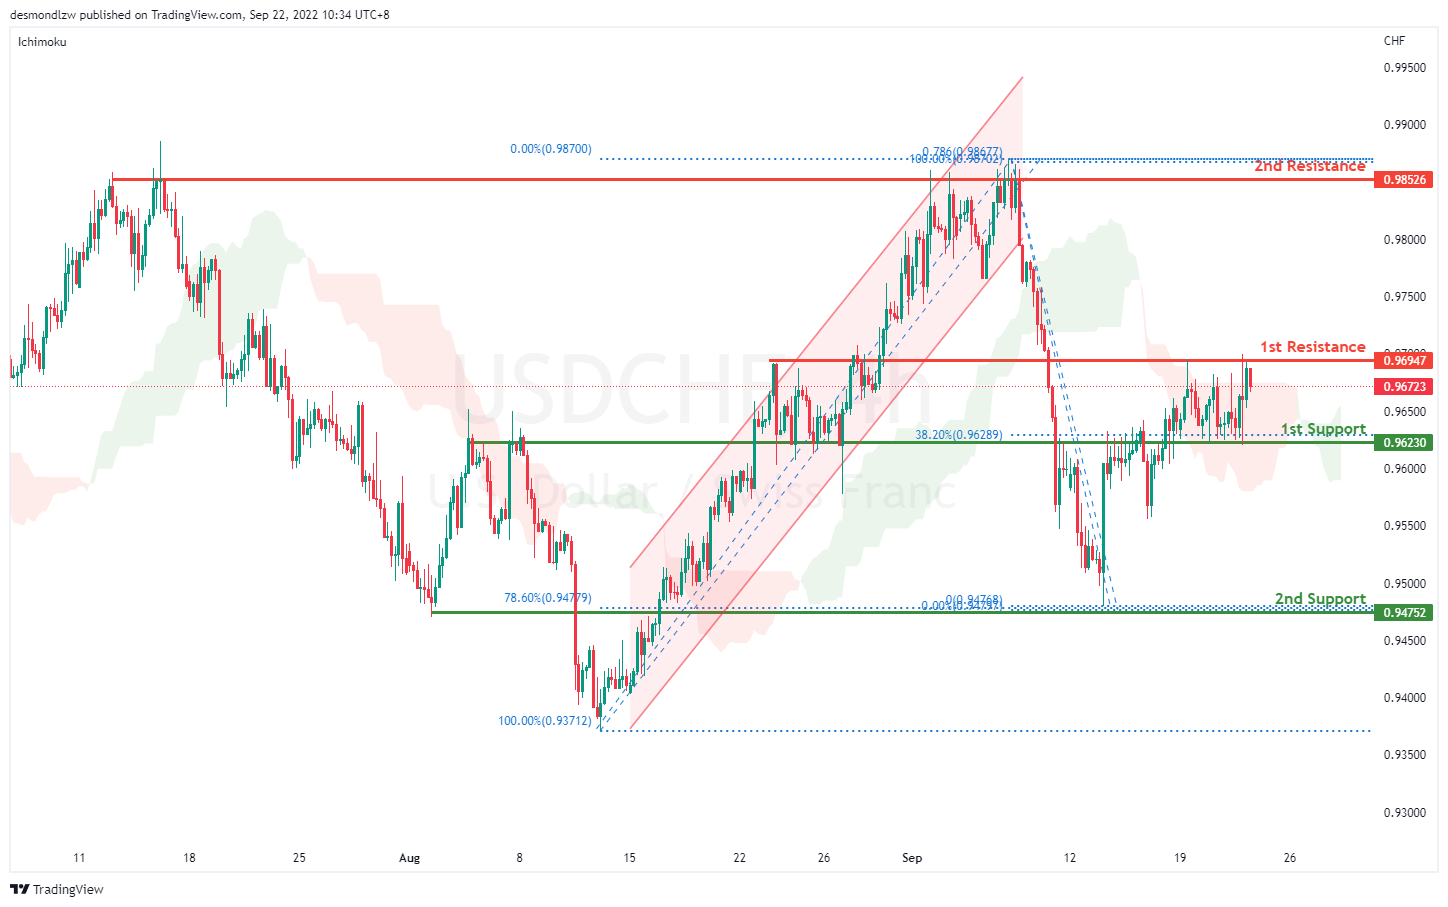
USD/CHF:
On the H4, prices have broken the descending channel and we are currently bullish biased. Price has broken the first support and is moving toward the the first resistance at 0.9688 where the 50% retracement sits. If bullish momentum continues, it should bring price to the second resistance at 0.9852 where the swing high and 78.6% projection sits. Alternatively, price could pull back to test the first support at 0.9623 where the overlapping resistance sits. If price continues with the bearish momentum, it should bring price to the second support at 0.9475 where the 78.6% projection and 78.6% retracement sits.
Areas of consideration
- H4 1st support at 0.9623
- H4 1st resistance at 0.9694
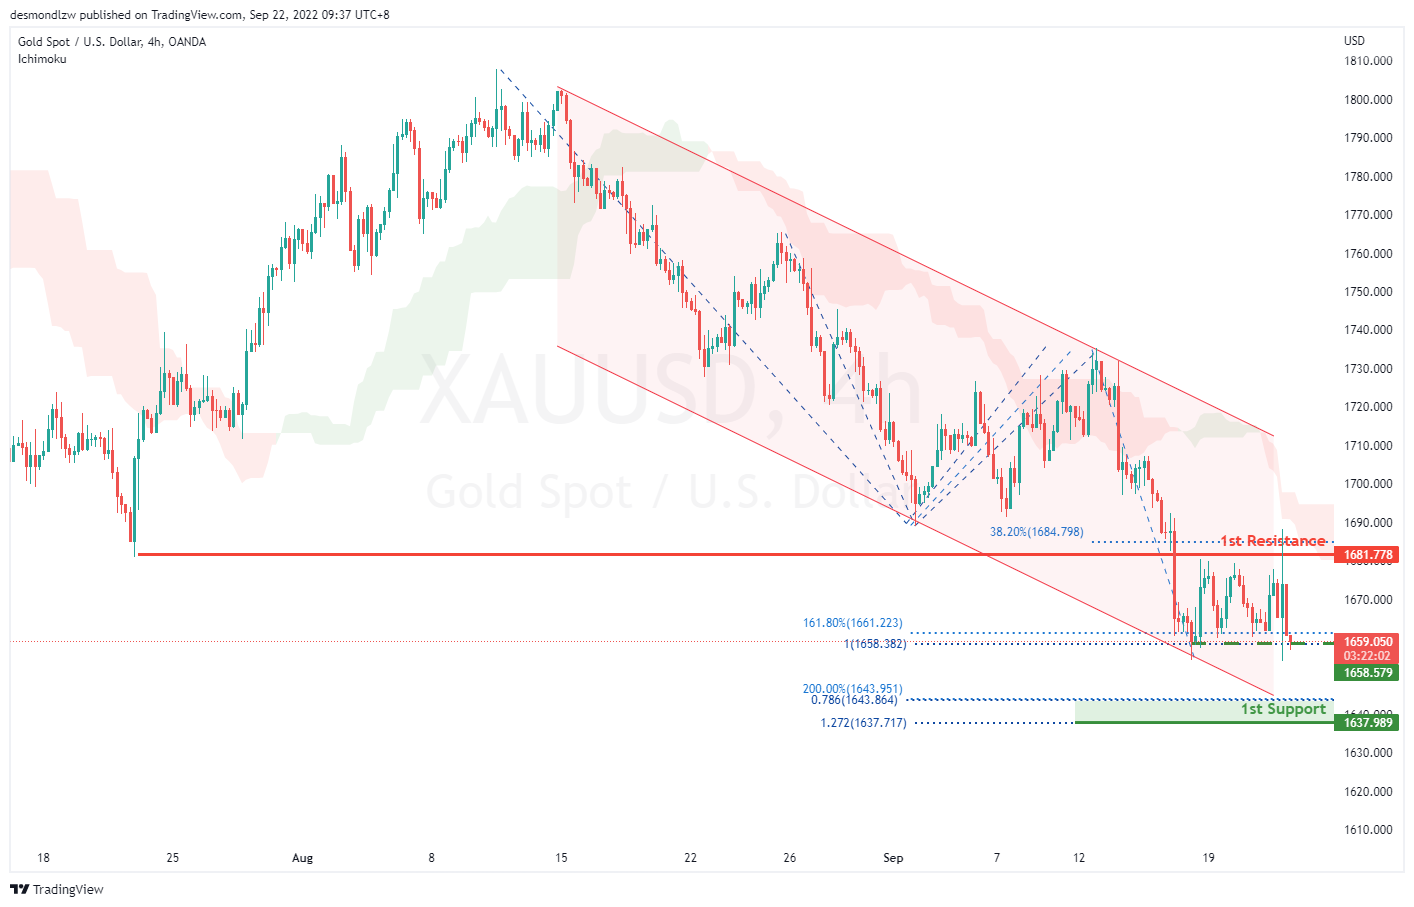
XAU/USD (GOLD):
On the H4, with the price moving within the descending channel and below ichimoku cloud, if the price can break the previous support at 1658.579, which is in line with the 100% fibonacci projection and 161.8% fibonacci extension, we would have a bearish bias that the price may drop to the 1st support at 1637.989, which is in line with the 127.2% fibonacci extension, 200% fibonacci extension and 78.6% fibonacci projection. Alternatively, the price may test the 1st resistance at 1681.778, which is in line with the overlap resistance and 38.2% fibonacci retracement.
Areas of consideration:
- H4 time frame, curren price
- H4 time frame, 1st support at 1637.989
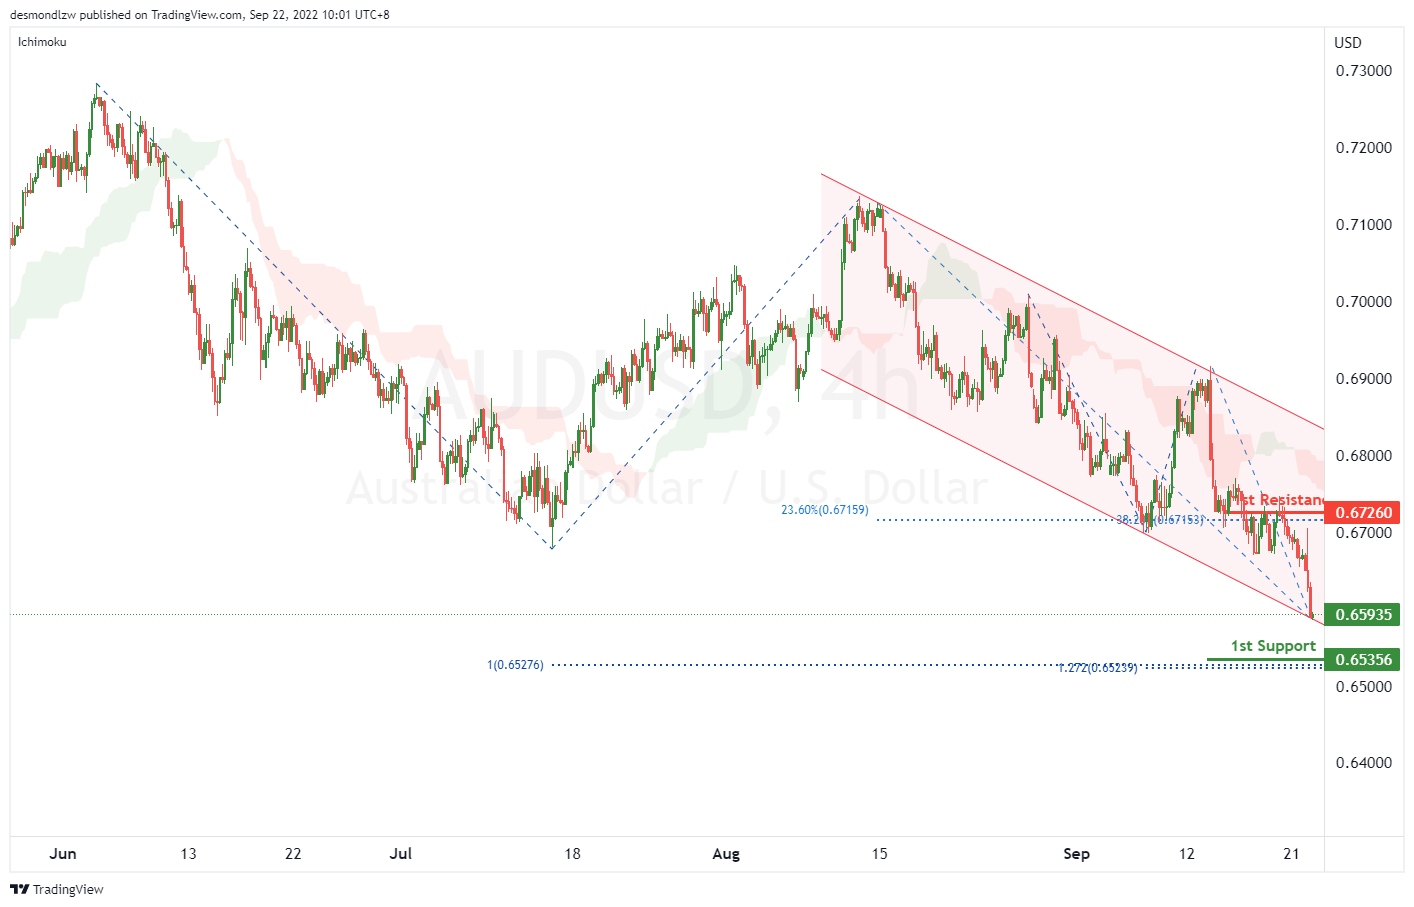
AUD/USD:
On the H4, with the price moving within the descending channel and below ichimoku cloud, if the price can break the descending channel successfully, we could have a bearish bias that the price may drop to the 1st support at 0.65356, which is in line with the 127.2% fibonacci extension and 100% fibonacci projections. Alternatively, the price may bounce off from the lower bond of the descending channel and rise to the 1st resistance at 0.67260, where the 23.6% fibonacci retracement and 38.2% fibonacci retracement are.
Areas of consideration
- H4, current price
- H4, 1st support at 0.65356
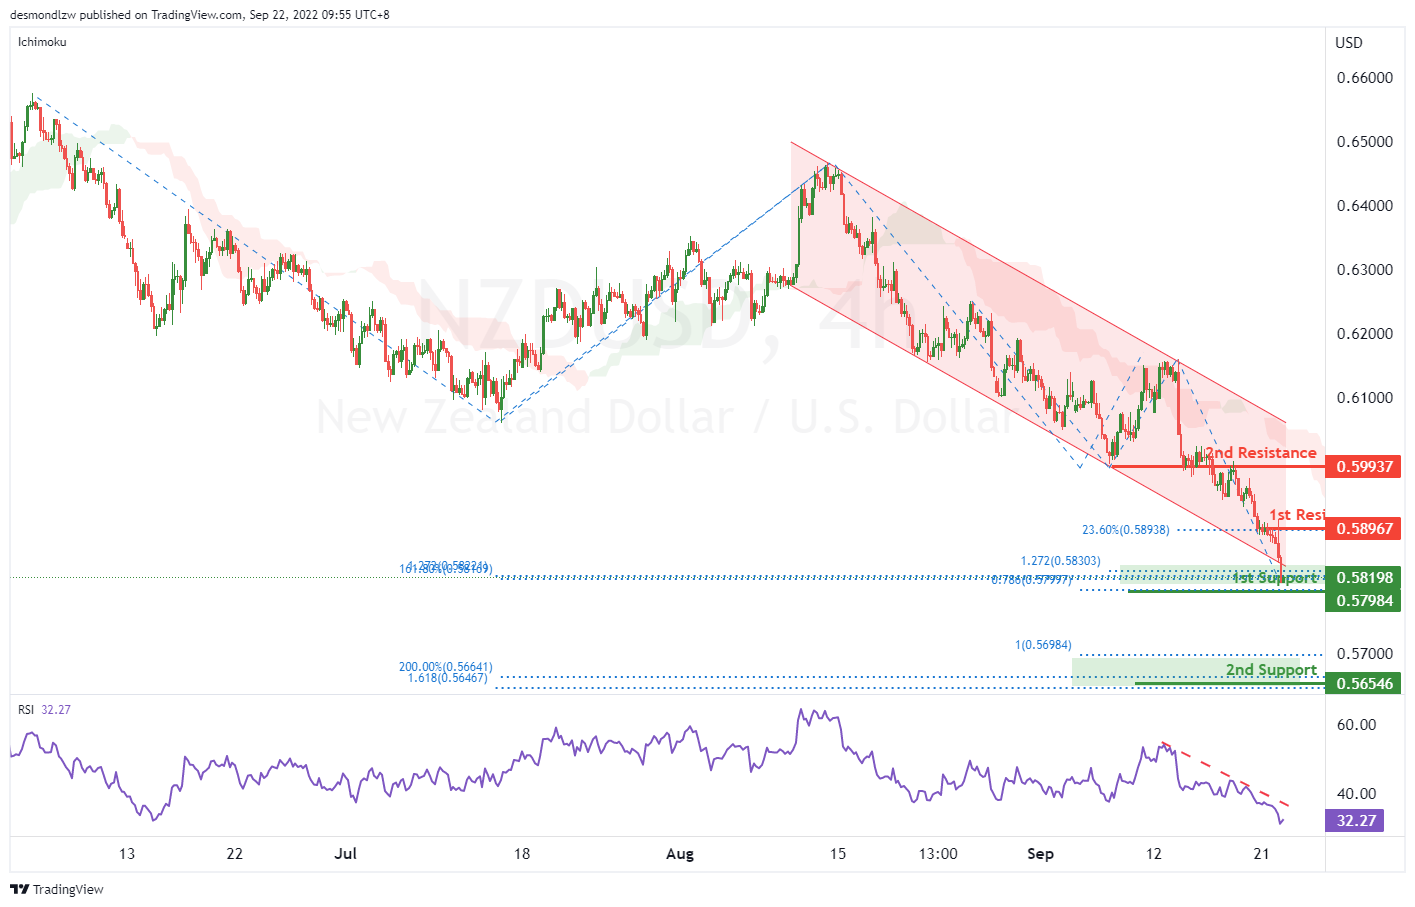
NZD/USD:
On the H4, with the price moving within the descending channel, below ichimoku cloud, RSI is showing a descending trendline. If the price can break the 1st support at 0.57984, which is in line with the 78.6% fibonacci projection, 161.8% fibonacci extension, 127.2% fibonacci extensions successfully, we can expect the price drop to the 2nd support at 0.56546, which is in line with the 200% fibonacci extension and 161.8% fibonacci extension. Alternatively, the price may pull back to the 1st resistance at 0.58967, where the 23.6% fibonacci retracement is, if the 1st resistance is broken, the 2nd resistance could be at 2nd resistance at 0.59937, which is in line with the overlap resistance.
Areas of consideration:
- H4 time frame, 1st support at 0.57984
- H4 time frame, 2nd support at 0.565646
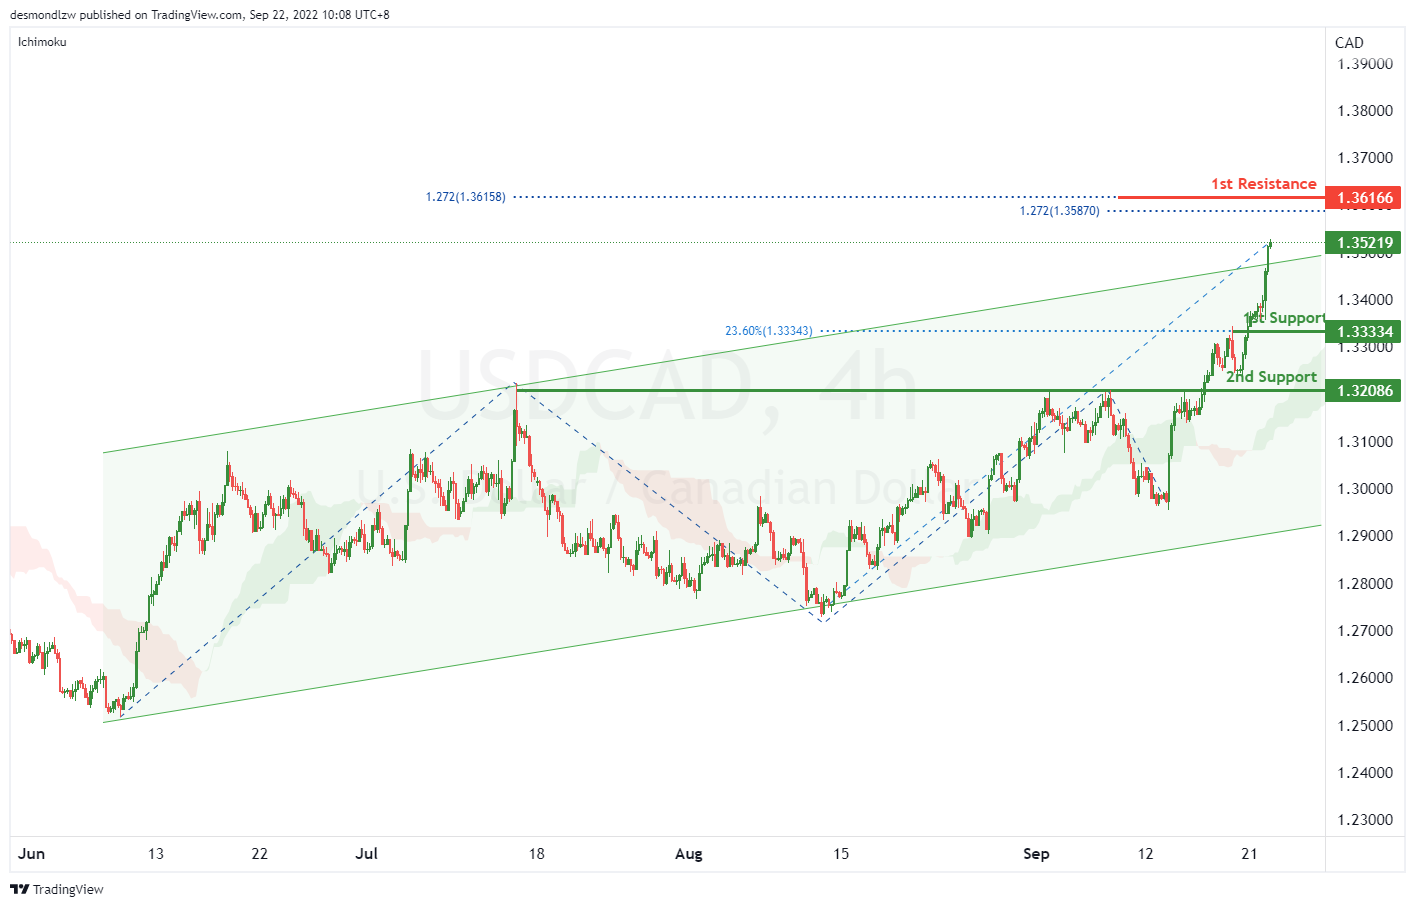
USD/CAD:
On the H4, with the price breaking the ascending channel and above ichimoku cloud, we have a bullish bias that the price may rise to the 1st resistance at 1.36166, where the 127.2% fibonacci extensions are. Alternatively, the price may pull back and drop to the 1st support at 1.33334, which is in line with the 23.6% fibonacci retracement. If the 1st support is broken, the 2nd support could be at 1.32086, which is in line with the overlap support.
Areas of consideration:
- H4 time frame, current price
- H4 time frame, 1st resistance at 1.36166
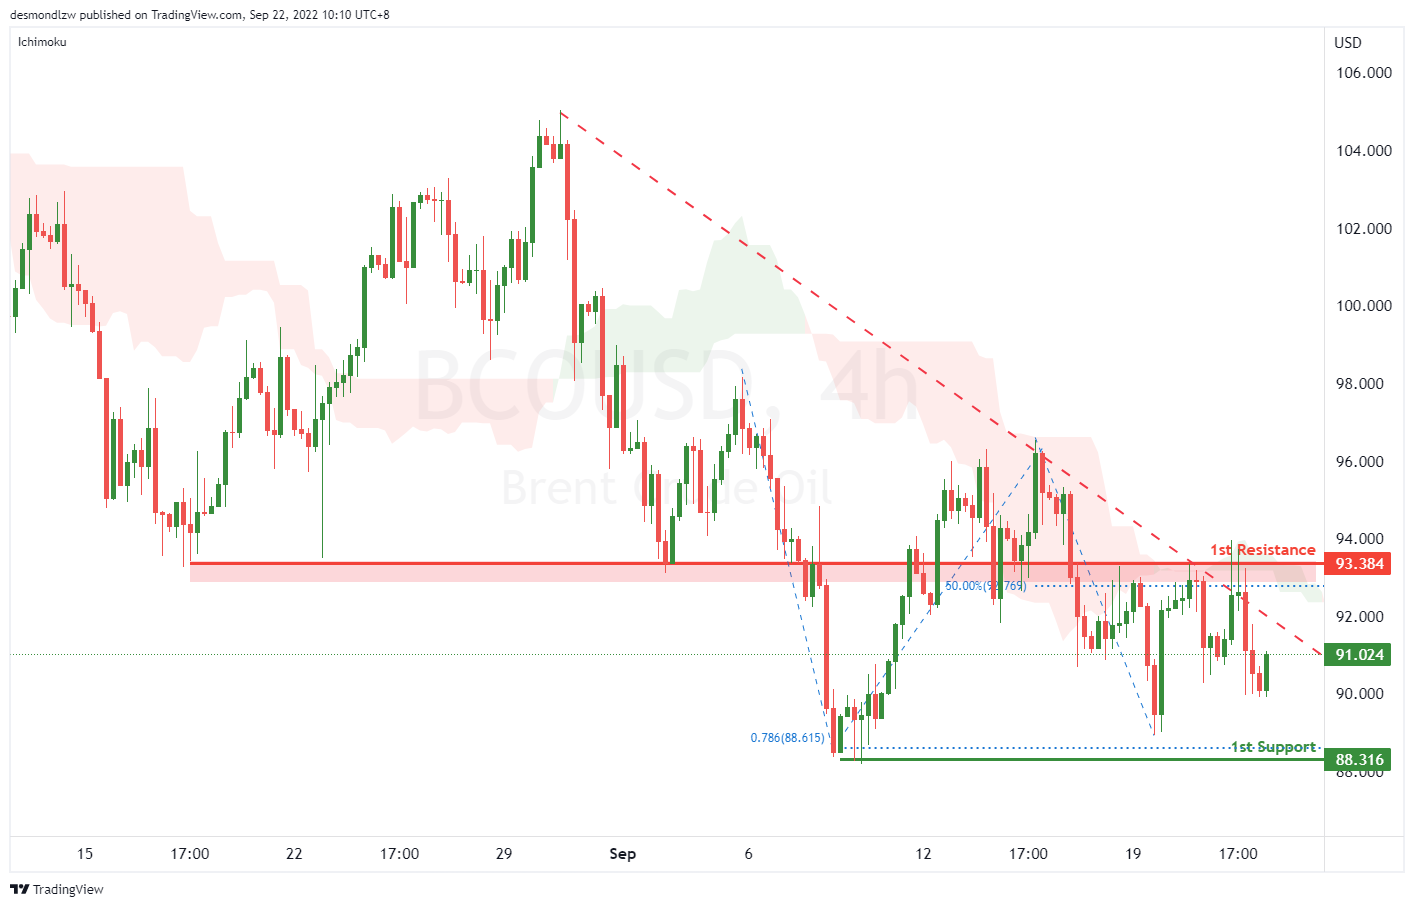
OIL:
On the H4, with the price moving within the descending trendline and below ichimoku cloud, we have a bearish bias that the price may drop to the 1st support at 88.316, where the 78.6% fibonacci projection and swing low are. Alternatively, the price may pull back and rise to test the 1st resistance at 93.384, which is in line with the 50% fibonacci retracement and overlap resistance
Areas of consideration:
- H4 time frame, 1st resistance at 93.384
- H4 time frame, 1st support at 88.316
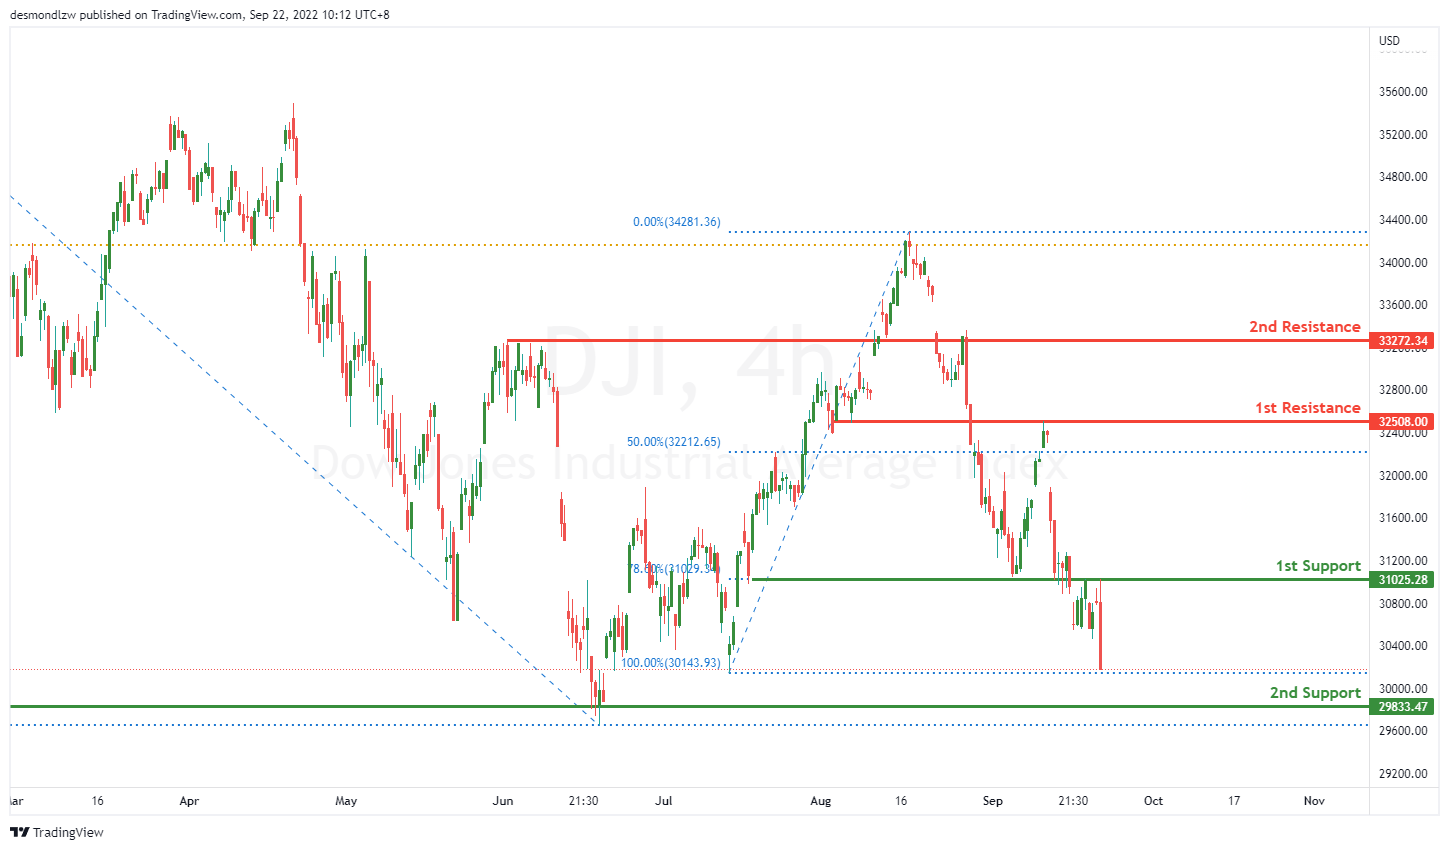
Dow Jones Industrial Average:
On the H4, price is reflected off nicely at the first resistance at 32500.85 where the 50% Fibonacci retracement is and broke right through the first support at 31029.34 where the 78.6% Fibonacci retracement is. Price might continue heading downwards towards the second support at 29833.47 where the previous swing low is.
Areas of consideration:
- H4 time frame, 1st support at 31029.34
- H4 time frame, 2nd support at 29833.47
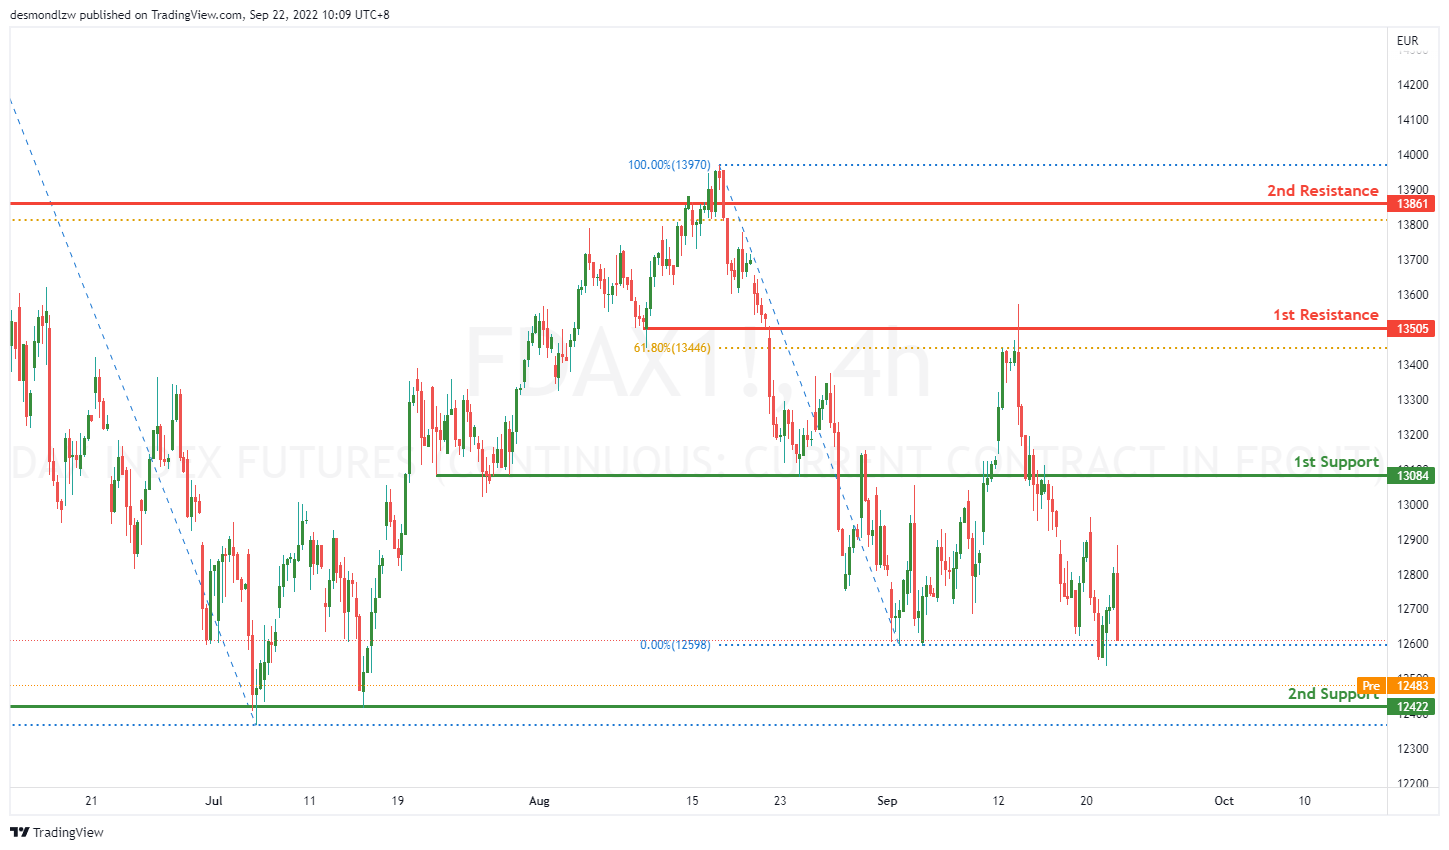
DAX:
On the H4, price has reflected of the first resistance at 13505 where the 61.8% retracement is and got a big reaction breaking through the first support at 13084. Price might continue going down towards the second support at 12422 where the swing low is.
Areas of consideration:
- H4 time frame, 1st support at 13084
- H4 time frame, 2nd support at 12422
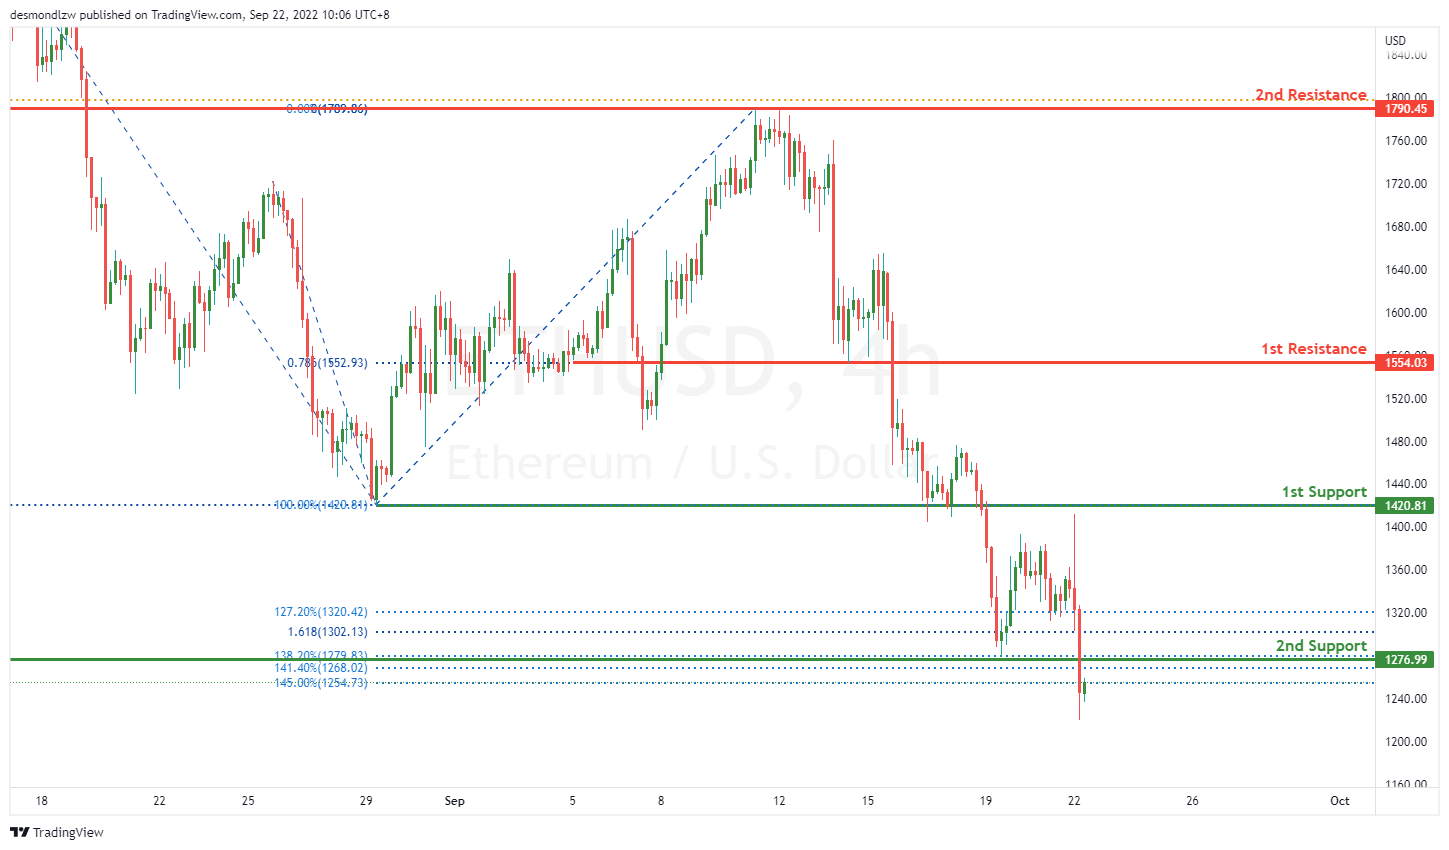
ETHUSD:
On the H4, price has pushed through the 1st Support at 1554.03 where the previous swing low sat. Price has also pushed through the second support at 1276.99 where the 138.2% Fibonacci extension lies. Price could possible head back up to the second support for retracement and then head lower.
Areas of consideration:
- H4 time frame, 1st resistance of 1554.03
- H4 time frame, 1st support at 1420.81
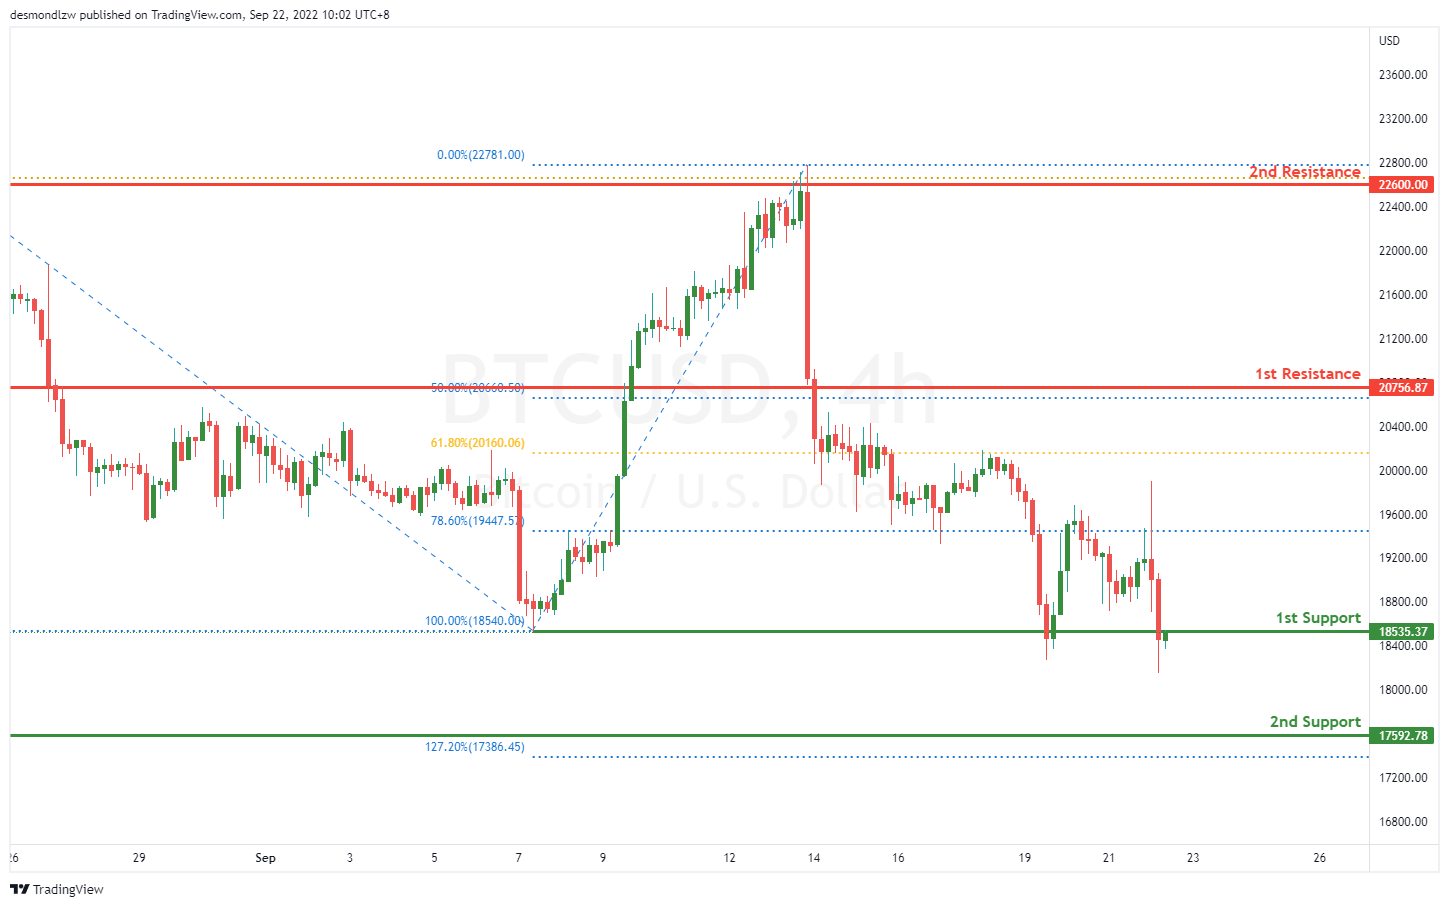
BTCUSD:
On the H4, price has broke through the first support 18535.37 where the previous swing low sits and reflected back up to 19557.00 where the 78.6% Fibonacci retracement sits. Price then broke back down the first support and closed nicely below it. Price could possibly head down to the second support area where the 127.2% Fibonacci extension is.
Areas of consideration:
- H4 time frame, 1st resistance of 22600.00
- H4 time frame, 1st support at 18535.37
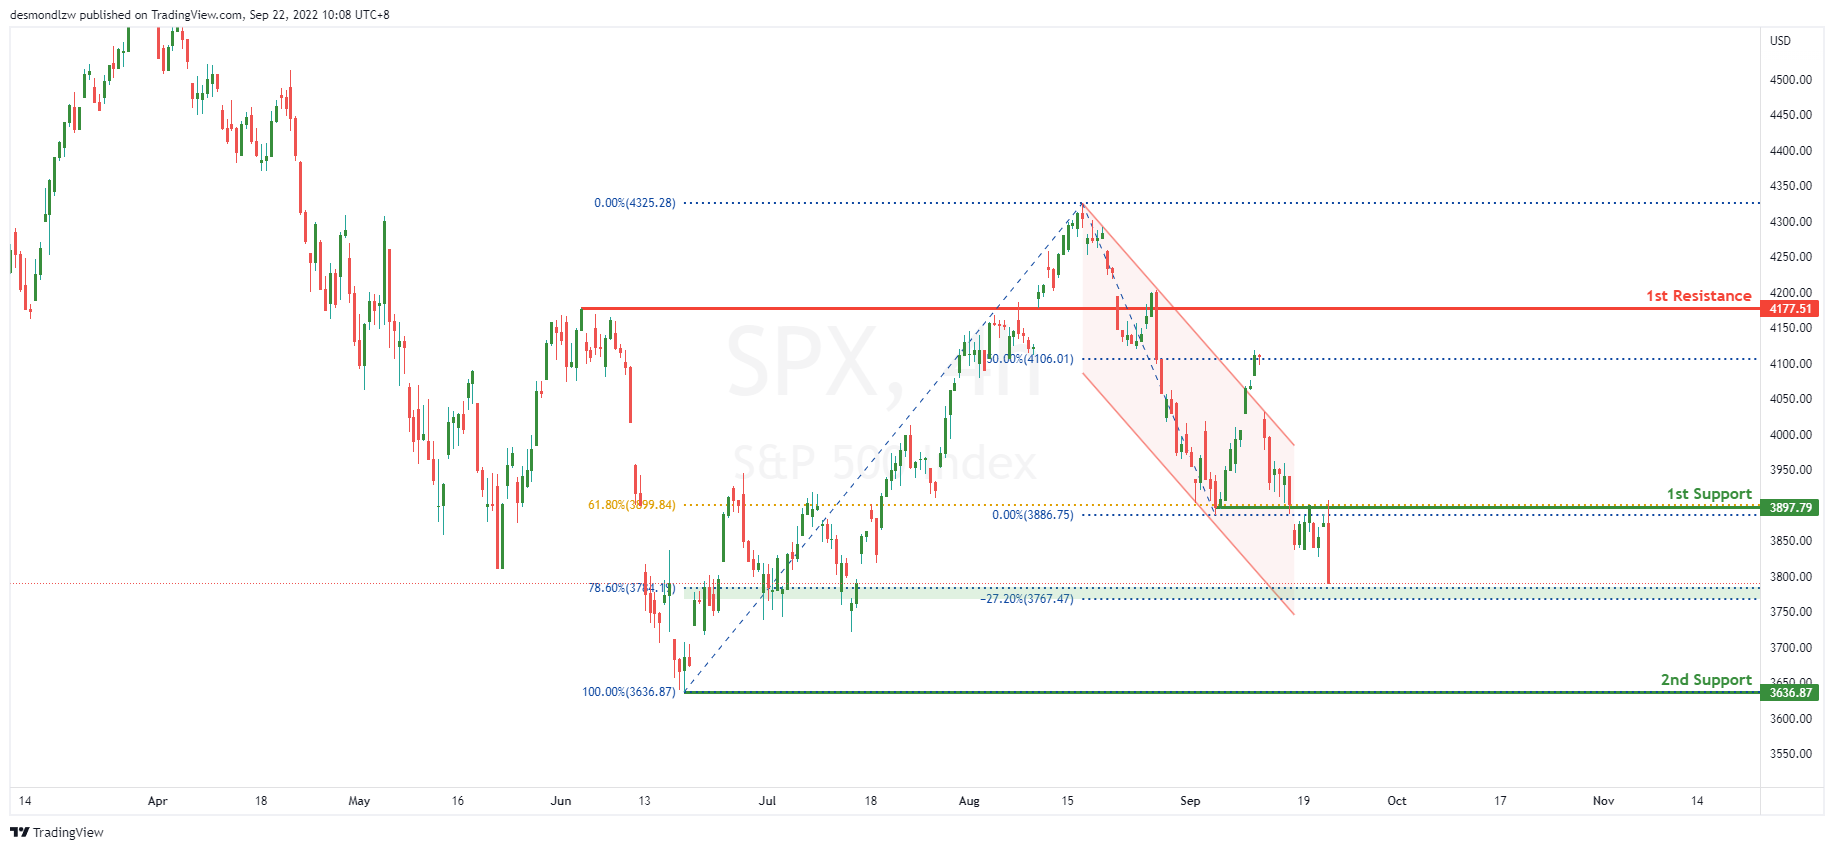
S&P 500:
On the H4, the price reversed from the 4100 price area forming a bearish channel, with the price falling towards the 1st support are of 3900. With our bearish bias still valid, as price trades back towards the 61.8% Fibonacci retracement, look for price to test the 1st support area. Price has broken below the 1st support level, the price could fall towards the 78.6% Fibonacci retracement level of 3784.19. As the price falls towards the 2nd support, it could find some pullback towards the 78.6% Fibonacci retracement pullback support area.
Areas of consideration:
- H4 time frame, 1st support at 3900
- H4 time frame, 2nd support at 3636.87


