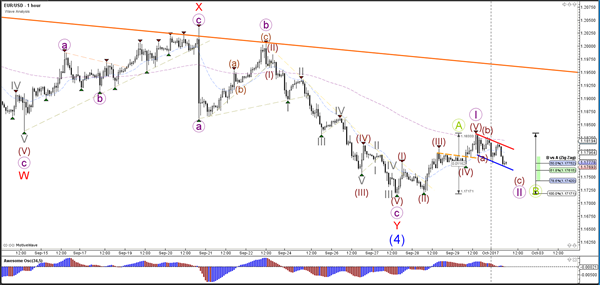
Currency pair EUR/USD
The EUR/USD bullish bounce at the 23.6% Fibonacci level could create a larger ABC (green) or a new uptrend (123 purple). These 2 scenarios are invalidated if price breaks below the 23.6% Fib. In that case, price will most likely make a bearish breakout towards the 38.2% Fibonacci level of wave 4 vs 3, which in turn could act as potential support.
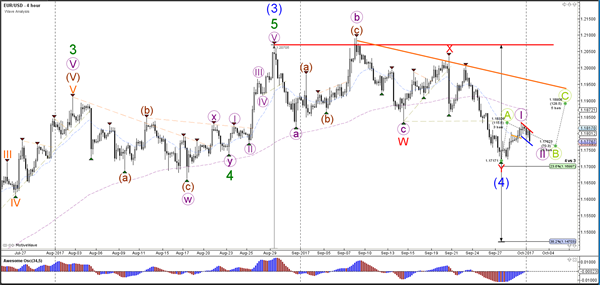
The EUR/USD channel, indicated by the red and blue trend lines, could be a corrective pattern as long as price stays above the 100% level of wave B vs A. A break above resistance (red) could start the wave 3 or wave C.
Currency pair GBP/USD
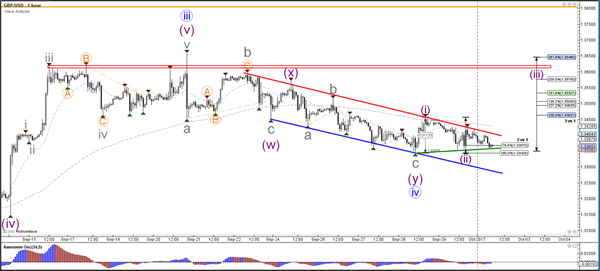
The GBP/USD bounce at the 38.2% Fibonacci level of wave 4 (blue) has so far been unable to break above the resistance trend line (red). A break below the 38.2% Fibonacci level could indicate a bearish breakout towards the 50% Fib of wave 4 vs 3 and the support trend line (blue).
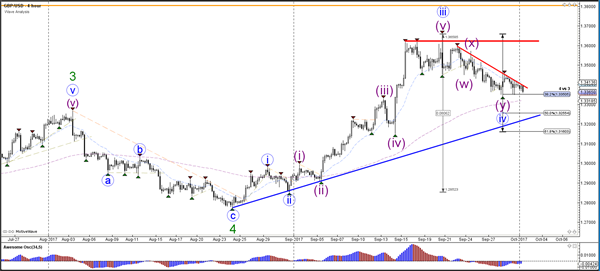
The GBP/USD is testing the support trend line (green) and 78.6% Fibonacci level of wave 2 vs 1. A break below support (green) could indicate a bearish breakout whereas a break above resistance (red) could indicate a bullish breakout.
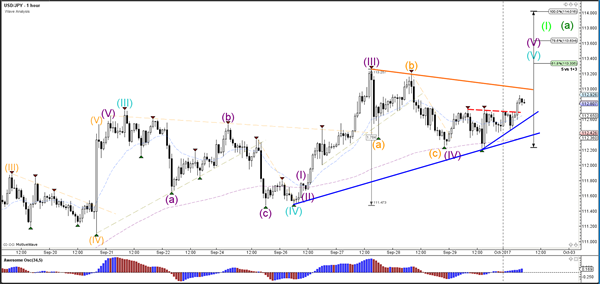
Currency pair USD/JPY
The USD/JPY bounced at the support trend line (blue), which could indicate the continuation within wave 5 (blue).
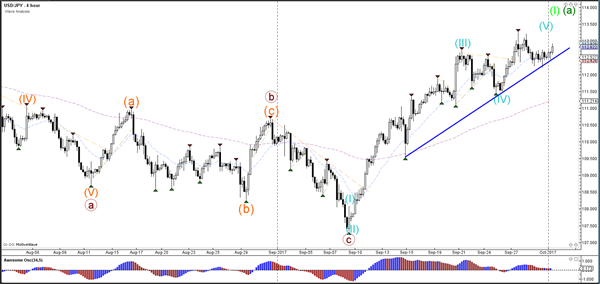
The USD/JPY could potentially have completed an ABC (orange) correction within wave 4 (purple) and price could be in a wave 5 as long as it stays above support (blue).