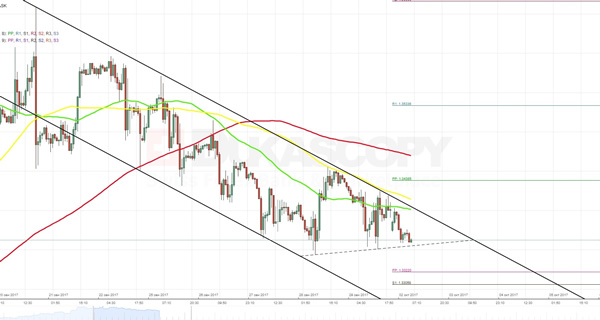
In accordance with expectations, a combination of the 55- and 100-hour SMAs as well as the former monthly R2 did not let the pair to make any notable advances on Friday. In fact, they continued to push it to the bottom, simultaneously forcing to form a minor symmetrical triangle. Due to release of a whole bunch of various fundamental data during this week, it is difficult to project how the pair is going to move. The only thing that can be said for sure is that the northern path is secured by numerous technical indicators, such as the 200-hour SMA and the 50% Fibonacci retracement level at 1.3503. In addition to that, the pair has recently made a rebound from the upper boundary of a long-term descending channel. Hence, the gradual slip to the bottom remains a more plausible scenario.