
USD/JPY:
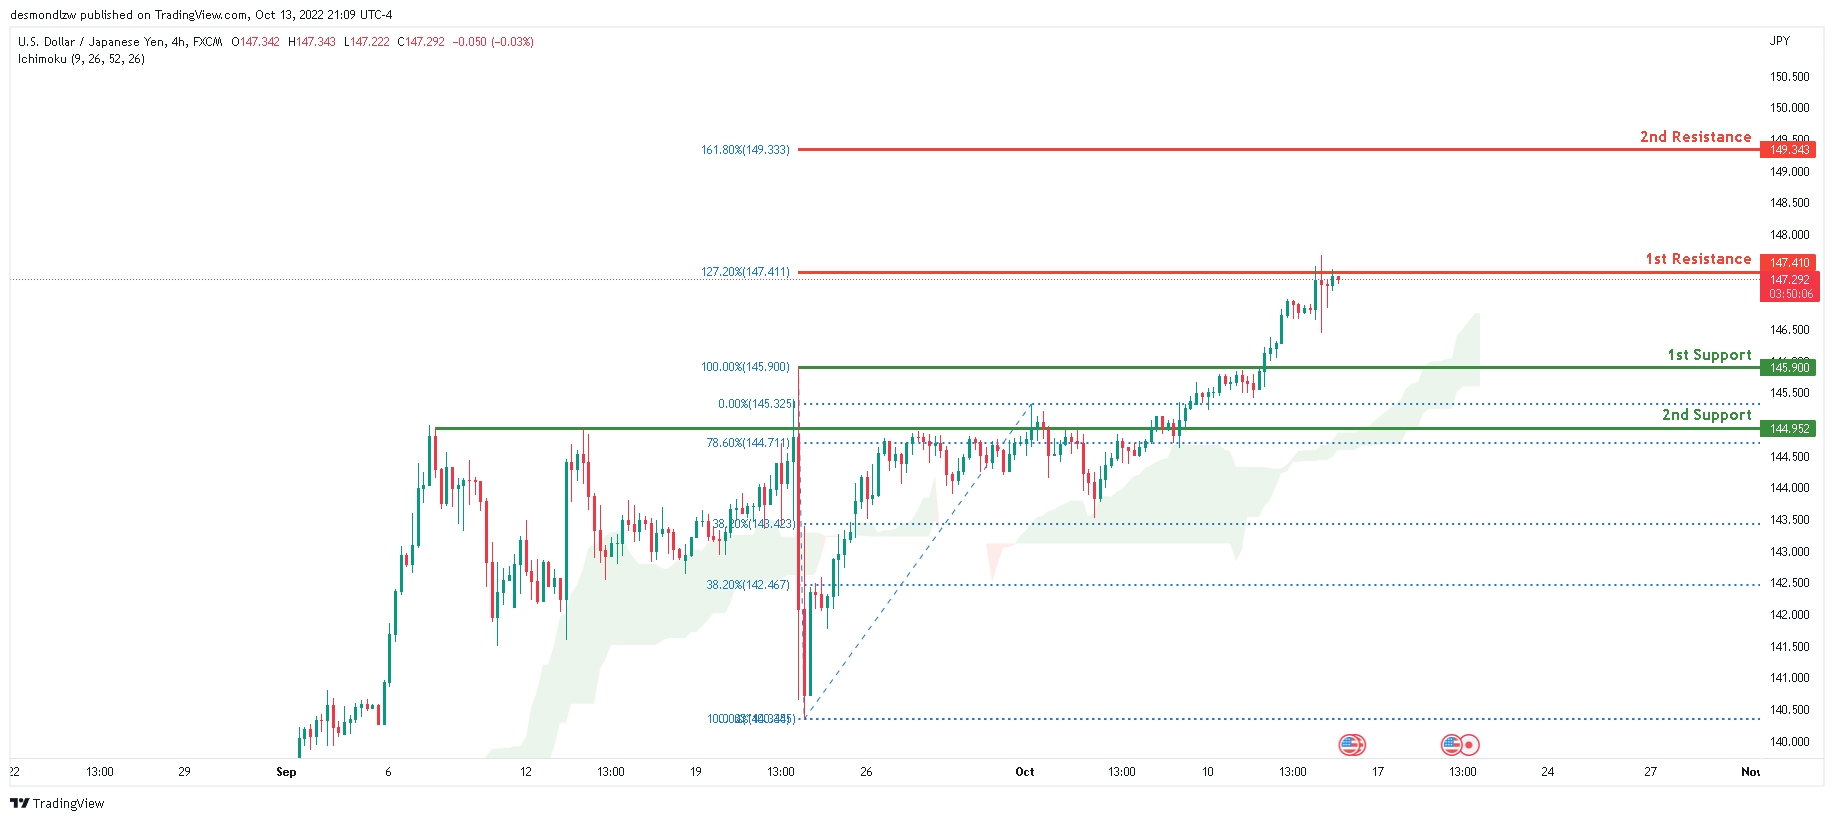
The current general bias for USDJPY on the H4 chart is bullish. To add to this bias, the price is currently trading above the Ichimoku cloud, indicating a bullish market. Overnight, the price has maintained its strong bullish momentum and tapped onto the first resistance line at 147.410, which contains the 127.2% Fibonacci extension line. Price is currently consolidating there. If this strong bullish momentum continues, expect price to continue towards 149.313 level where the 161.8% Fibonacci extension is located.
Areas of consideration:
- H4 time frame, 1st resistance at 147.410
- H4 time frame, 2nd resistance at 149.313
- H4 time frame, 1st support at 145.90
DXY:
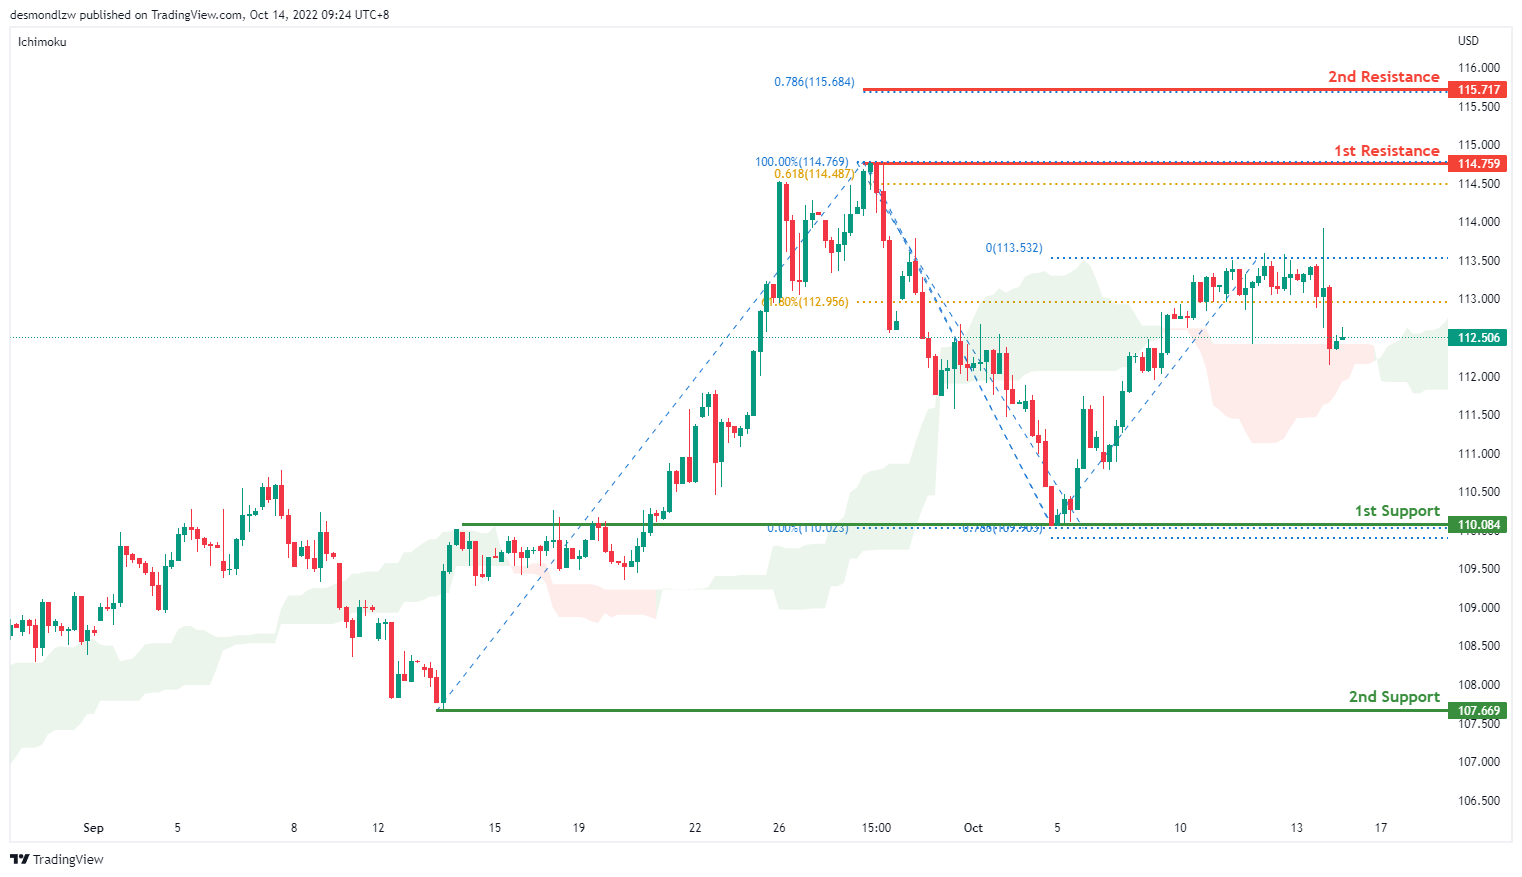
On the H4 chart, prices are moving in an ascending trend signalling an overall bullish momentum. Prices are moving towards the first support at 110.084 where the swing low sits. if it breaks this level, bearish momentum will bring price to second support at 107.669. Alternatively, price could move up to test the first resistance at 114.759 where the previous swing high sits. If bullish momentum continues it will bring price to 115.717 where the 78.6% projection.
Areas of consideration:
- H4 time frame, 1st resistance at 114.759
- H4 time frame, 1st support at 110.084
EUR/USD:
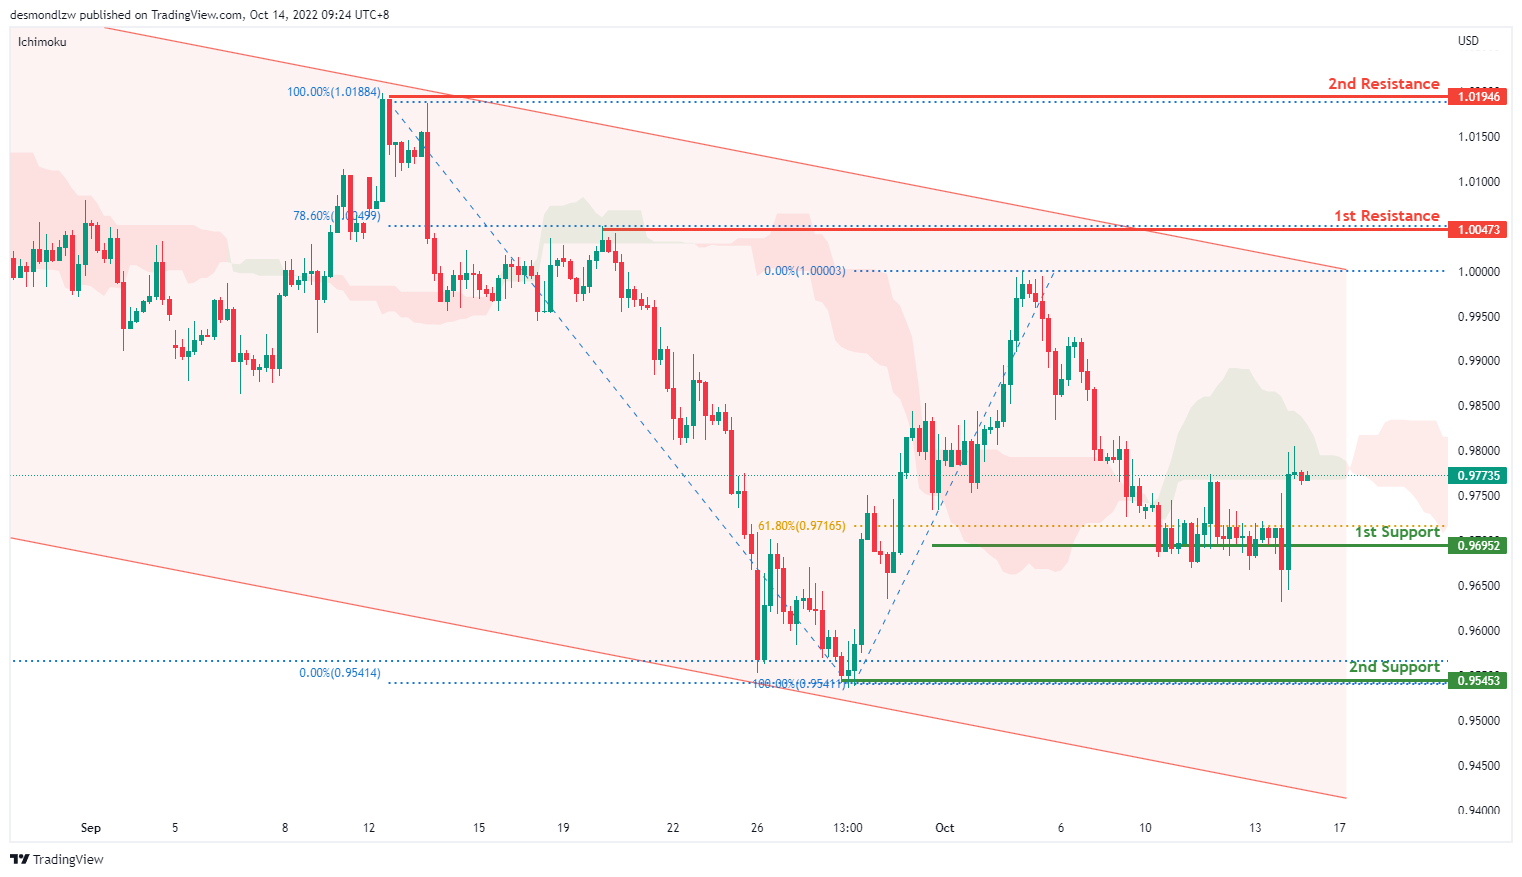
On the H4, price is moving within the descending trendline in a descending manner, with the price moving below ichimoku cloud- we are still overall bearish biassed. Although price has bounced off the first support at 0.9695 where the 61.8% retracement sits, it could still break this level and bring price to second support at 0.9545 where the swing low and 161.8% extension sit. Alternatively, price may test the first resistance at 1.0047 where the 78.6% retracement sits. If price breaks this level, it may test the second resistance at 1.0194, where the previous swing high sits
Areas of consideration :
- H4 1st resistance at 1.0047
- H4 2nd resistance at 1.0194
GBP/USD:
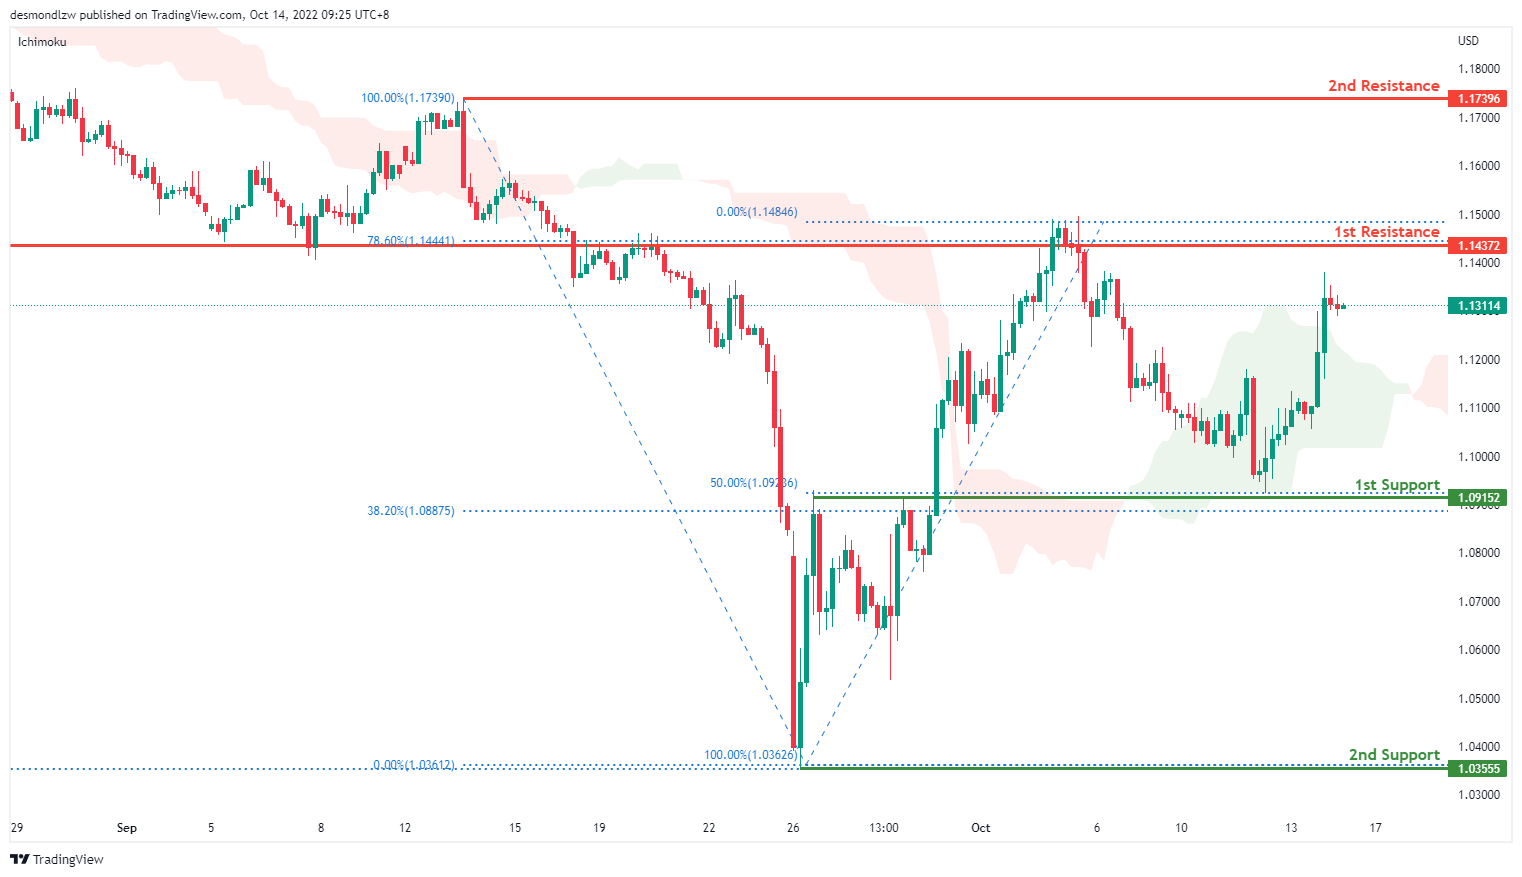
On the H4, price has rejected the first support and is moving in an ascending trend hence we are slightly bullish bias- if price breaks the first support at 1.0915 where the 50% retracement sits, bearish momentum will bring price to the second support at 1.0355 where the previous swing low sits. Alternatively price can test the first resistance at 1.1437 where the 78.6% retracement and overlap resistance sit. Subsequently the second resistance at 1.1739
Areas of consideration:
- H4 1st support at 1.0915
- H4 1st resistance at 1.1437
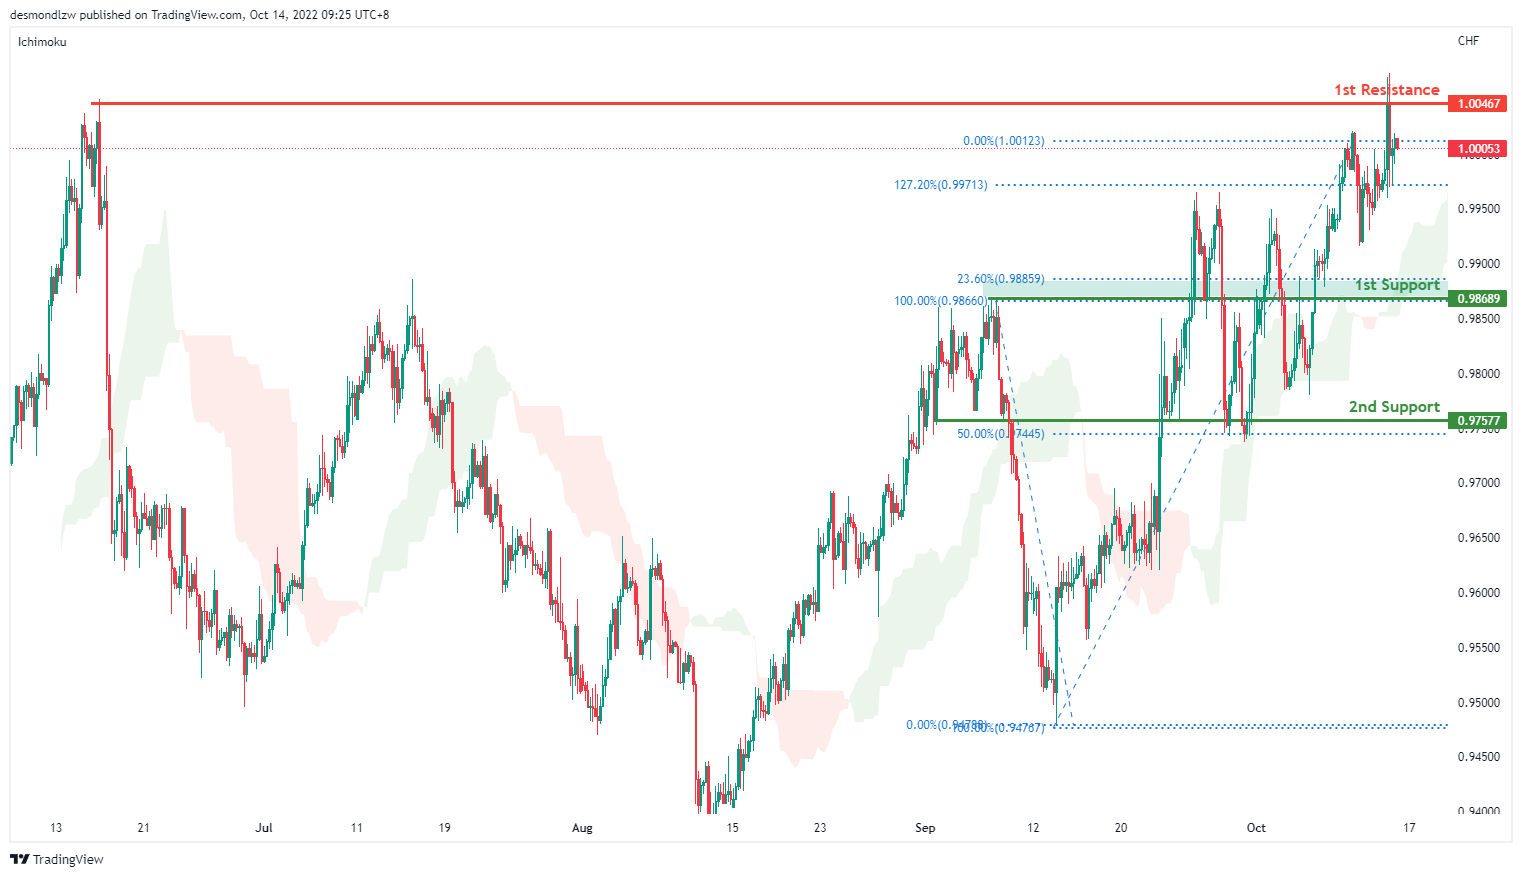
USD/CHF:
USDCHF is in a strong bullish trend on the H4 chart. Price is trading above the Ichimoku cloud signalling a bullish trend. Price has tested the first resistance at 1.0046 where the previous swing high sits and it’s pulling back slightly. If bearish momentum continues, price can test the first support at 0.9868 where the overlap support and 23.6% retracement sits then the second support at 0.9757 where the 50% retracement sits
Areas of consideration
- H4 1st support at 0.9868
- H4 1st resistance at 1.0046
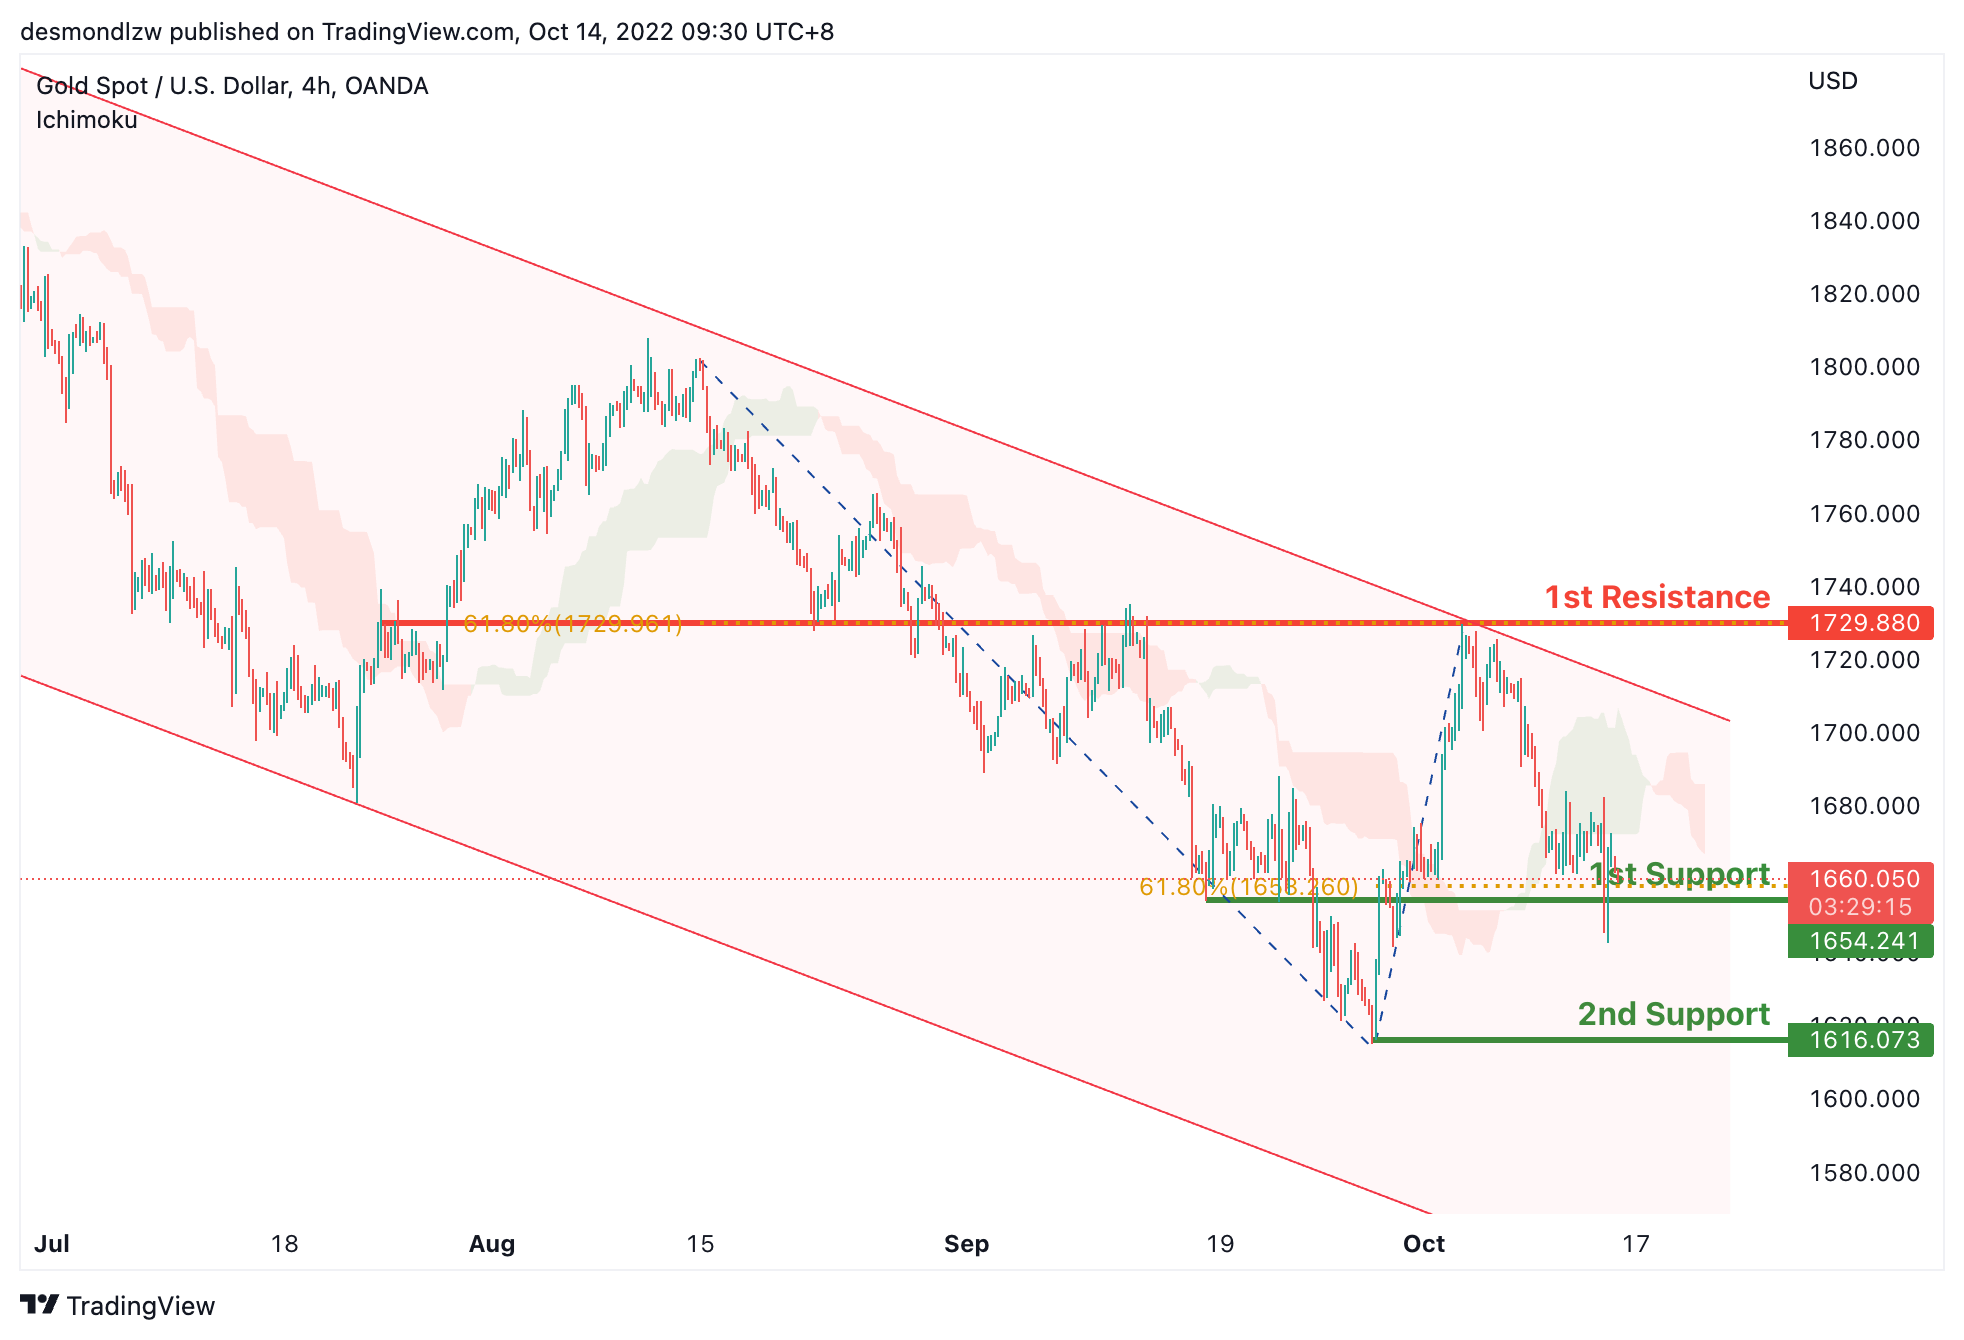
XAU/USD (GOLD):
On the H4, after the significant rise, the price is showing a pullback trend now, the 1st support is still held at 1660.410, which is in line with the 61.8% fibonacci retracement and overlap support. As the price is within the descending channel, we can expect the price to break 1st support and drop to the 2nd support at 1616.073, where the swing low is. Alternatively, the price may bounce off from the 1st support and rise to test the 1st resistance at 1729.880, where the 61.8% fibonacci retracement and previous swing highs are.
Areas of consideration:
- H4 time frame, 1st support at 1660.410
- H4 time frame, 2nd support at 1616.073
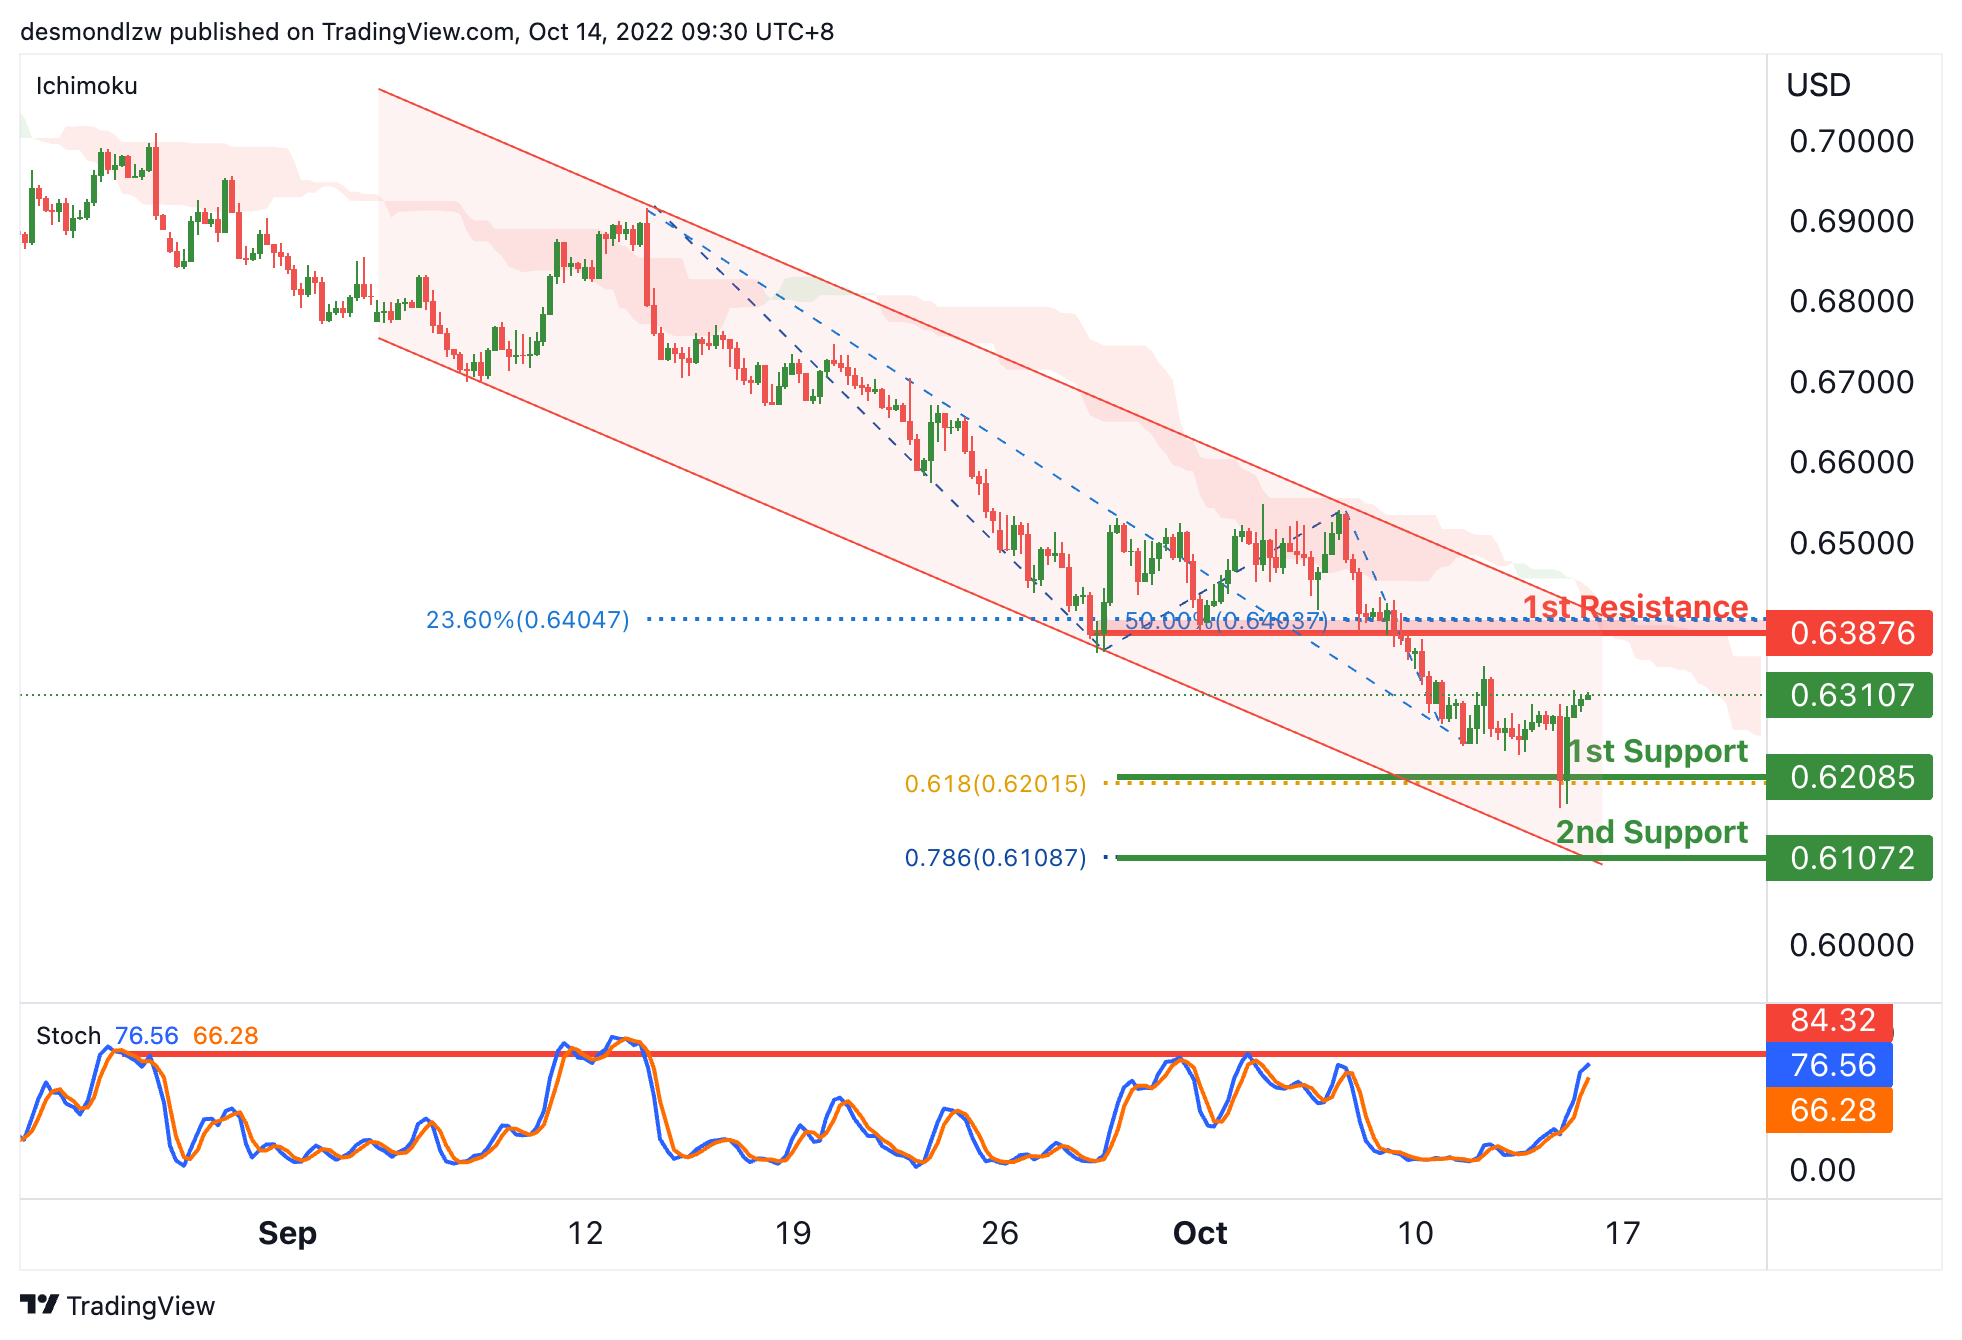
AUD/USD:
On the H4, the price is bouncing off from the 1st support, as the stoch is testing the 1st resistance,we are looking the price rise to test the 1st resistance at 0.63976. Alternatively, as the price is below the descending trendline and ichimoku cloud, the price may drop to the 1st support at 0.62085, which is in line with the 61.8% fibonacci projection. If the 1st support is broken, the 2nd support could be at 0.61072, where the 78.6% fibonacci projection is.
Areas of consideration
- H4, 1st support at 0.62085
- H4, 1st resistance at 0.63976
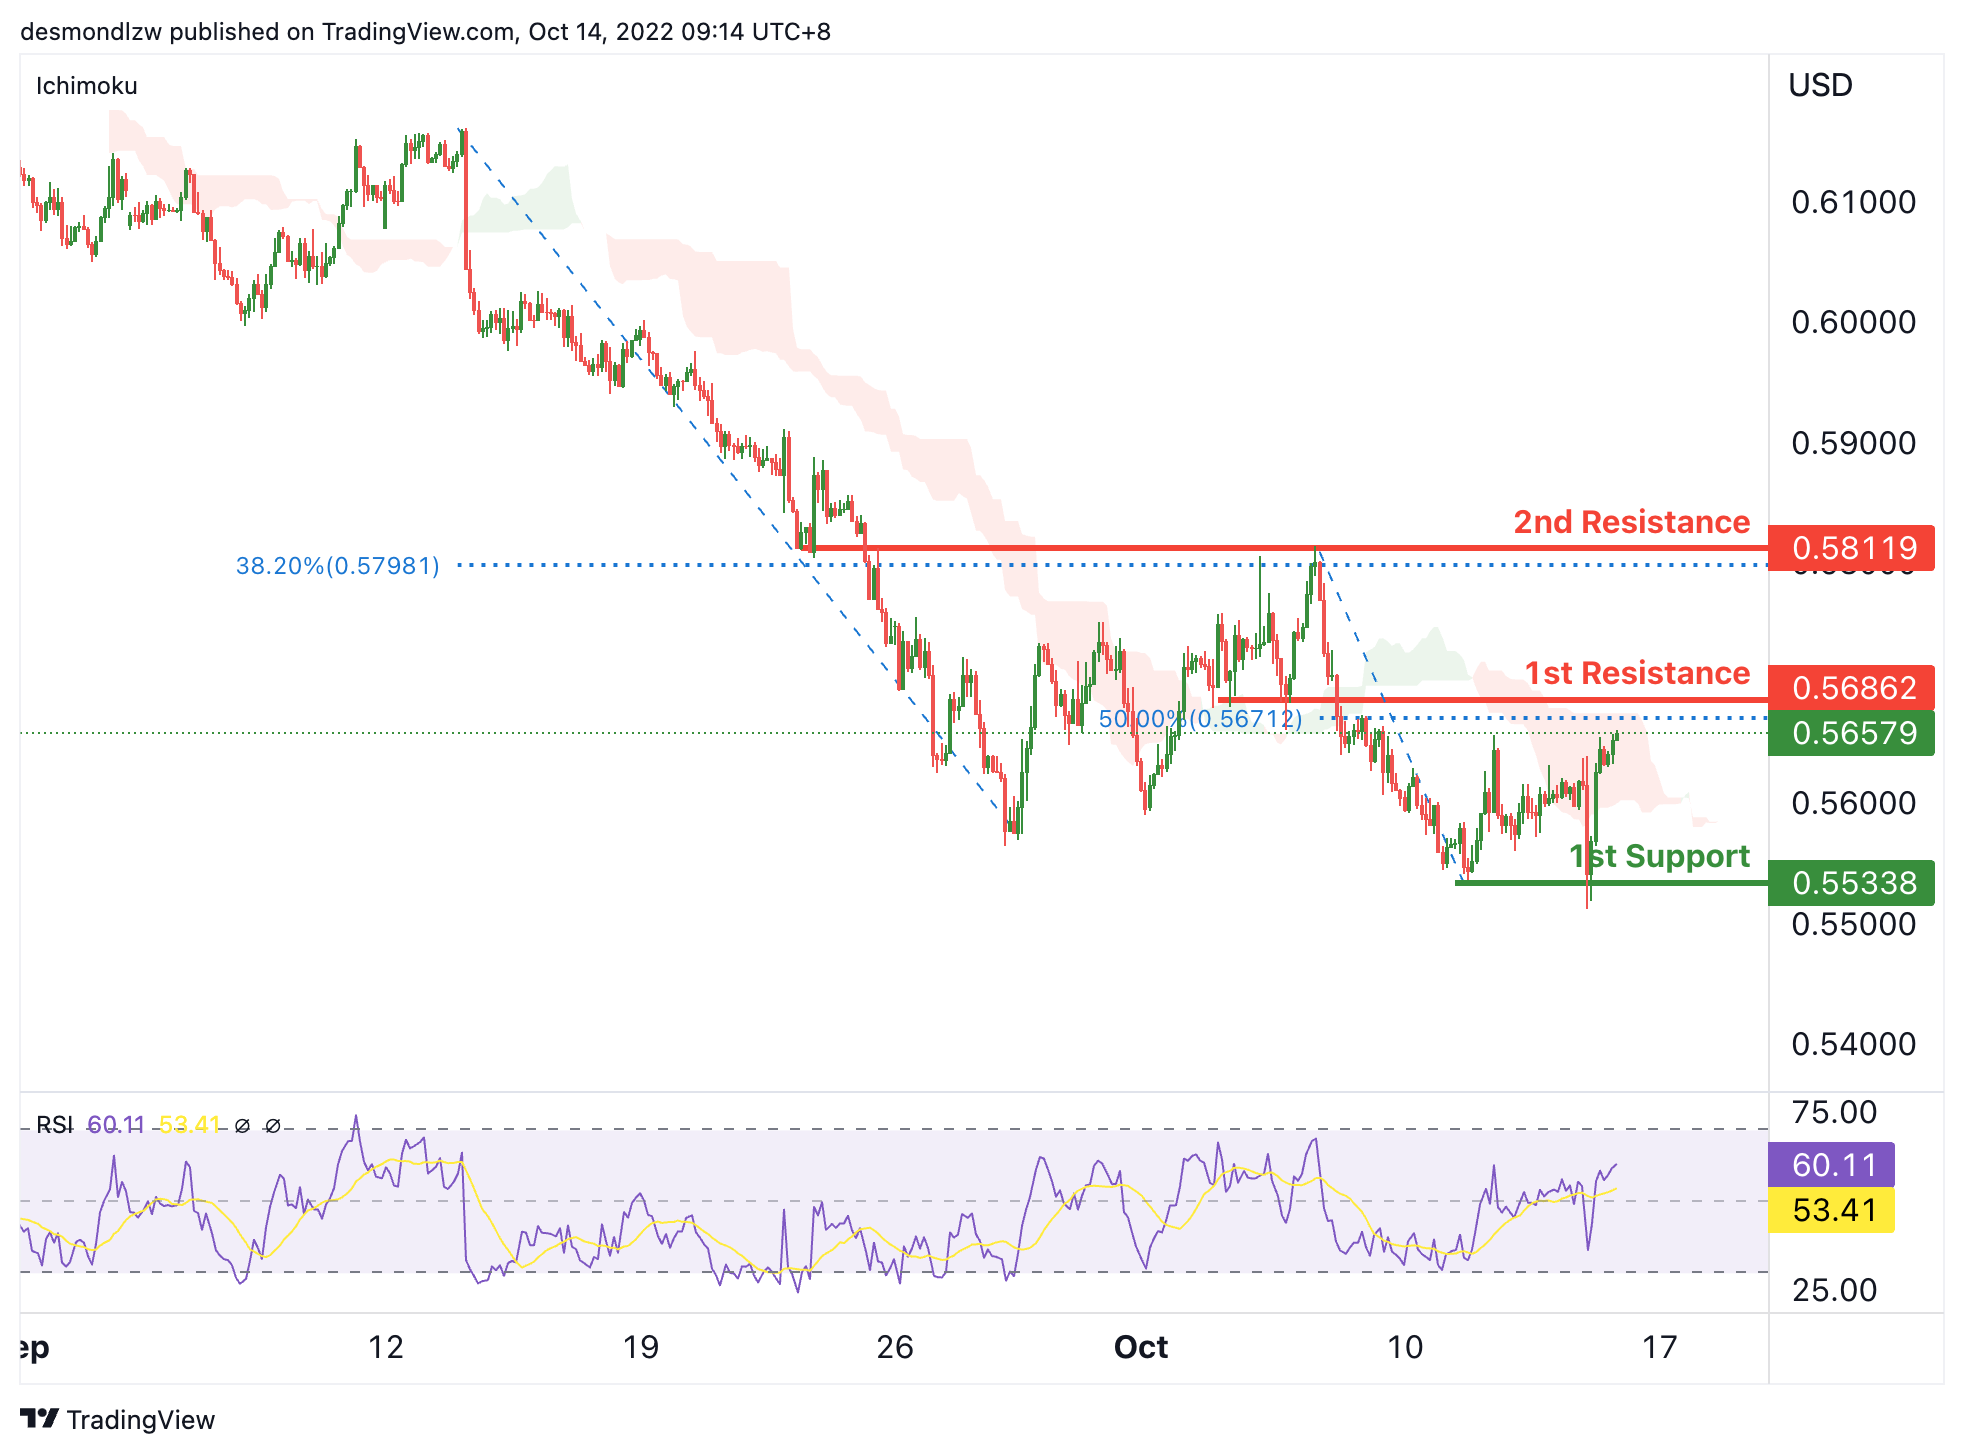
NZD/USD:
On the H4, the price is crossing the ichimoku cloud and RSI is rising over 50, we have a bullish bias that the price may rise to test the 1st resistance at 0.56862, where the 50% fibonacci retracement is. If the 1st resistance is broken, the 2nd resistance could be at 0.58119, which is in line with the 38.2% fibonacci retracement and overlap resistance. Alternatively, the price may drop to test the 1st support at 0.55338, which is in line with the swing low.
Areas of consideration:
- H4 time frame, 1st resistance at 0.56862
- H4 time frame, 2nd resistance at 0.58119
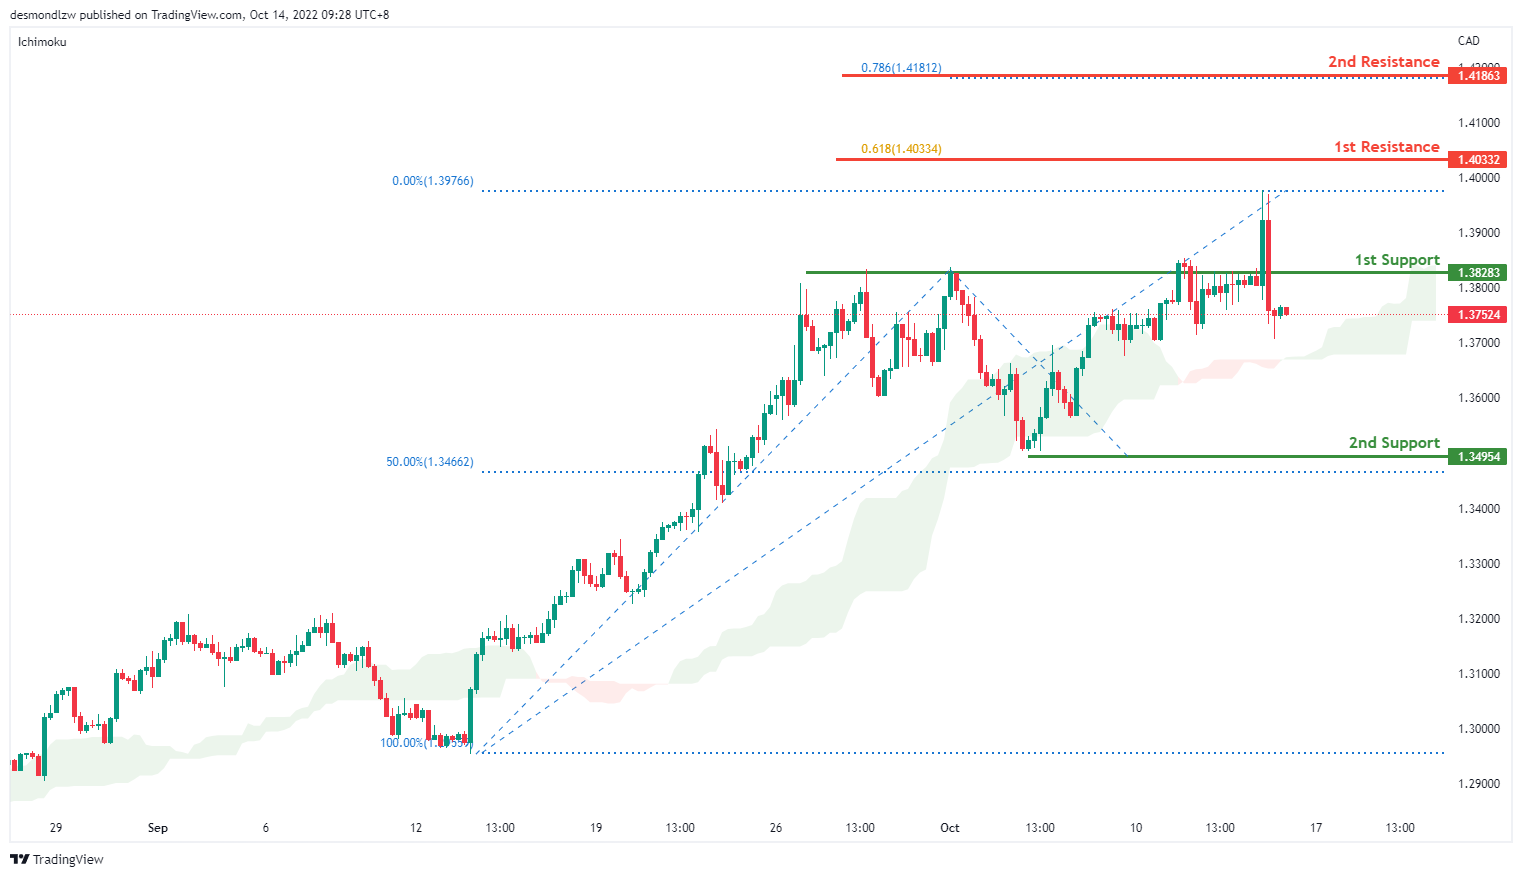
USD/CAD:
On the H4, the price trades higher near the 1st resistance of 1.4033 which is the previous swing high and 61.8% projection level. With the price trading above the ichimoku cloud, we have a short term bullish bias. The price could break the first resistance to test the second resistance at 1.4186 where the 78.6% projection sits. Alternatively it could fall to the 1st support at 1.3828 where the previous swing high sits subsequently the second support at 1.3495 where the 50% retracement sits
Areas of consideration:
- H4 time frame, 1st resistance at 1.4033
- H4 time frame, 1st support at 1.3828
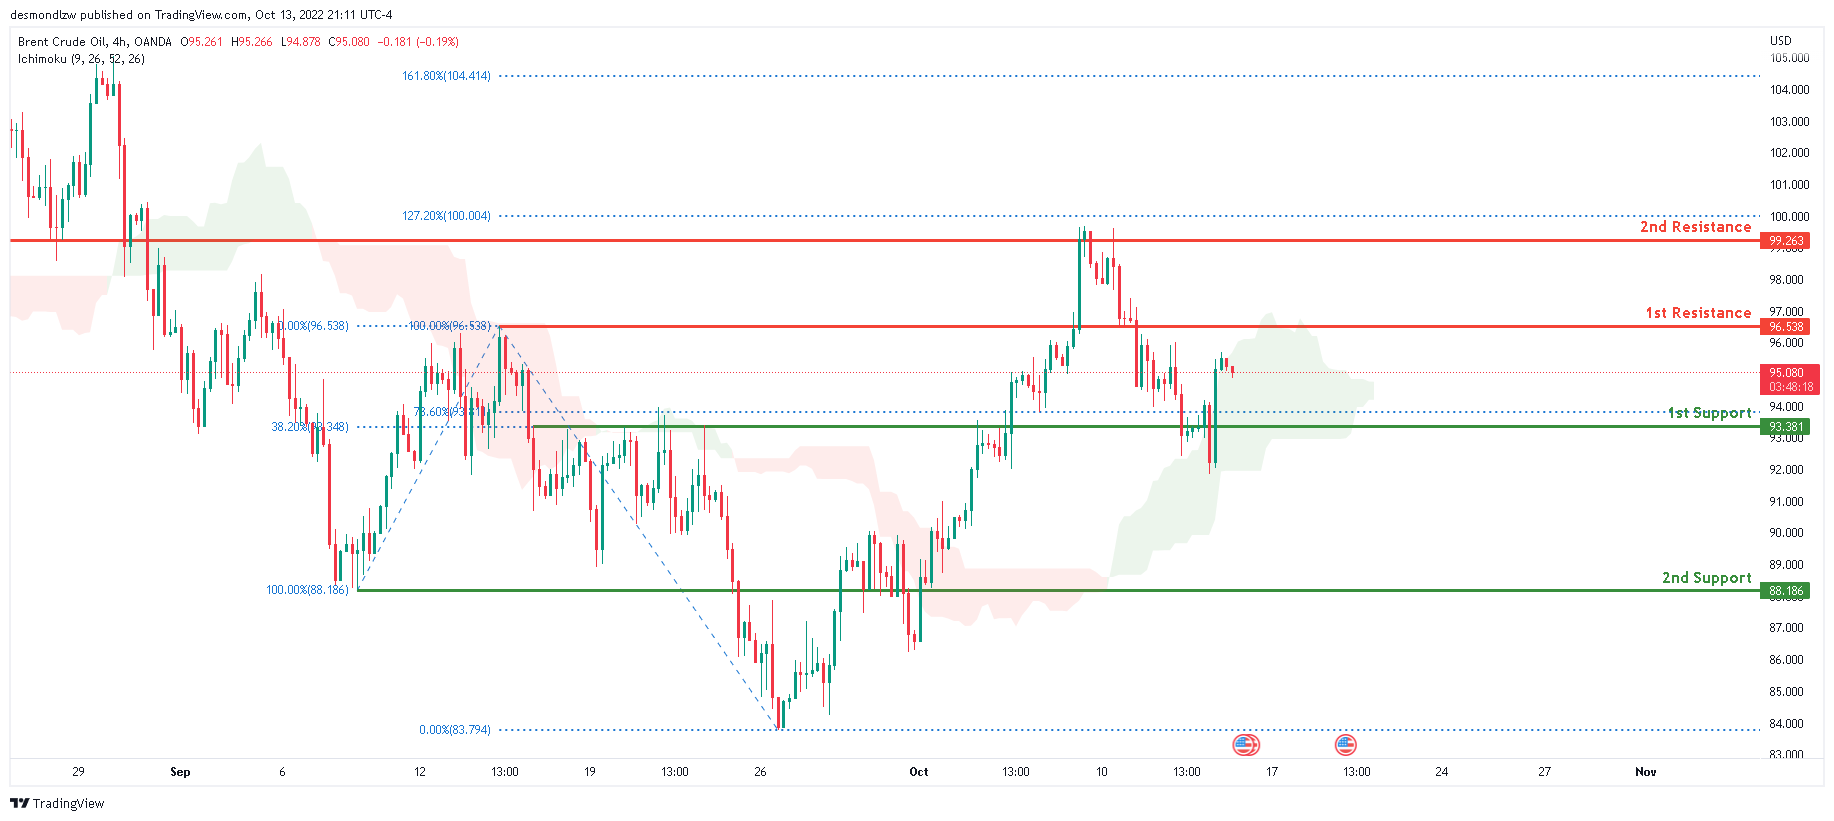
OIL:
Looking at the H4 chart, the current overall bias for Oil is bullish . To add confluence to this bias, the price is currently above the Ichimoku cloud which indicates a bullish market. Overnight, price broke through the 1st support line at 93.381 where the 78.6% Fibonaaci line and 38.2% Fibonaaci line was located before going back up above it. If this bullish momentum continues, expect the price to head towards the 1st resistance at 96.538 where the 100% Fibonacci line and 0% Fibonacci line are located for a retest.
Areas of consideration:
- H4 time frame, 1st resistance at 96.538
- H4 time frame, 1st support at 93.381
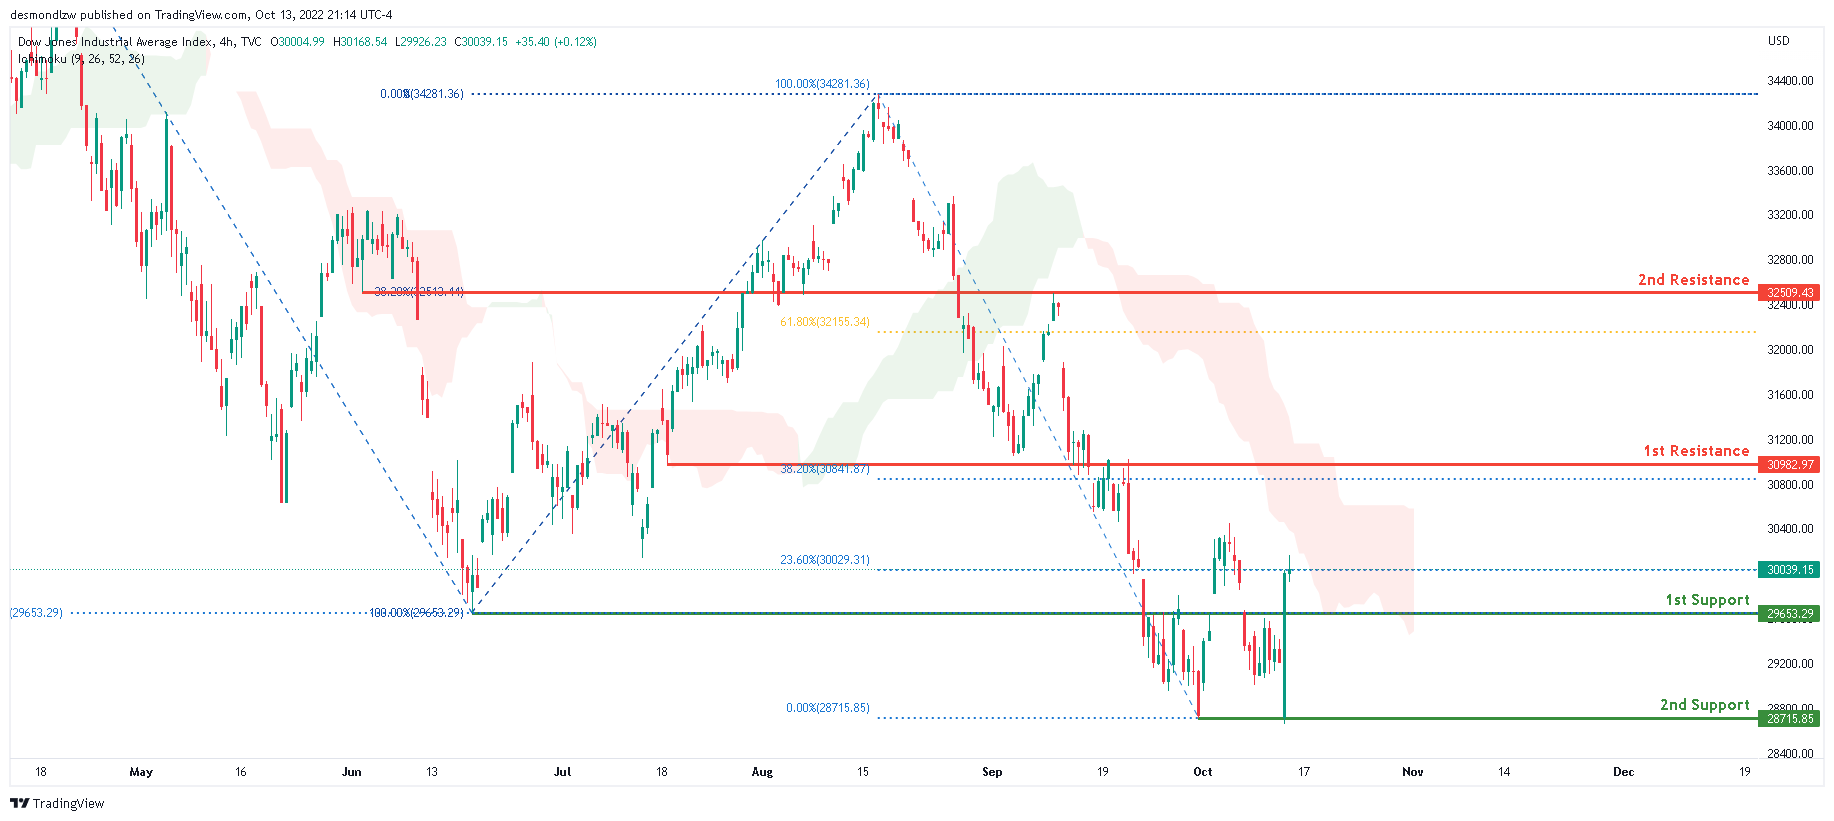
Dow Jones Industrial Average:
The current overall bias for DJI is bearish, according to the H4 chart. To add to this bias, the price is currently trading below the Ichimoku cloud, indicating a bearish market. Price had strong votality overnight due to the release of the US CPI data with price going down to test the 2nd support at 28715.85 where the previous low and 0% Fibonacci line is located. Price then closed above the 1st support at 29653.29 where the previous low and 100% Fibonacci line is located. If this short term bullish momentum continues, expect price to possibly head back up to test the 1st resistance at 30982.97 where the 38.2% Fibonacci line is located.
Areas of consideration:
- H4 time frame, 1st support at 29653.29
- H4 time frame, 2nd support at 28715.85
- H4 time frame, 1st Resistance at 30982.97
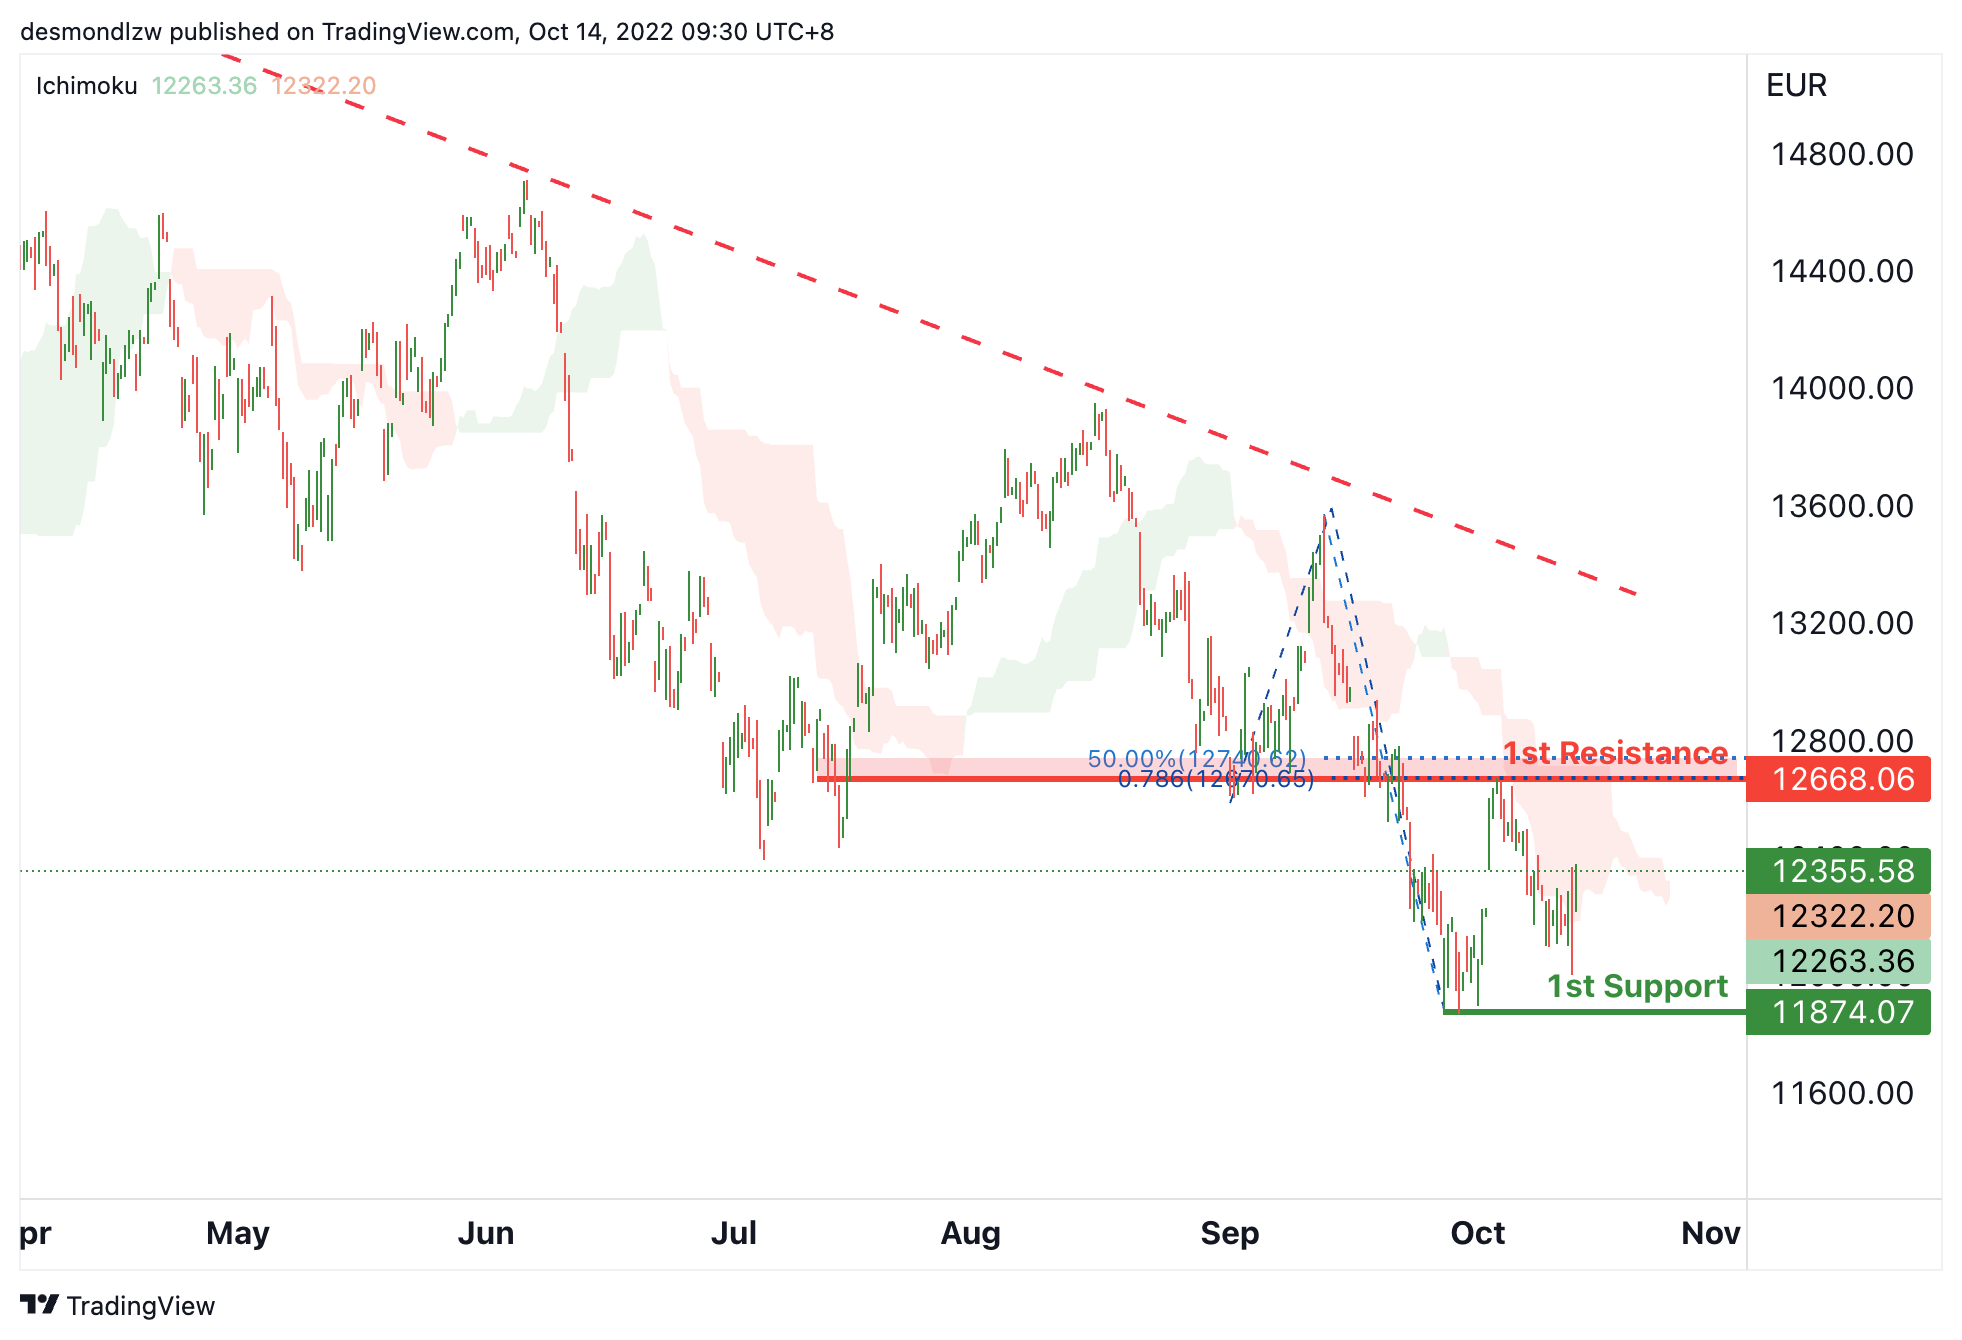
DAX:
On the H4, as the price is crossing ichimoku cloud, we can expect the price to test the 1st resistance at 12668.06, which is in line with the 50% fibonacci retracement, 78.6% fibonacci projection and overlap resistance. After testing the 1st resistance, as the price is below the descending trendline, the price may drop to the 1st support at 11874.07, which is in line with the swing low.
Areas of consideration:
- H4 time frame, current price
- H4 time frame, 1st resistance at 12668.06
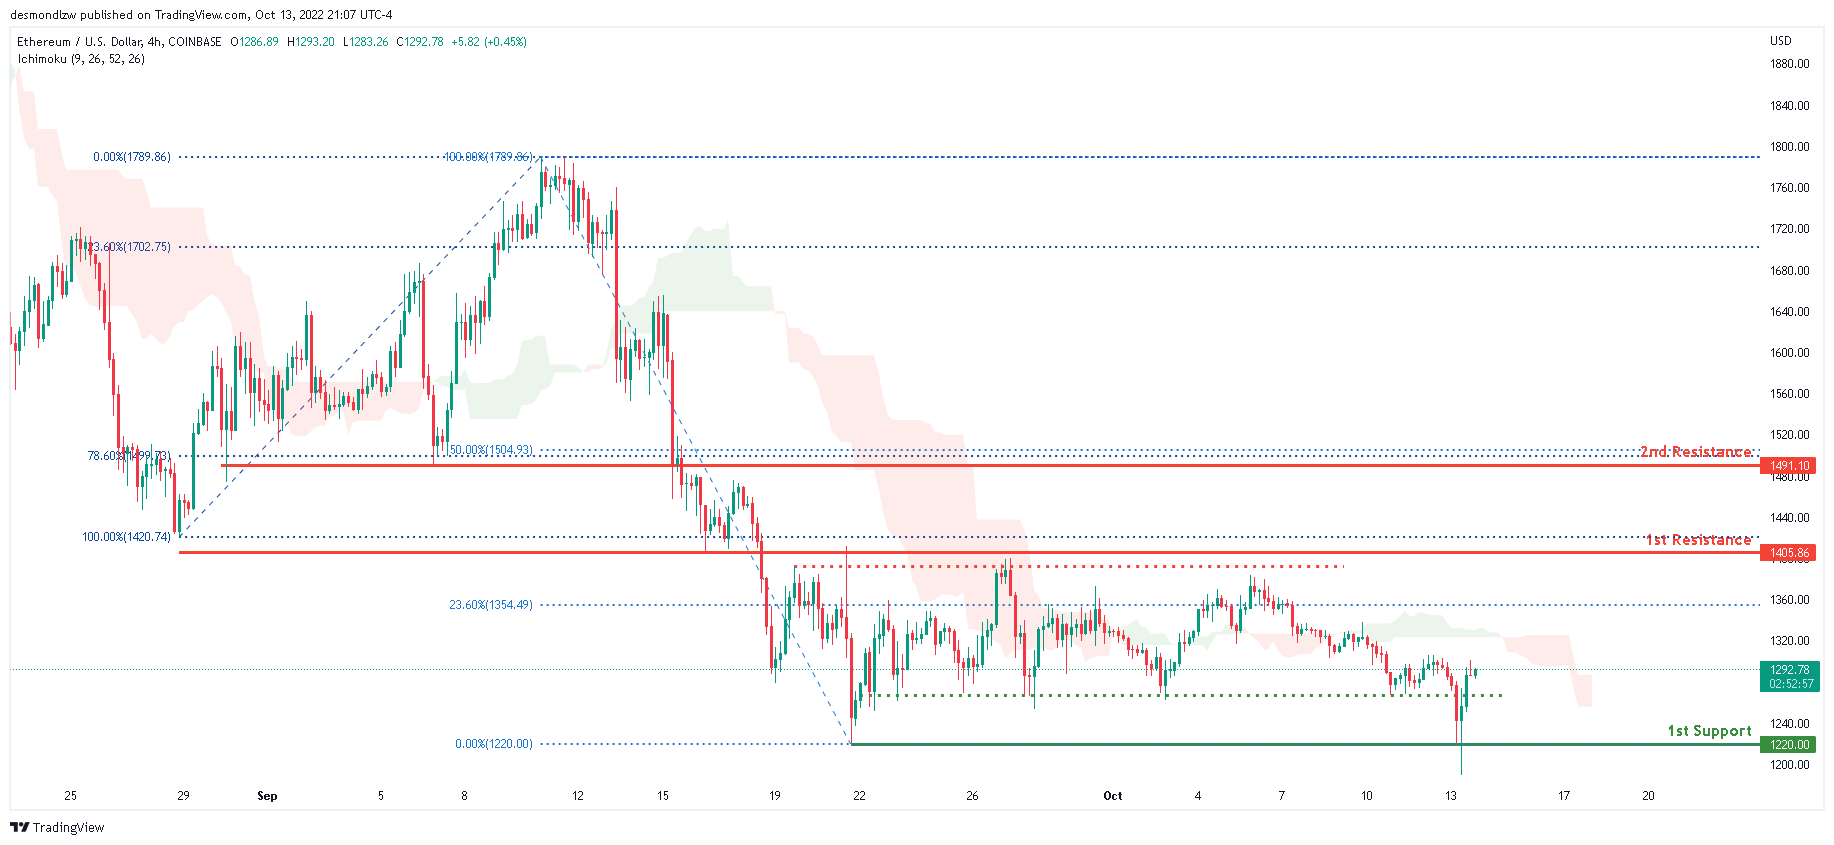
ETHUSD:
Looking at the H4 chart, the current overall bias for ETHUSD is bearish. To add confluence to this bias, the price is currently under the Ichimoku cloud which indicates a bearish market. Overnight, the price continued its bearish momentum downwards and went through the 1st support line at 1220.00, where the 0% Fibonaaci line is located, before reflecting back up. Expecting price to continue consolidating between the 1st support and 2nd resistance.
Areas of consideration:
- H4 time frame, 1st resistance of 1405.86
- H4 time frame, 1st support at 1220.00
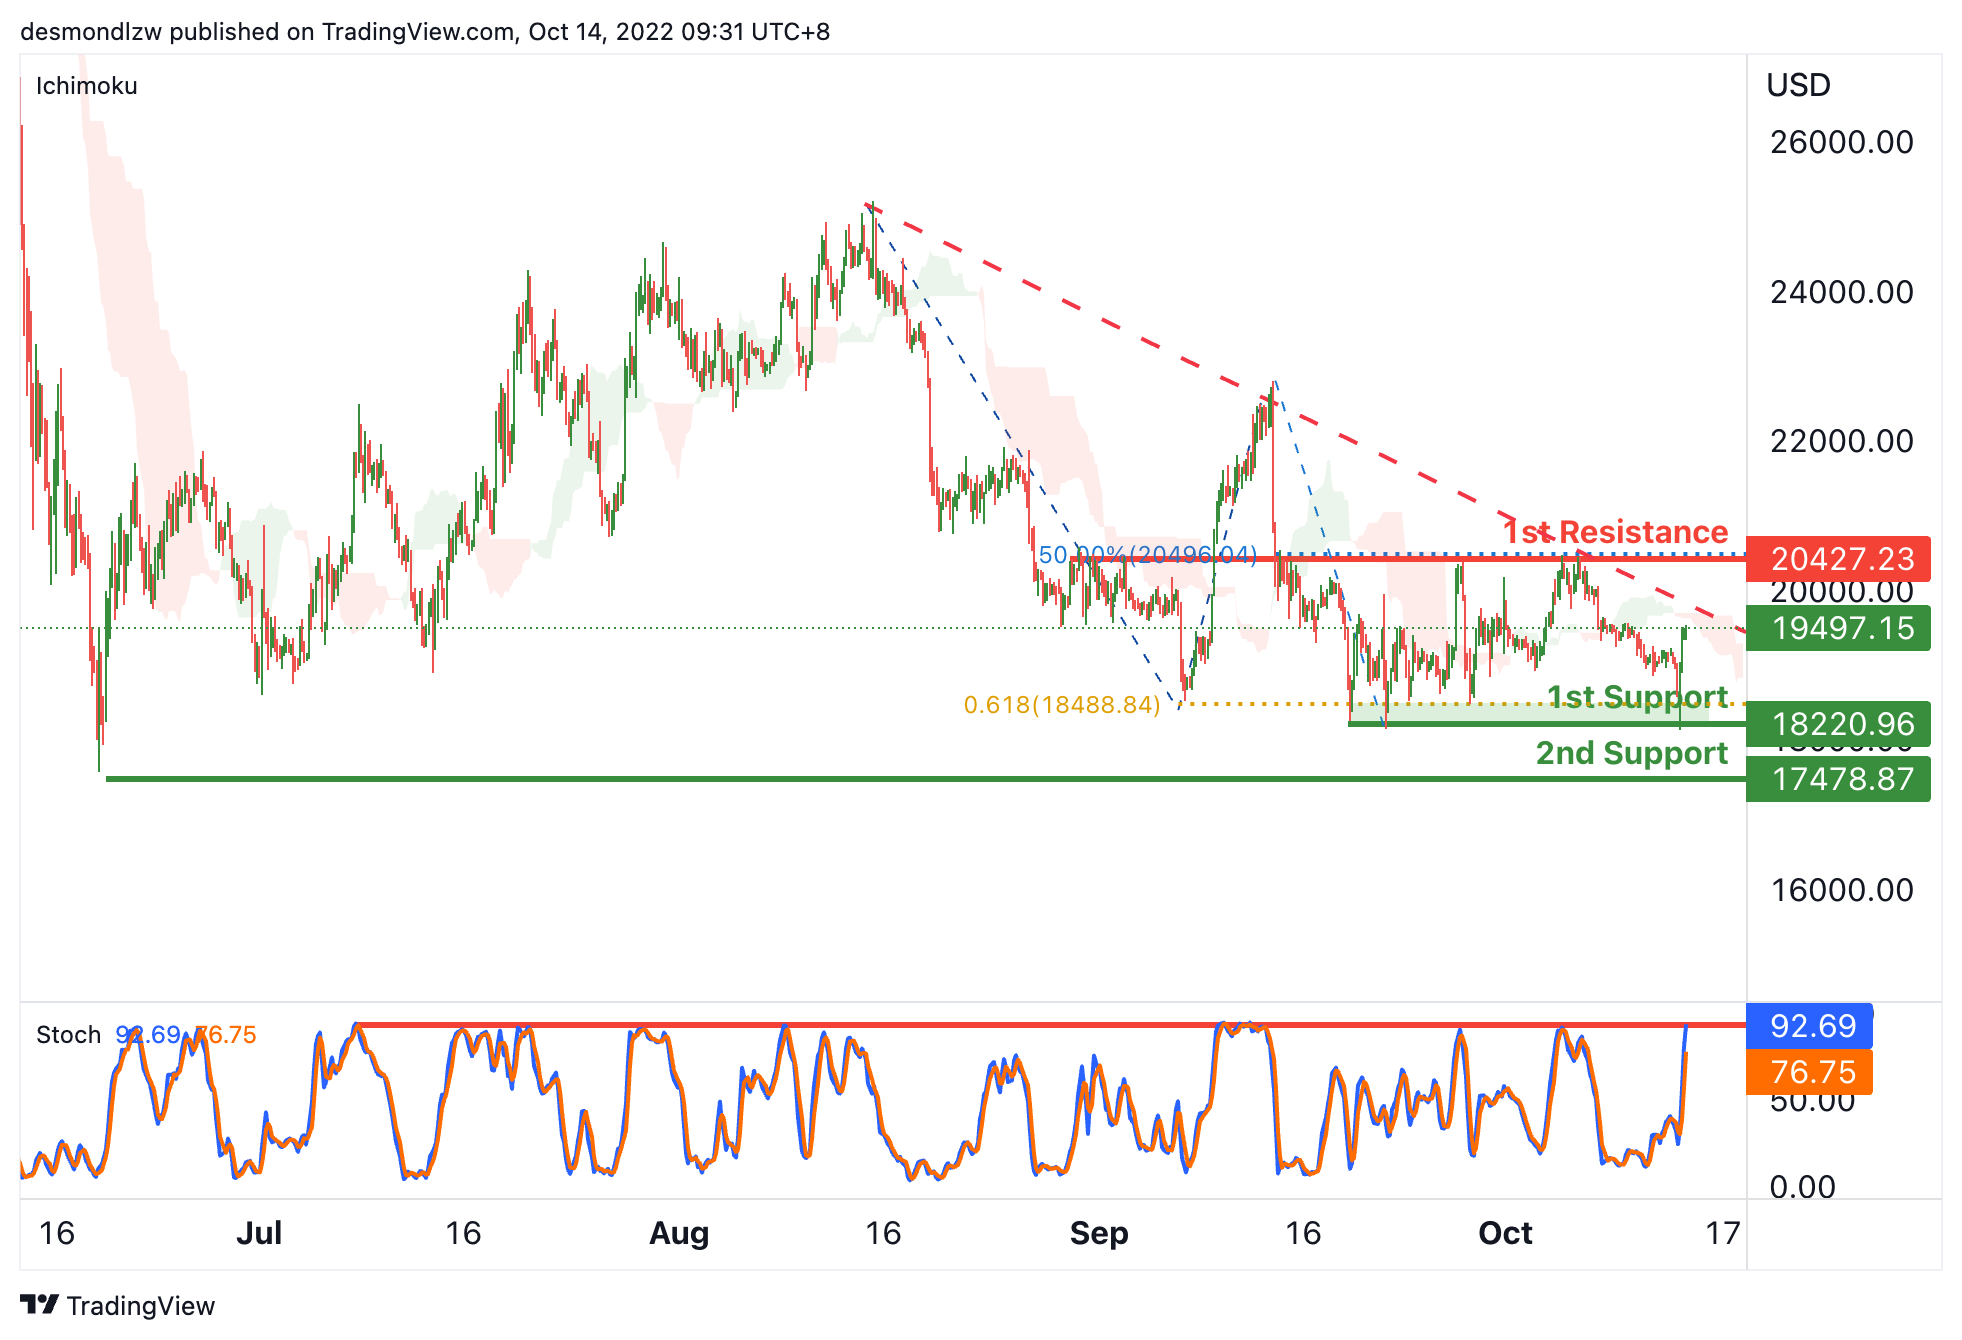
BTCUSD:
On the H4, price is showing a descending trendline and below the ichimoku cloud, we can expect the price drop to test the 1st support at 18220.96, which is in line with the swing lows and 61.8% fibonacci projection. If the 1st support is broken, we can expect the price to drop to the 2nd support at 17478.87, where the previous swing low is. Alternatively, the price may rise to the 1st resistance at 20427.23, where the overlap resistance and 50% fibonacci retracement are.
Areas of consideration:
- H4 time frame, 1st support at 18220.96
- H4 time frame, 2nd support at 17478.87
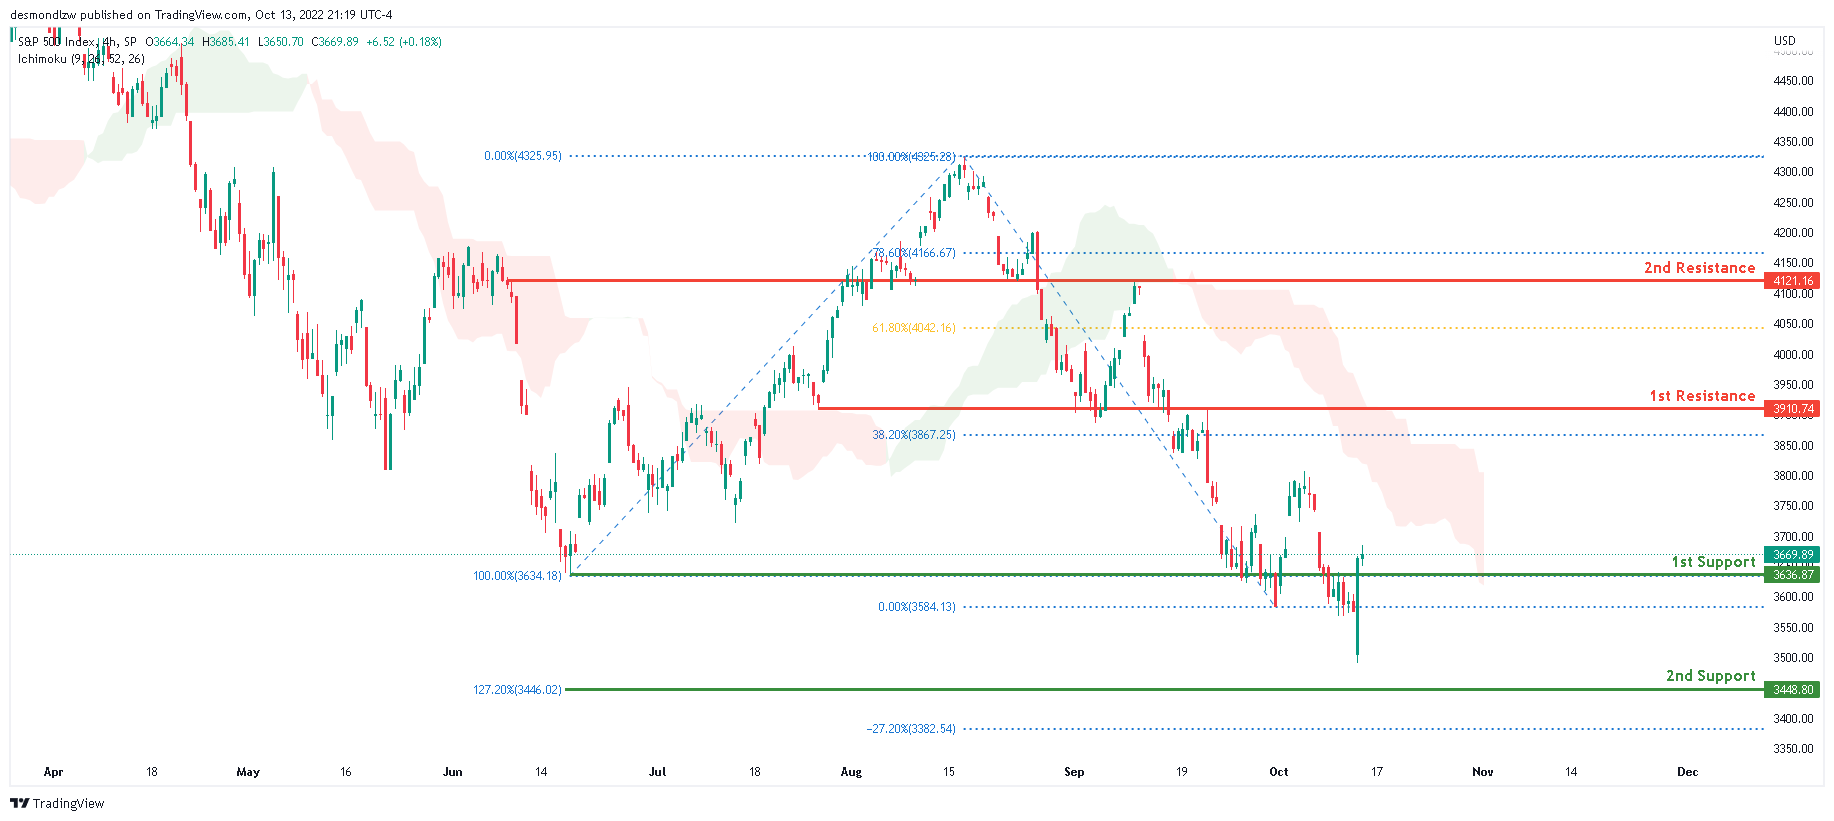
S&P 500:
Based on the H4 chart, the current overall bias for the S&P500 is bearish. To add to this bias, the price is currently below the Ichimoku cloud, indicating a bearish market. Overnight, the price shot back up above the 1st support at 3636.87 where the 100% Fibonacci line and previous low is located due to the release of the US CPI data. If this short term bullish momentum continues, expect price to possibly head towards the 1st resistance at 3910.74 where the 38.2% Fibonacci line is located.
Areas of consideration:
- H4 time frame, 1st support at 3636.87
- H4 time frame, 1st resistance at 3910.74


