
USD/JPY:
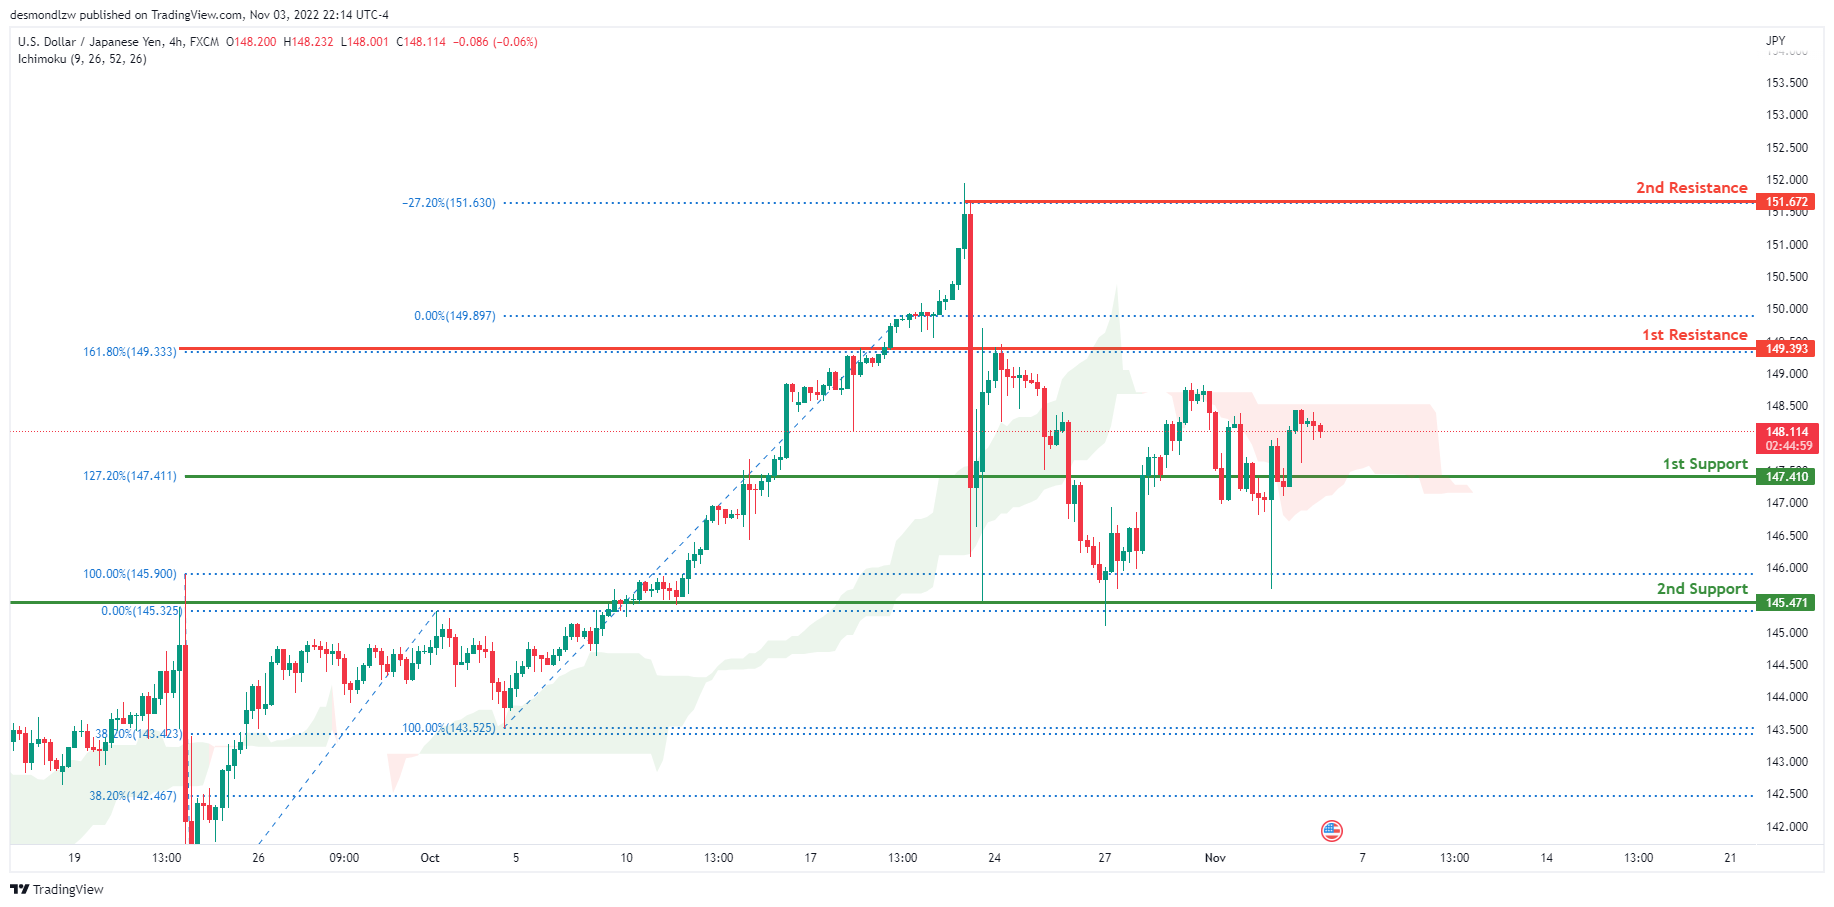
The current general bias for USDJPY on the H4 chart is bearish. Overnight, USDJPY experienced some bullish momentum with the price closing above the 1st support line at 147.410 where the 127.2% Fibonacci extension line is located. Price is currently trading at 148.117 at time of writing. If the overnight’s bullish momentum continues, expect USDJPY to possibly head towards the 1st resistance at 149.393 where the 161.8% and 0% Fibonacci lines are located.
Areas of consideration:
- H4 time frame, 1st resistance at 149.393
- H4 time frame, 1st support at 147.410
DXY:
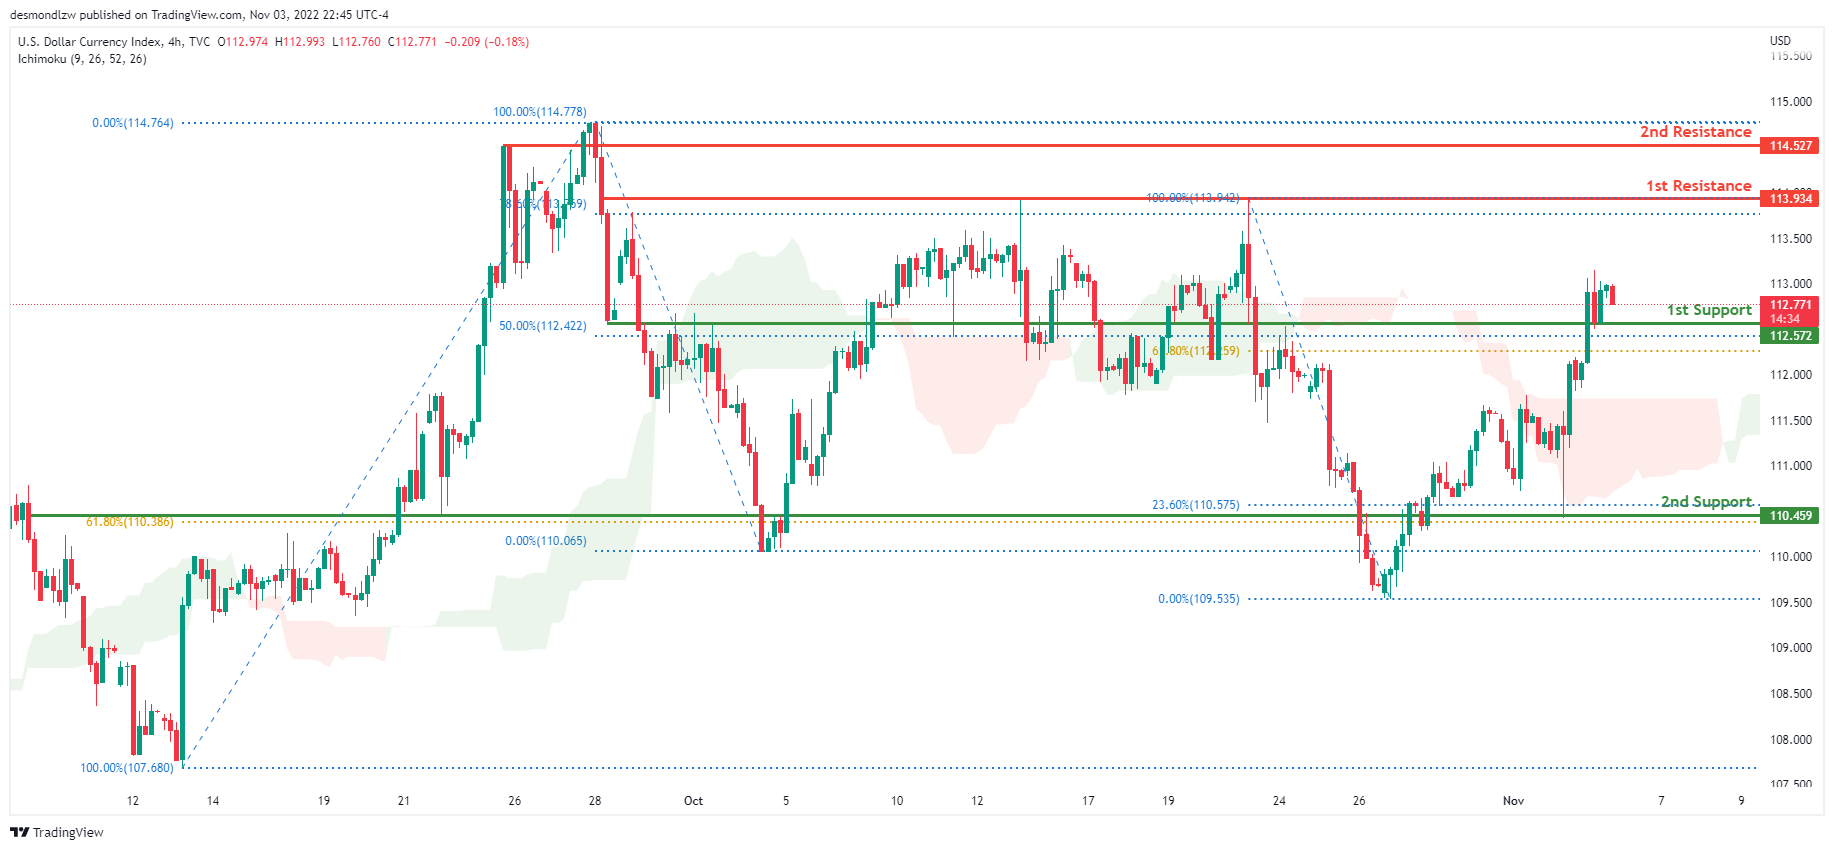
On the H4 chart, the overall bias for DXY is bullish. To add confluence to this, the price is above the Ichimoku cloud which indicates a bullish market. Overnight, price continued to have bullish momentum and price closed above the 1st support level at 112.572 where the 50% Fibonacci line is located. If this bullish momentum continues, expect price to possibly head towards the 1st resistance at 113.934 at where the 78.6% and 100% Fibonacci lines are located.
Areas of consideration:
- H4 time frame, 1st resistance at 113.934
- H4 time frame, 1st support at 112.572
EUR/USD:
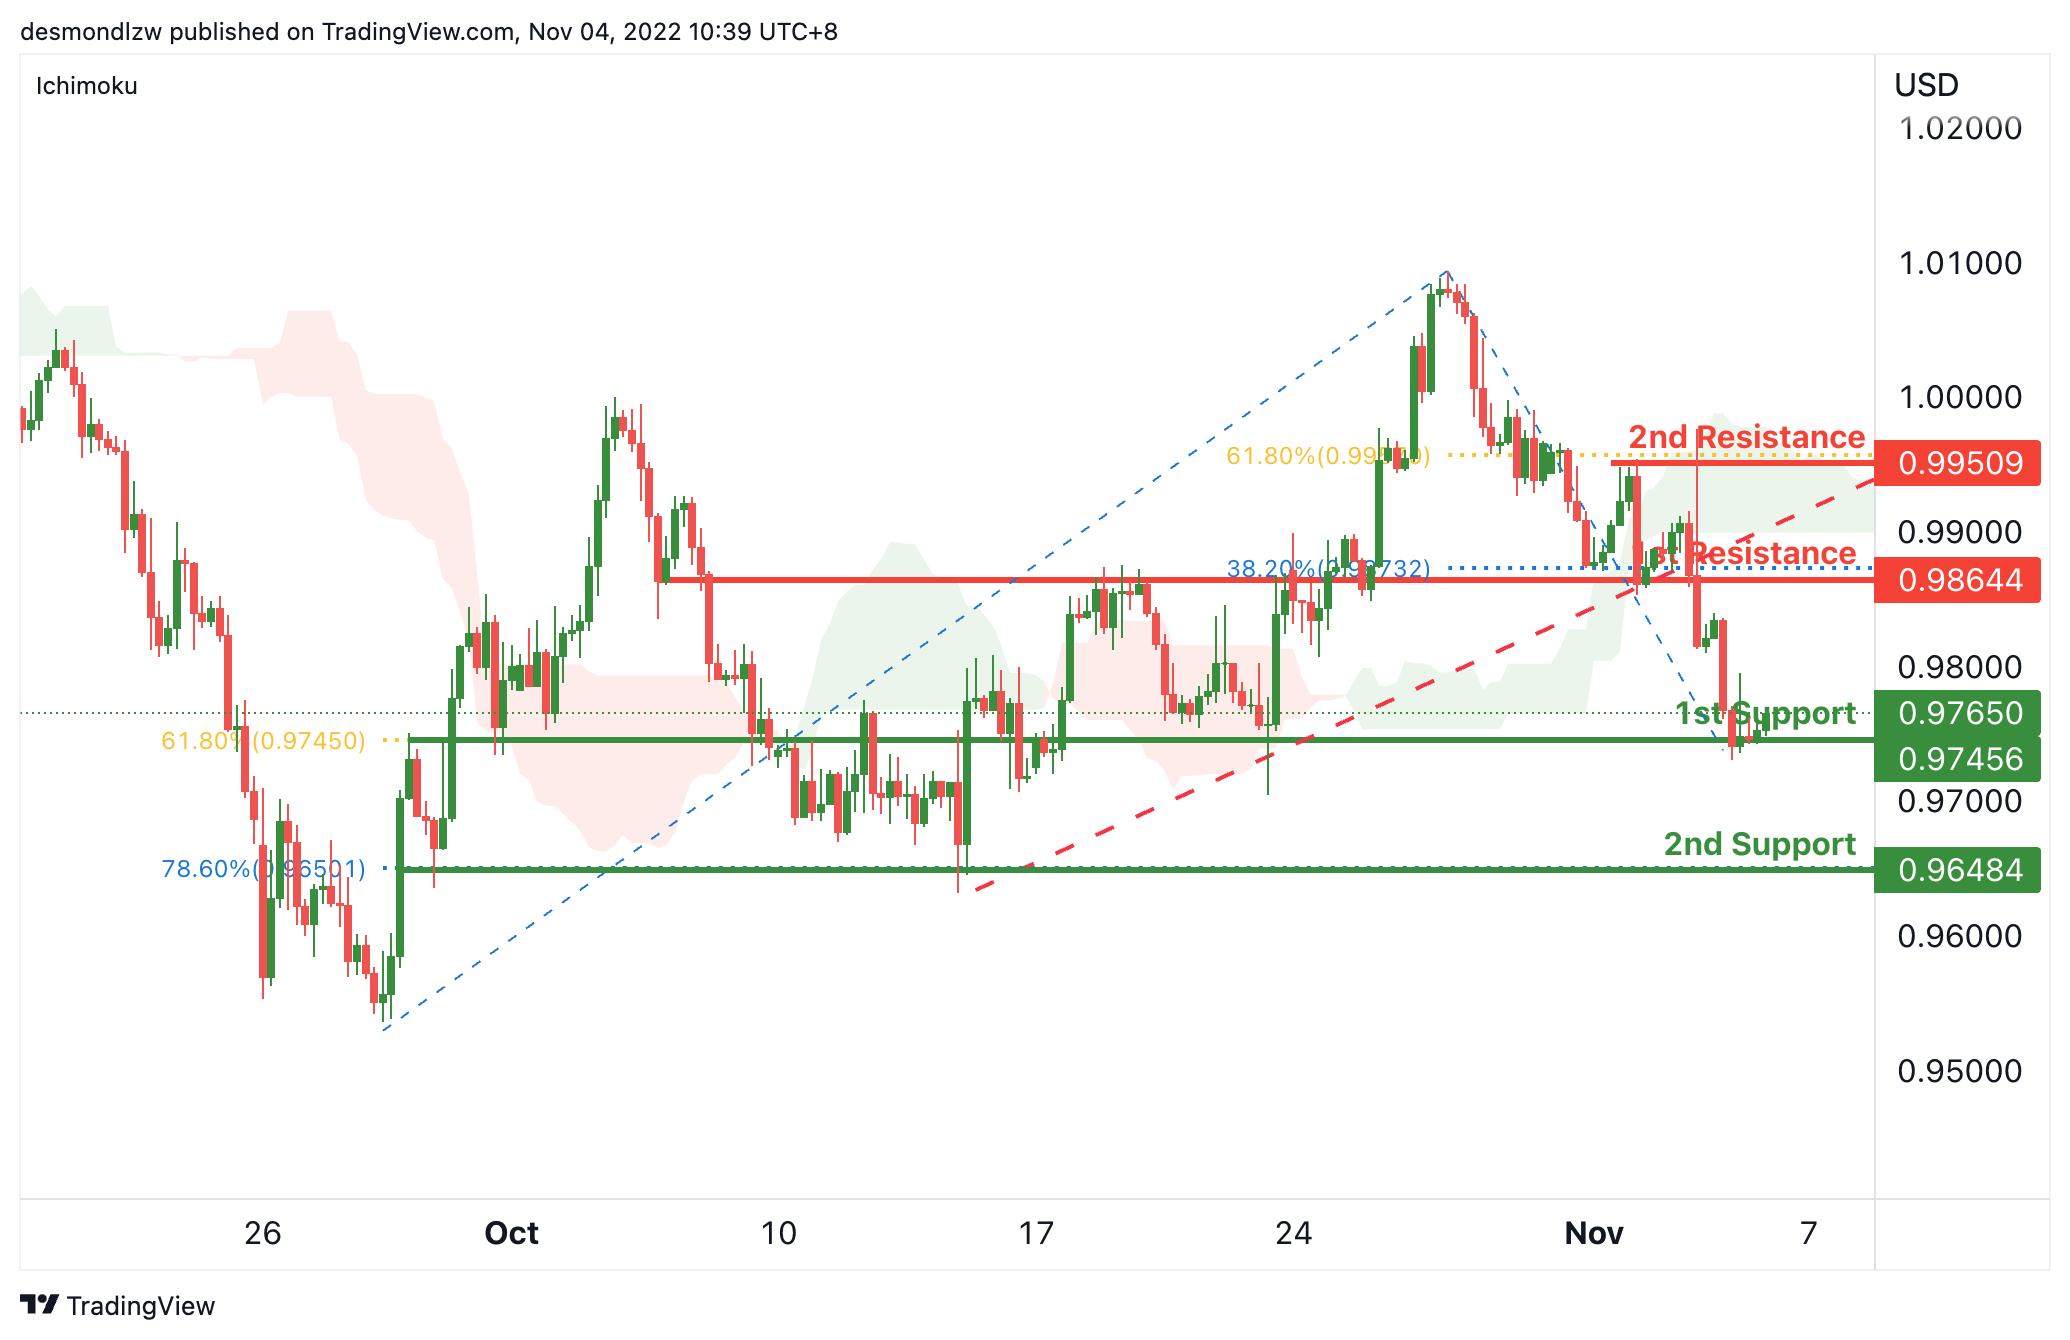
On the H4, with the price breaking the ascending trendline and ichimoku cloud, we have a bearish bias that the price may drop from the 1st support at 0.97456, which is in line with overlap support and 61.8% fibonacci retracement. If the 1st support is broken, the 2nd support is at 0.96484, which is in line with the 78.6% fibonacci retracement. Alternatively, the price may rise to the 1st resistance at 0.98644, where the overlap resistance and 38.2% fibonacci retracement are. If the 1st resistance is broken, the 2nd resistance is at 0.99509, which is in line with the overlap resistance and 61.8% fibonacci retracement.
Areas of consideration :
- H4 1st support at 0.97456
- H4 2nd support is 0.96484,
GBP/USD:
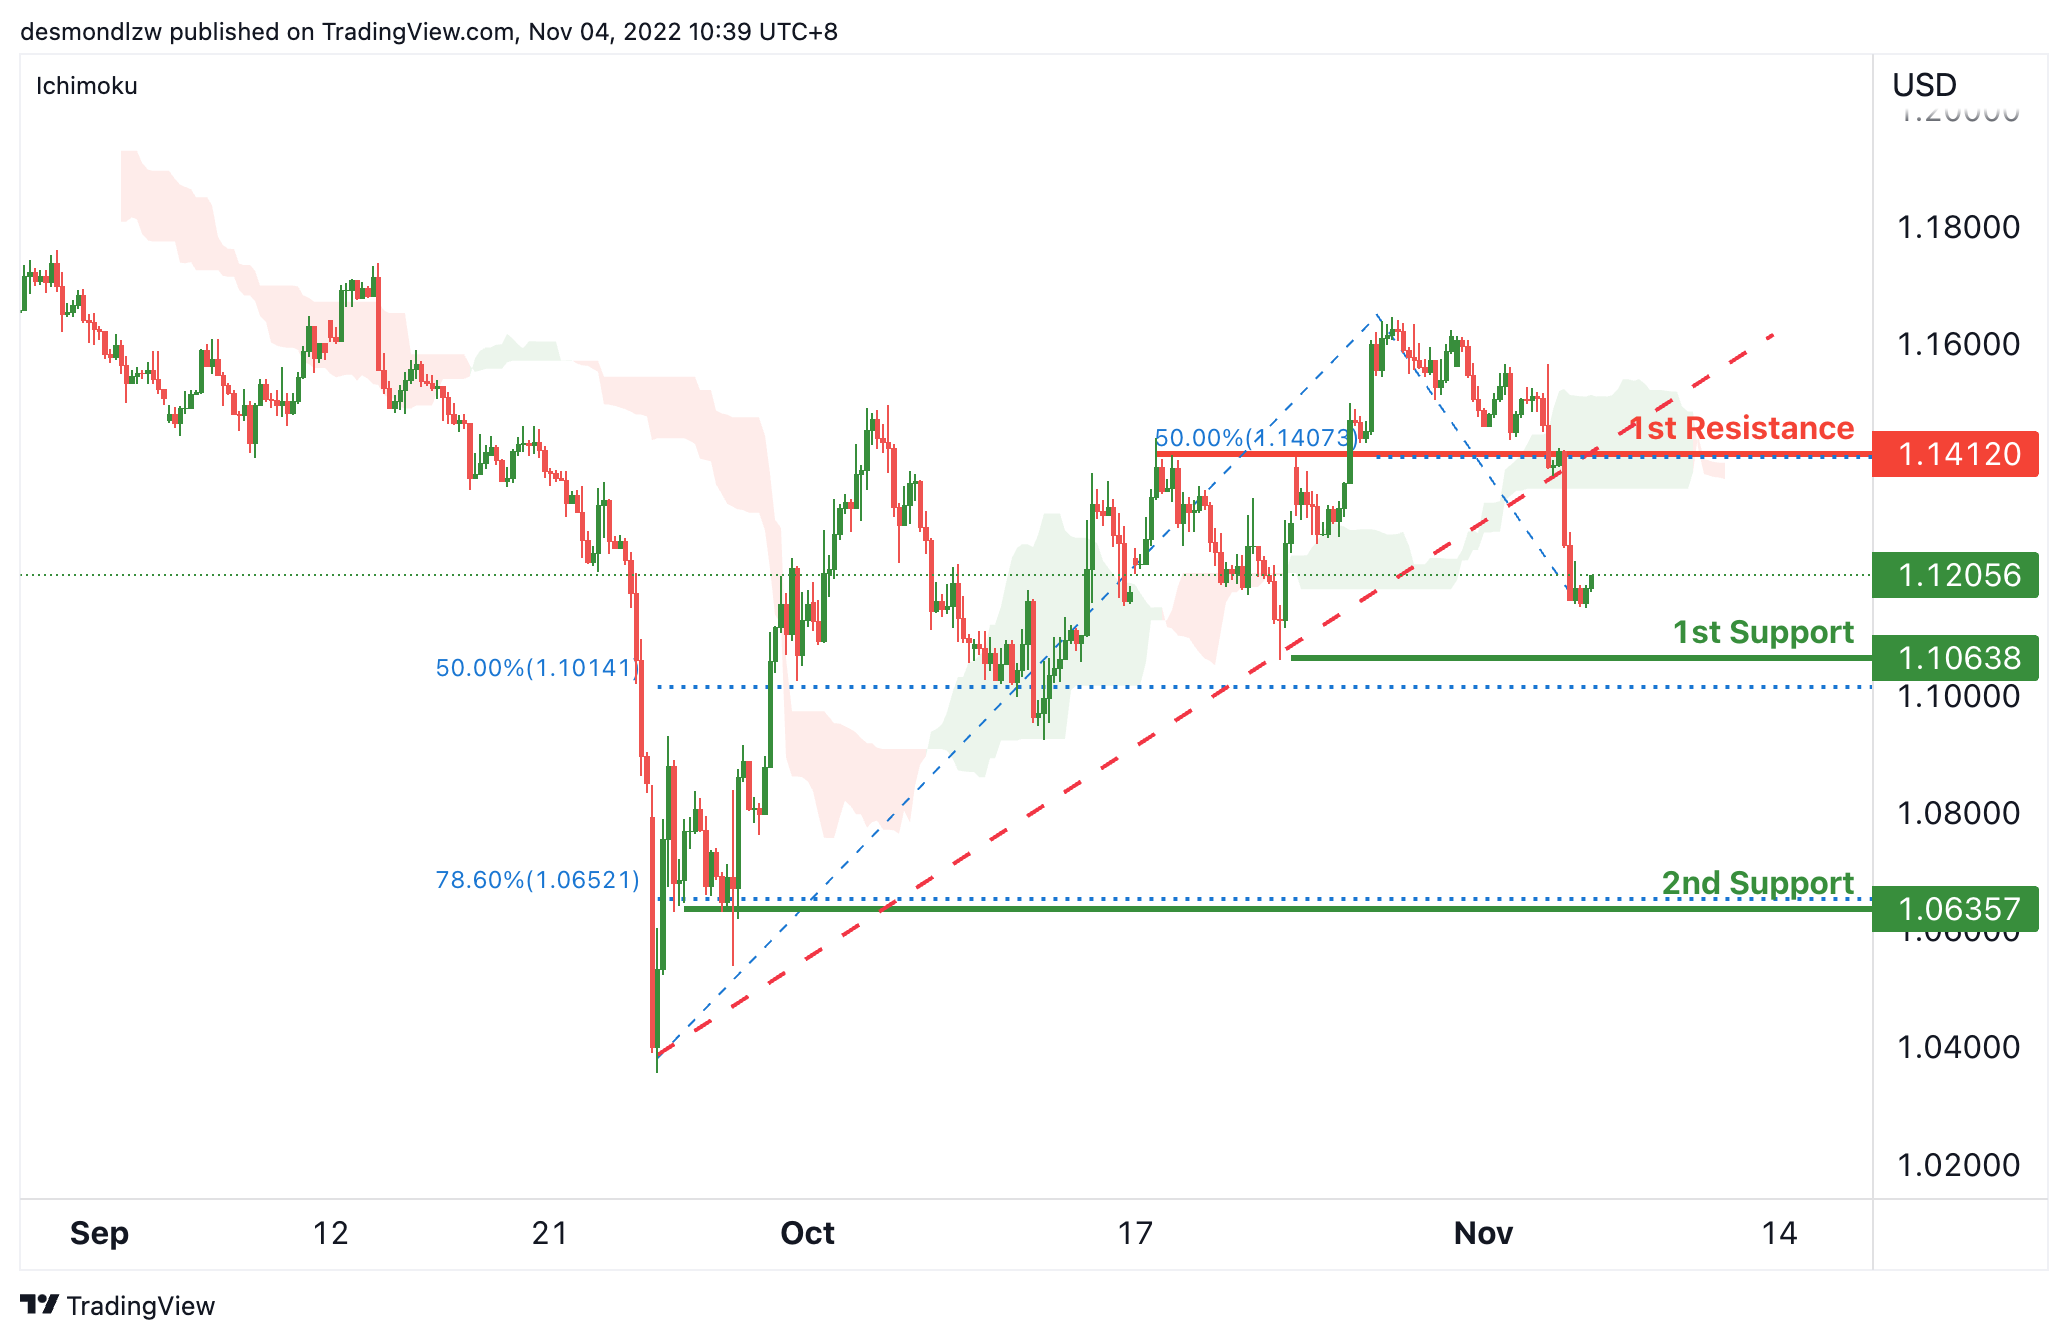
On the H4, price is below the ichimoku cloud and breaking the ascending trendline, we have a bearish bias that the price may drop to the 1st support at 1.10638, which is in line with the previous support and 50% fibonacci retracement. If the 1st support is broken, the 2nd support is at 1.06357, where the 78.6% fibonacci retracement is. Alternatively, the price may rise to the 1st resistance at 1.14120, where the overlap resistance and 50% fibonacci retracement are.
Areas of consideration:
- H4 current price
- H4 1st support at 1.10638
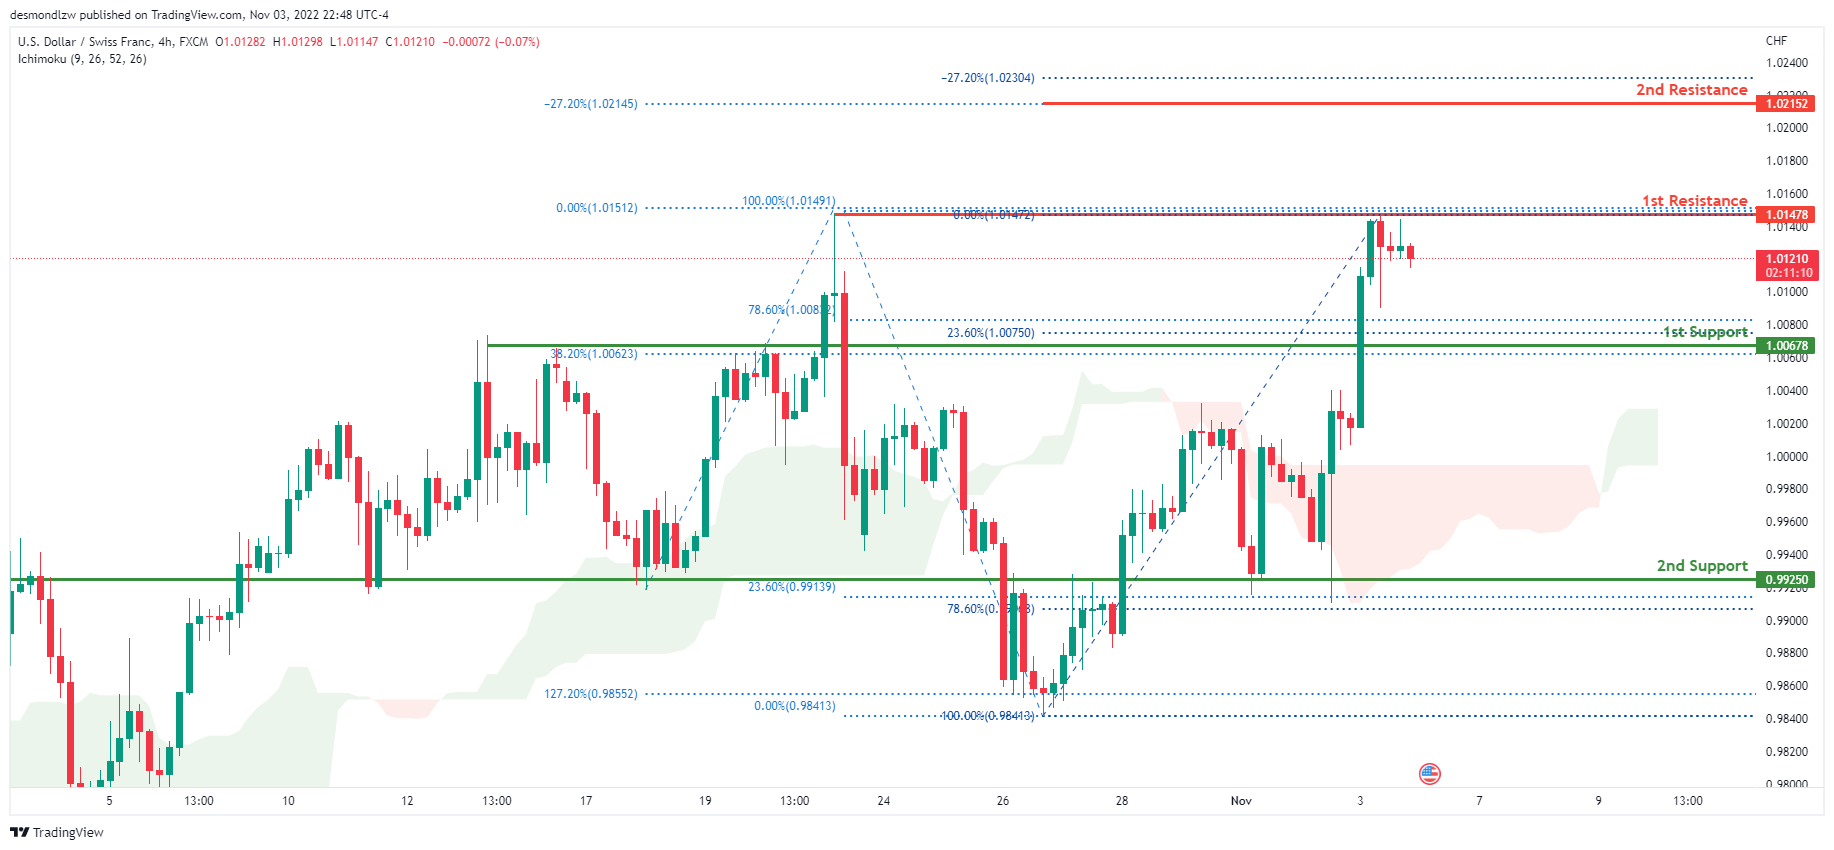
USD/CHF:
On the H4 chart, the overall bias for USDCHF is bullish. To add confluence to this, the price is above the Ichimoku cloud which indicates a bearish market. Overnight, USDCHF continued its bullish momentum upwards with the price currently trading at 1.01210 under the 1st resistance line at 1.01478 where the 100% Fibonacci line and previous swing high was located. If this bullish momentum continues, expect price to possibly break the 1st resistance and head towards the 2nd resistance at 1.02152 where 2 of the -27.2% Fibonacci lines are located.
Areas of consideration
- H4 1st support at 1.00678
- H4 1st resistance at 1.01210
- H4 2nd resistance at 1.02152
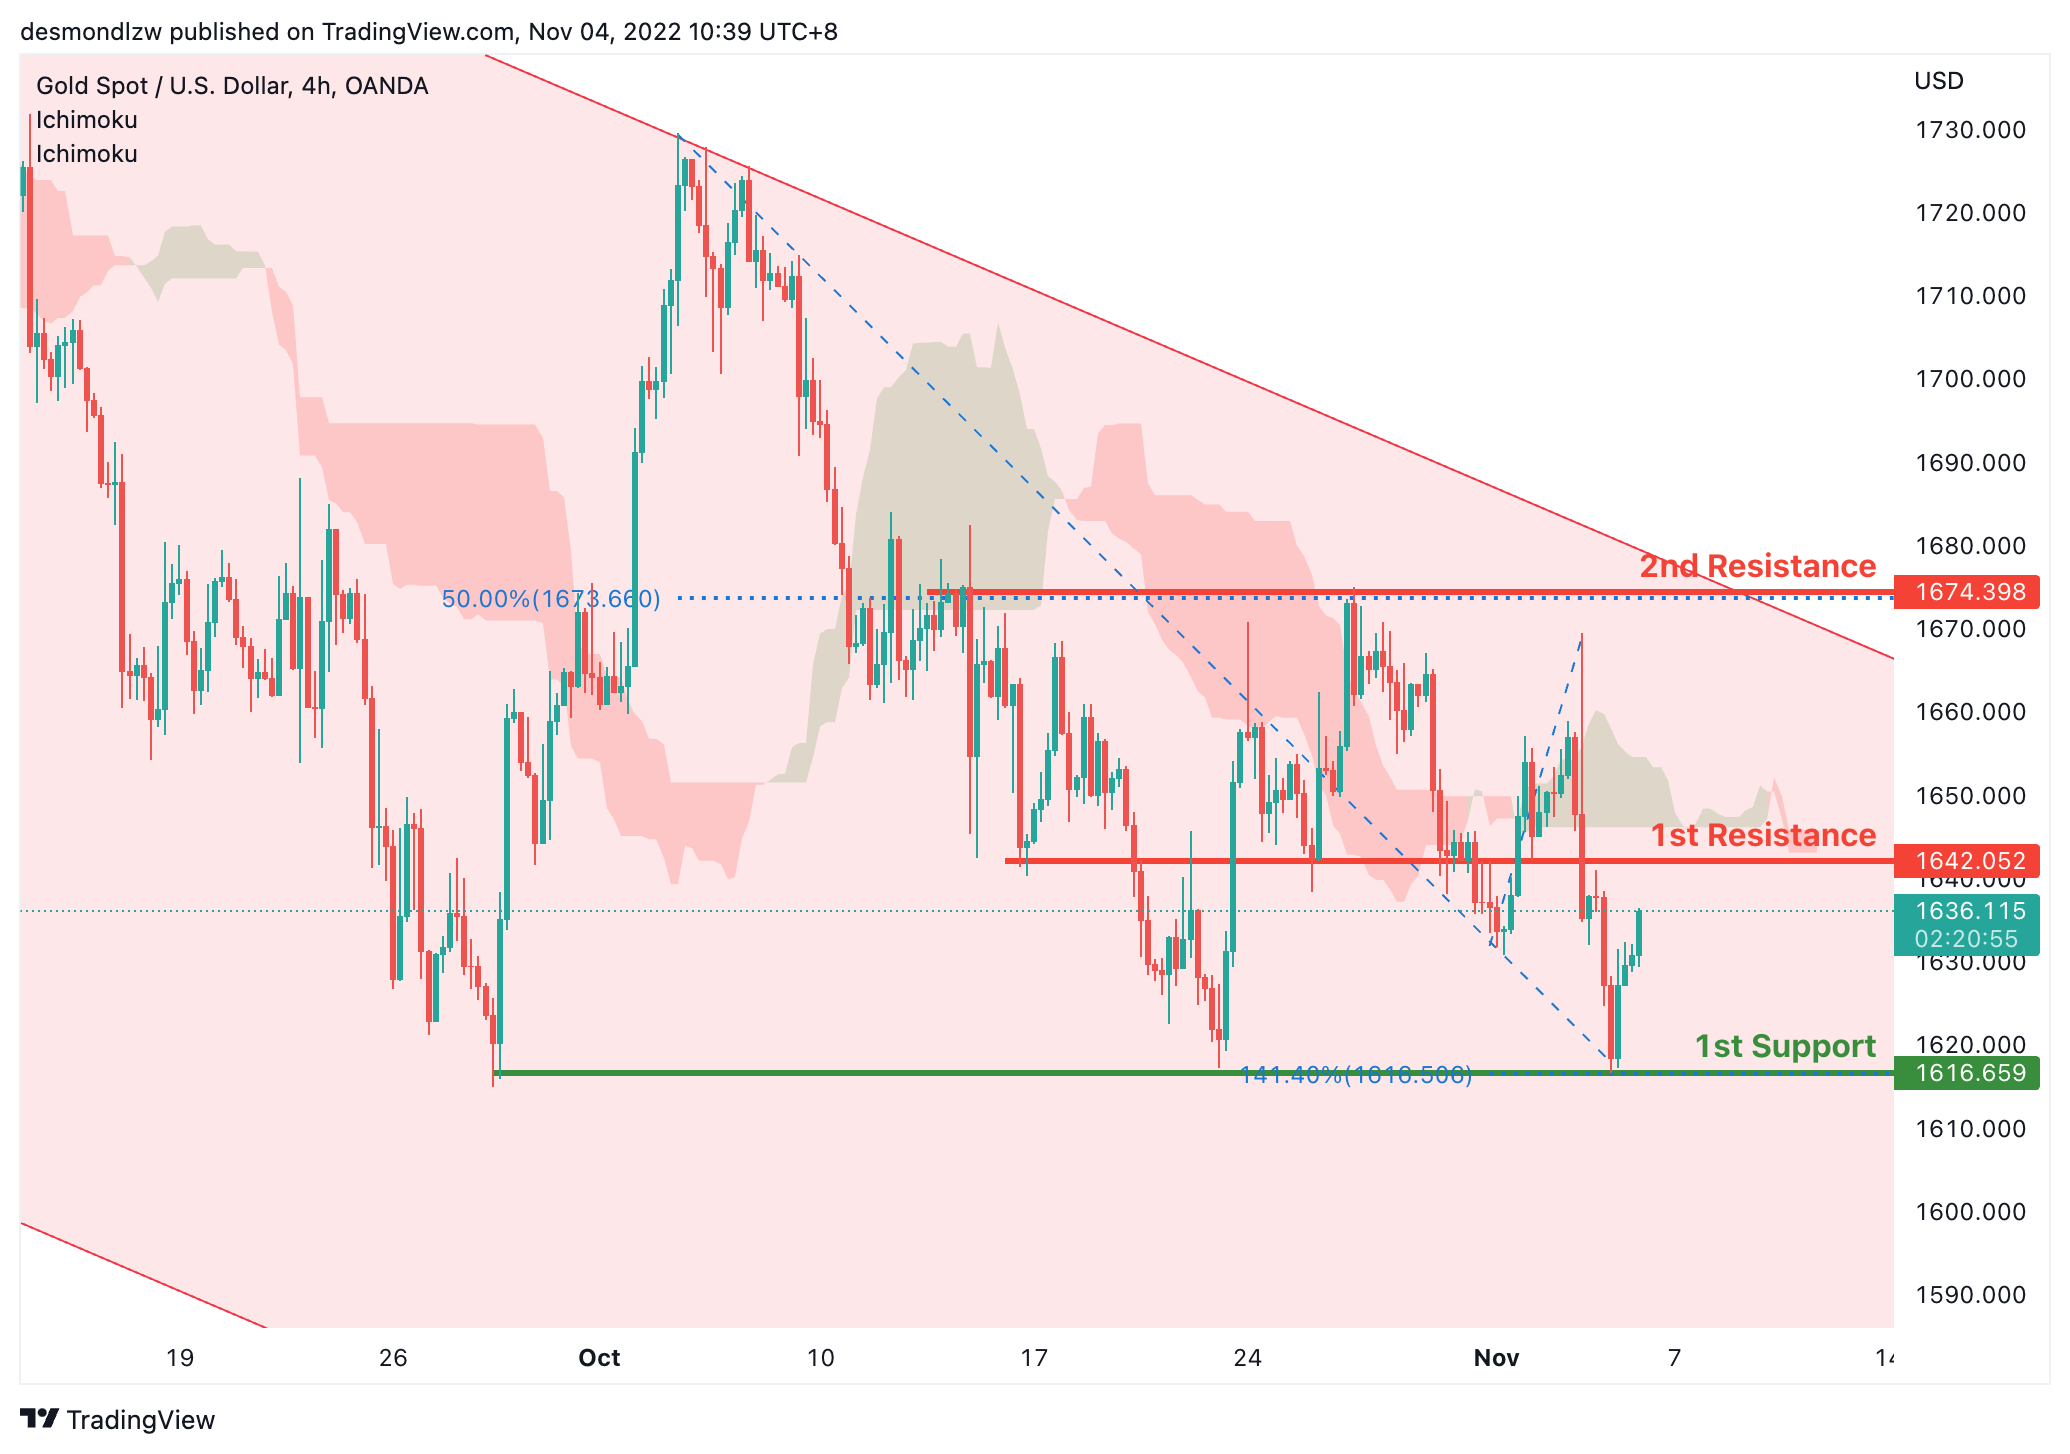
XAU/USD (GOLD):
On H4, with the price within the descending channel and crossing ichimoku cloud, we have a bullish bias that the price may rise to the 1st resistance at 1642.052, which is in line with the overlap resistance and then drop back to the 1st support at 1616.659, where the previous swing lows are. Alternatively, the price may break the 1st resistance and rise to the 2nd resistance at 1674.398, where the previous swing high and 50% fibonacci retracement are.
Areas of consideration:
- H4 time frame, 1st resistance at 1642.052
- H4 time frame, 1st support at 1616.659
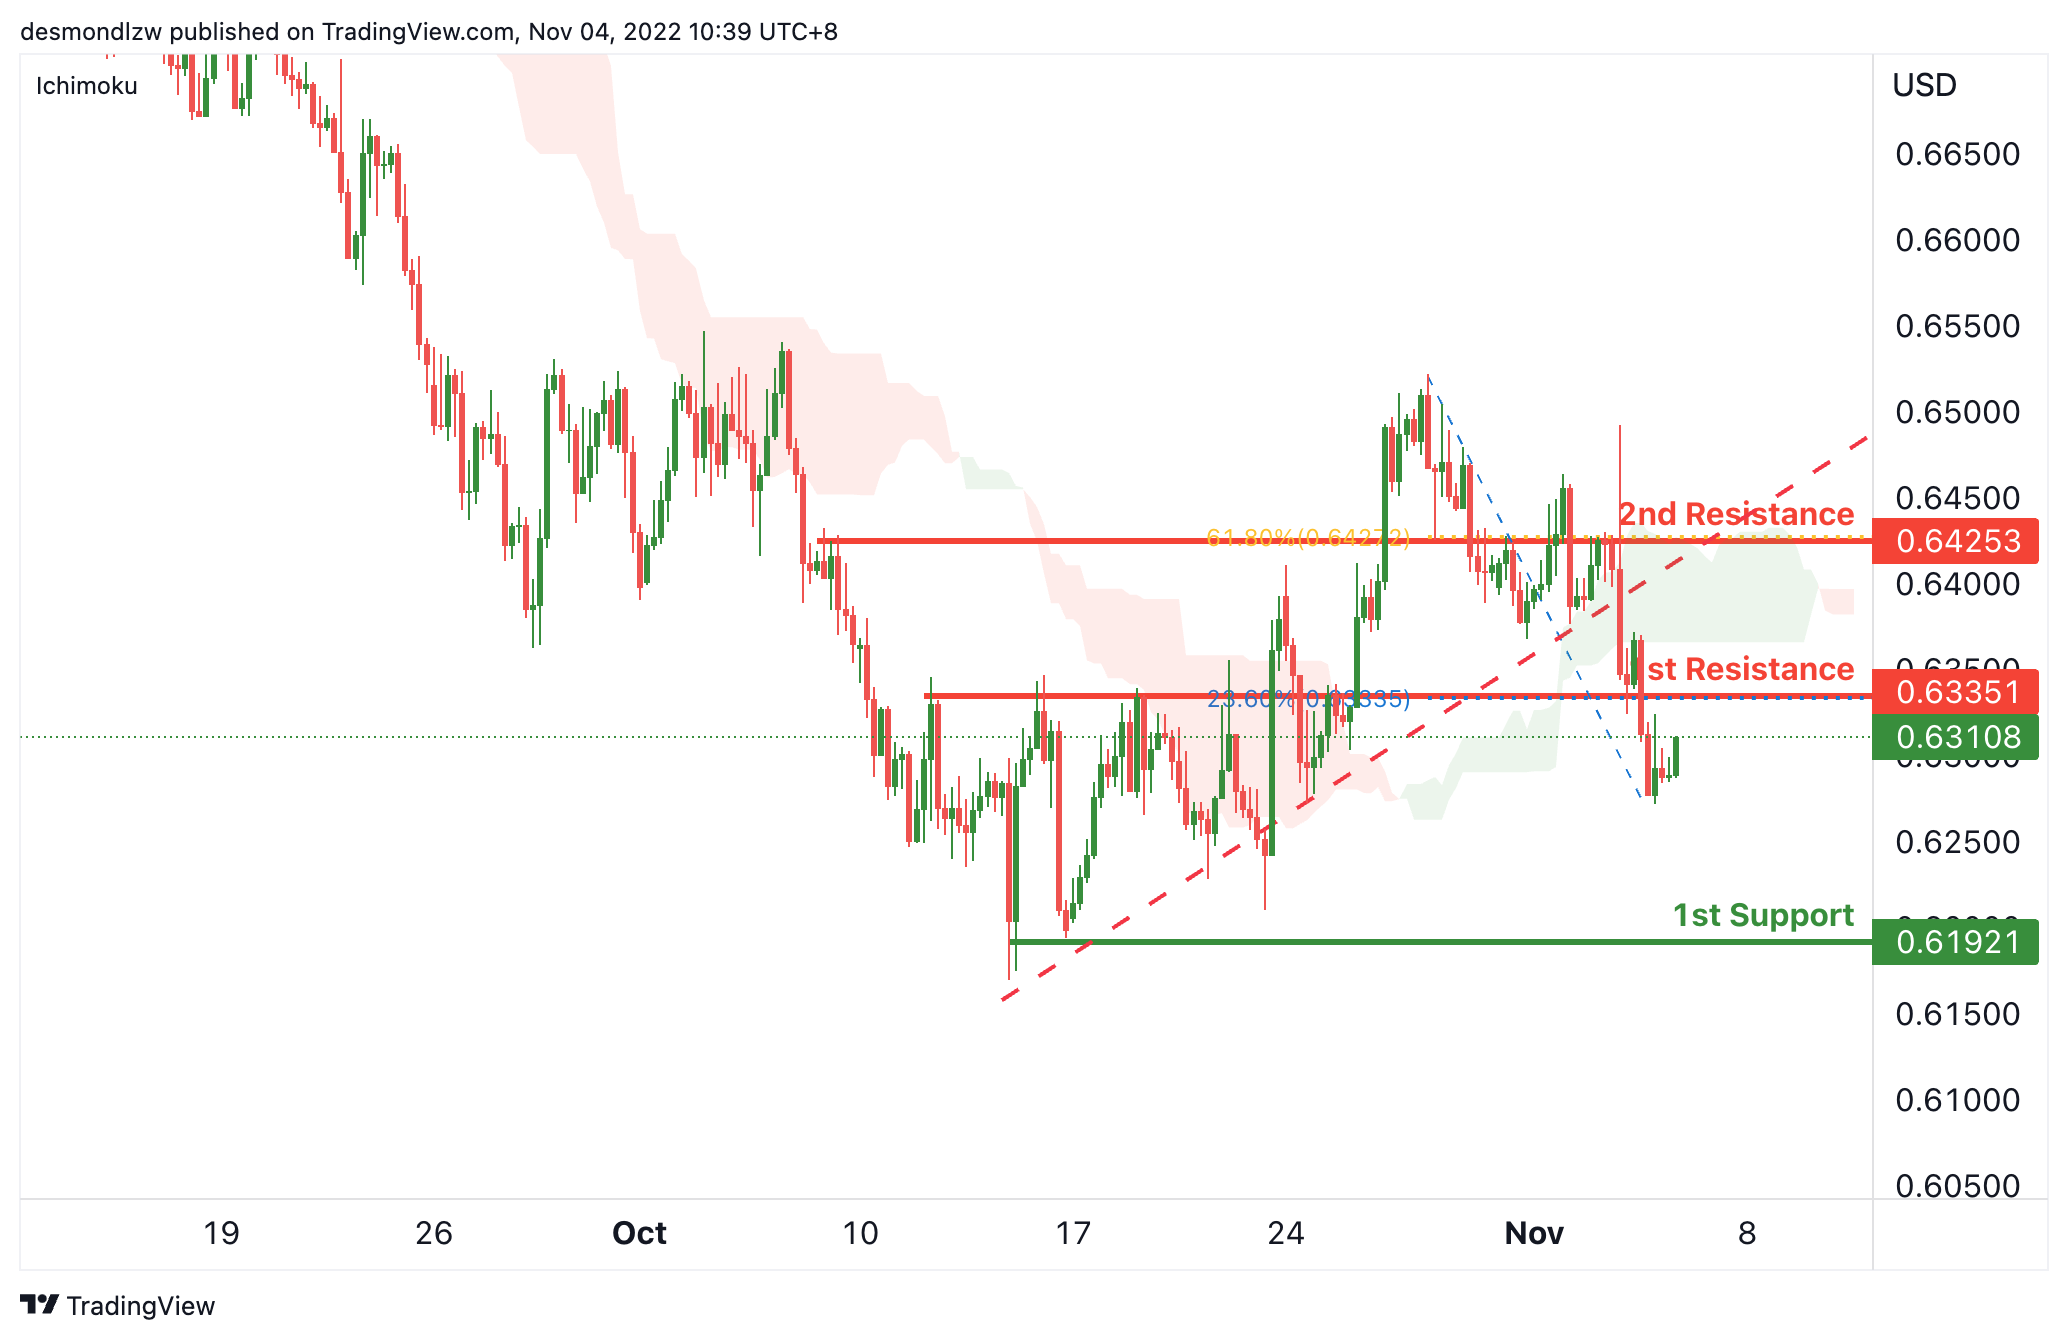
AUD/USD:
On the H4, with the price crossing the ichimoku cloud and breaking ascending trendline, we can expect the price drop from the 1st resistance at 0.63351, which is in line with the overlap resistance and 23.6% fibonacci retracement to the 1st support at 0.61921, where the swing low is. Alternatively, the price may rise to the 2nd resistance at 0.64252, where the 61.8% fibonacci retracement is.
Areas of consideration
- H4, 1st resistance at 0.63351
- H4, 1st support at 0.61921
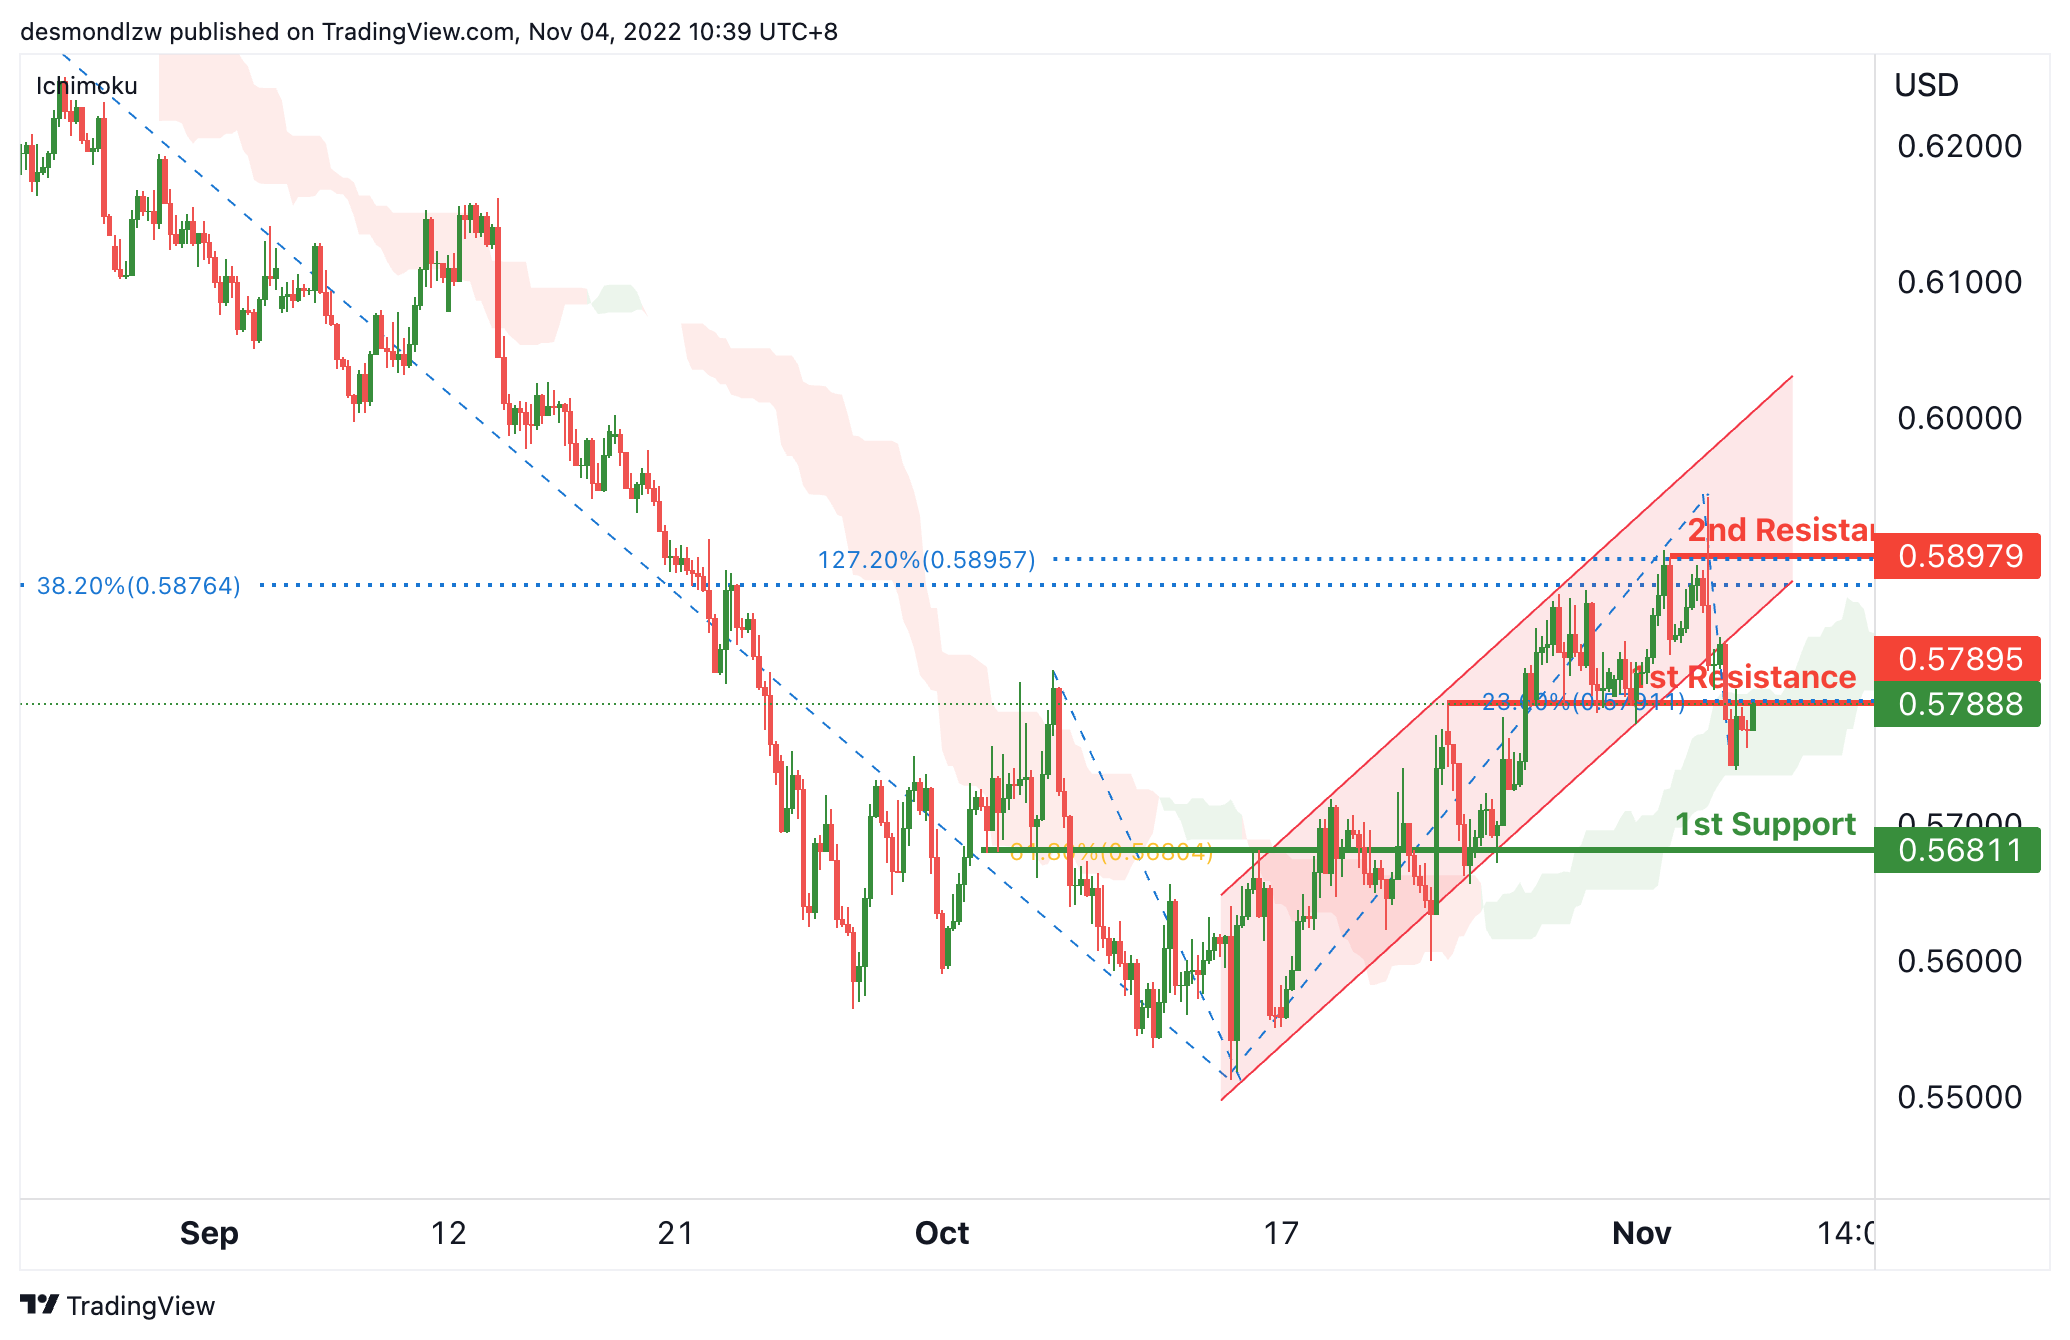
NZD/USD:
On the H4 chart, as the price is breaking the ascending channel, we have a bearish bias that the price may drop from the 1st resistance at 0.57863, which is in line with the overlap resistance and 23.6% fibonacci retracement to the 1st support at 0.56811, which is in line with the 61.8% fibonacci retracement. Alternatively, the price may rise to the 2nd resistance at 0.58979, where the previous swing high, 38.2% fibonacci retracement and 127.2% fibonacci extension are.
Areas of consideration:
- H4 time frame, 1st resistance at 0.57863
- H4 time frame, 1st support at 0.56811
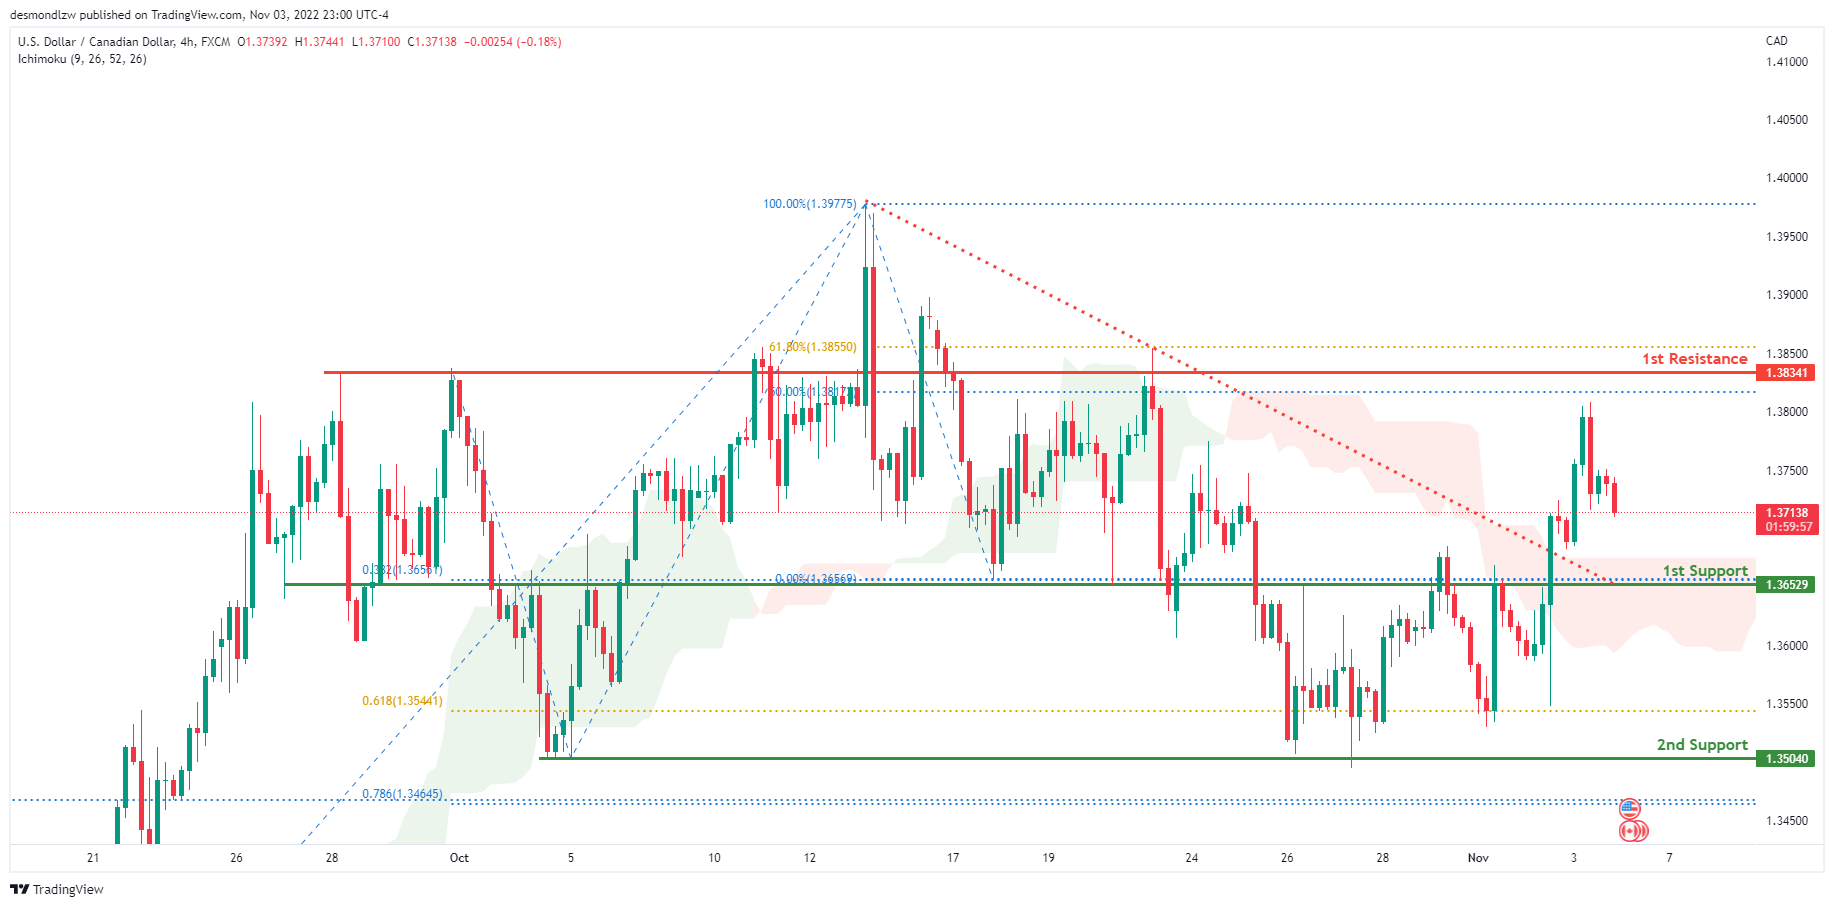
USD/CAD:
On the H4 chart, the overall bias for USDCAD is bullish with price breaking the bearish trend line. To add confluence to this, the price is above the Ichimoku cloud which indicates a bullish market. Overnight, price had some bearish retracement with price currently trading at 1.37093 at the time of writing. If this bullish momentum continues, expect price to possibly head towards the 1st resistance line at 1.38341 where the 61.8% and 50% Fibonacci lines are located.
Areas of consideration:
- H4 time frame, 1st resistance at 1.38341
- H4 time frame, 1st support at 1.36529
- H4 time frame, 2nd support at 1.35040
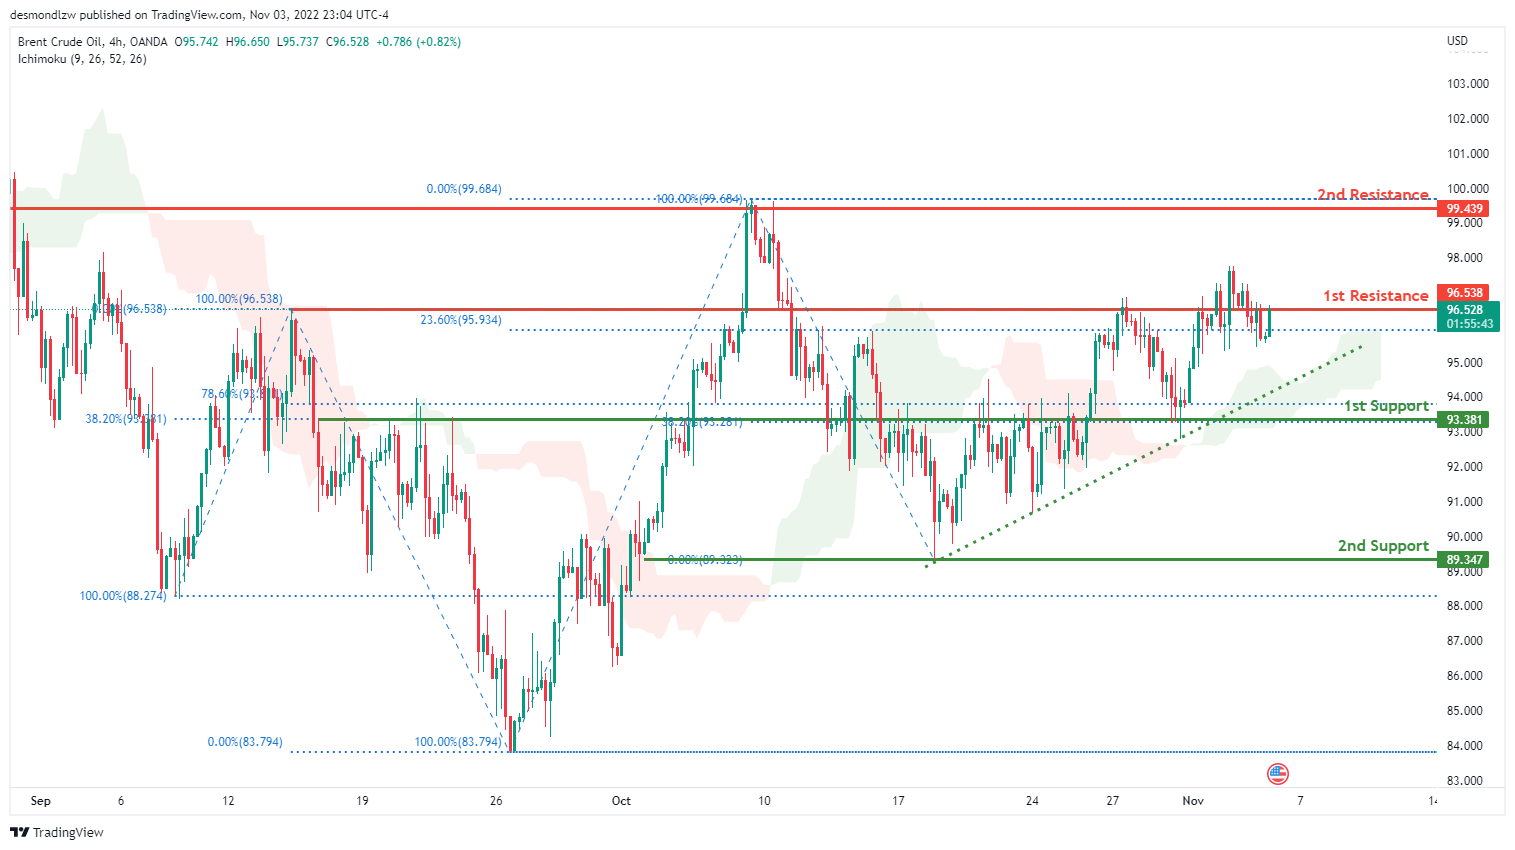
OIL:
Looking at the H4 chart, the current overall bias for Oil is bullish. To add confluence to this, the price is above the Ichimoku cloud which indicates a bullish market. Overnight, price continued to consolidate along the 1st support line at 96.538 where the 100% and 23.6% Fibonacci lines are located. If this bullish momentum continues, expect price to possibly head towards the 1st resistance at 99.439 where previous swing high and 0% Fibonacci line is located.
Areas of consideration:
- H4 time frame, 1st resistance at 99.439
- H4 time frame, 1st support at 96.538
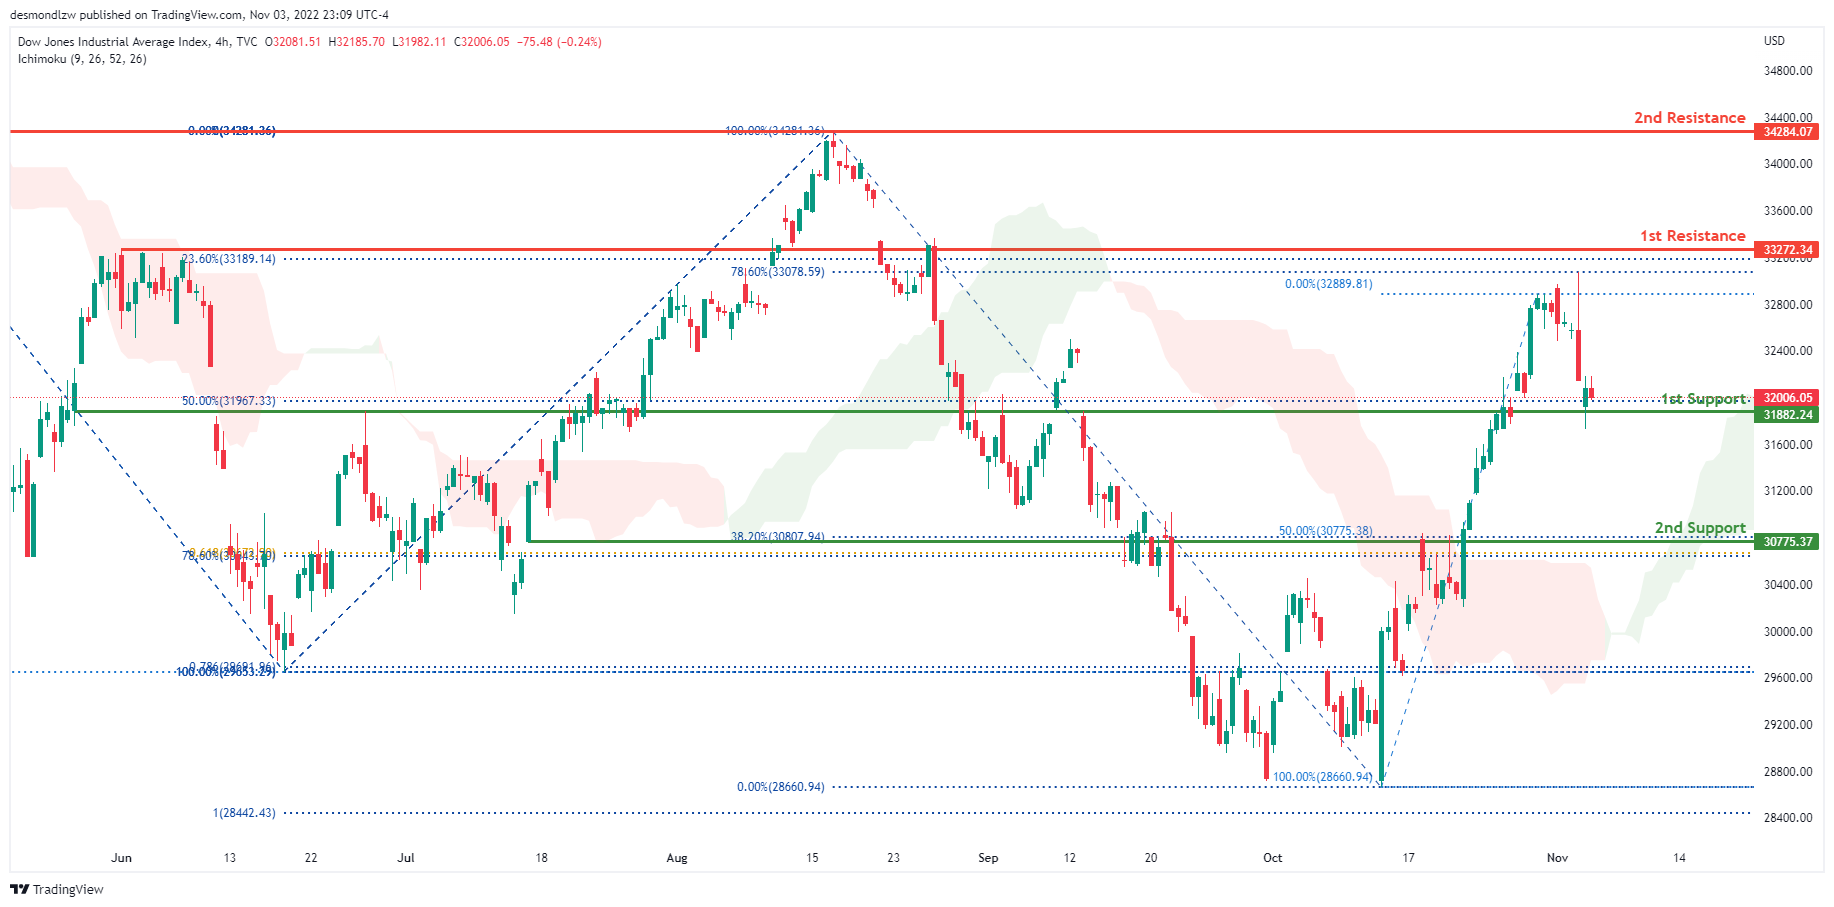
Dow Jones Industrial Average:
On the H4 chart, the overall bias for DJI is bullish. To add confluence to this, the price is above the Ichimoku cloud which indicates a bullish market. Overnight, it continued its bearish momentum downwards with the price currently resting along the 1st support at 31882.24 where the 50% Fibonacci line is located. The price is currently trading at 32006.05 at time of writing. If this bullish momentum continues, expect the price to possibly head towards the 1st resistance at 33272.34 where the 23.6% and 78.6% Fibonacci lines are located.
Areas of consideration:
- H4 time frame, 1st support at 31882.24
- H4 time frame, 1st Resistance at 33272.34
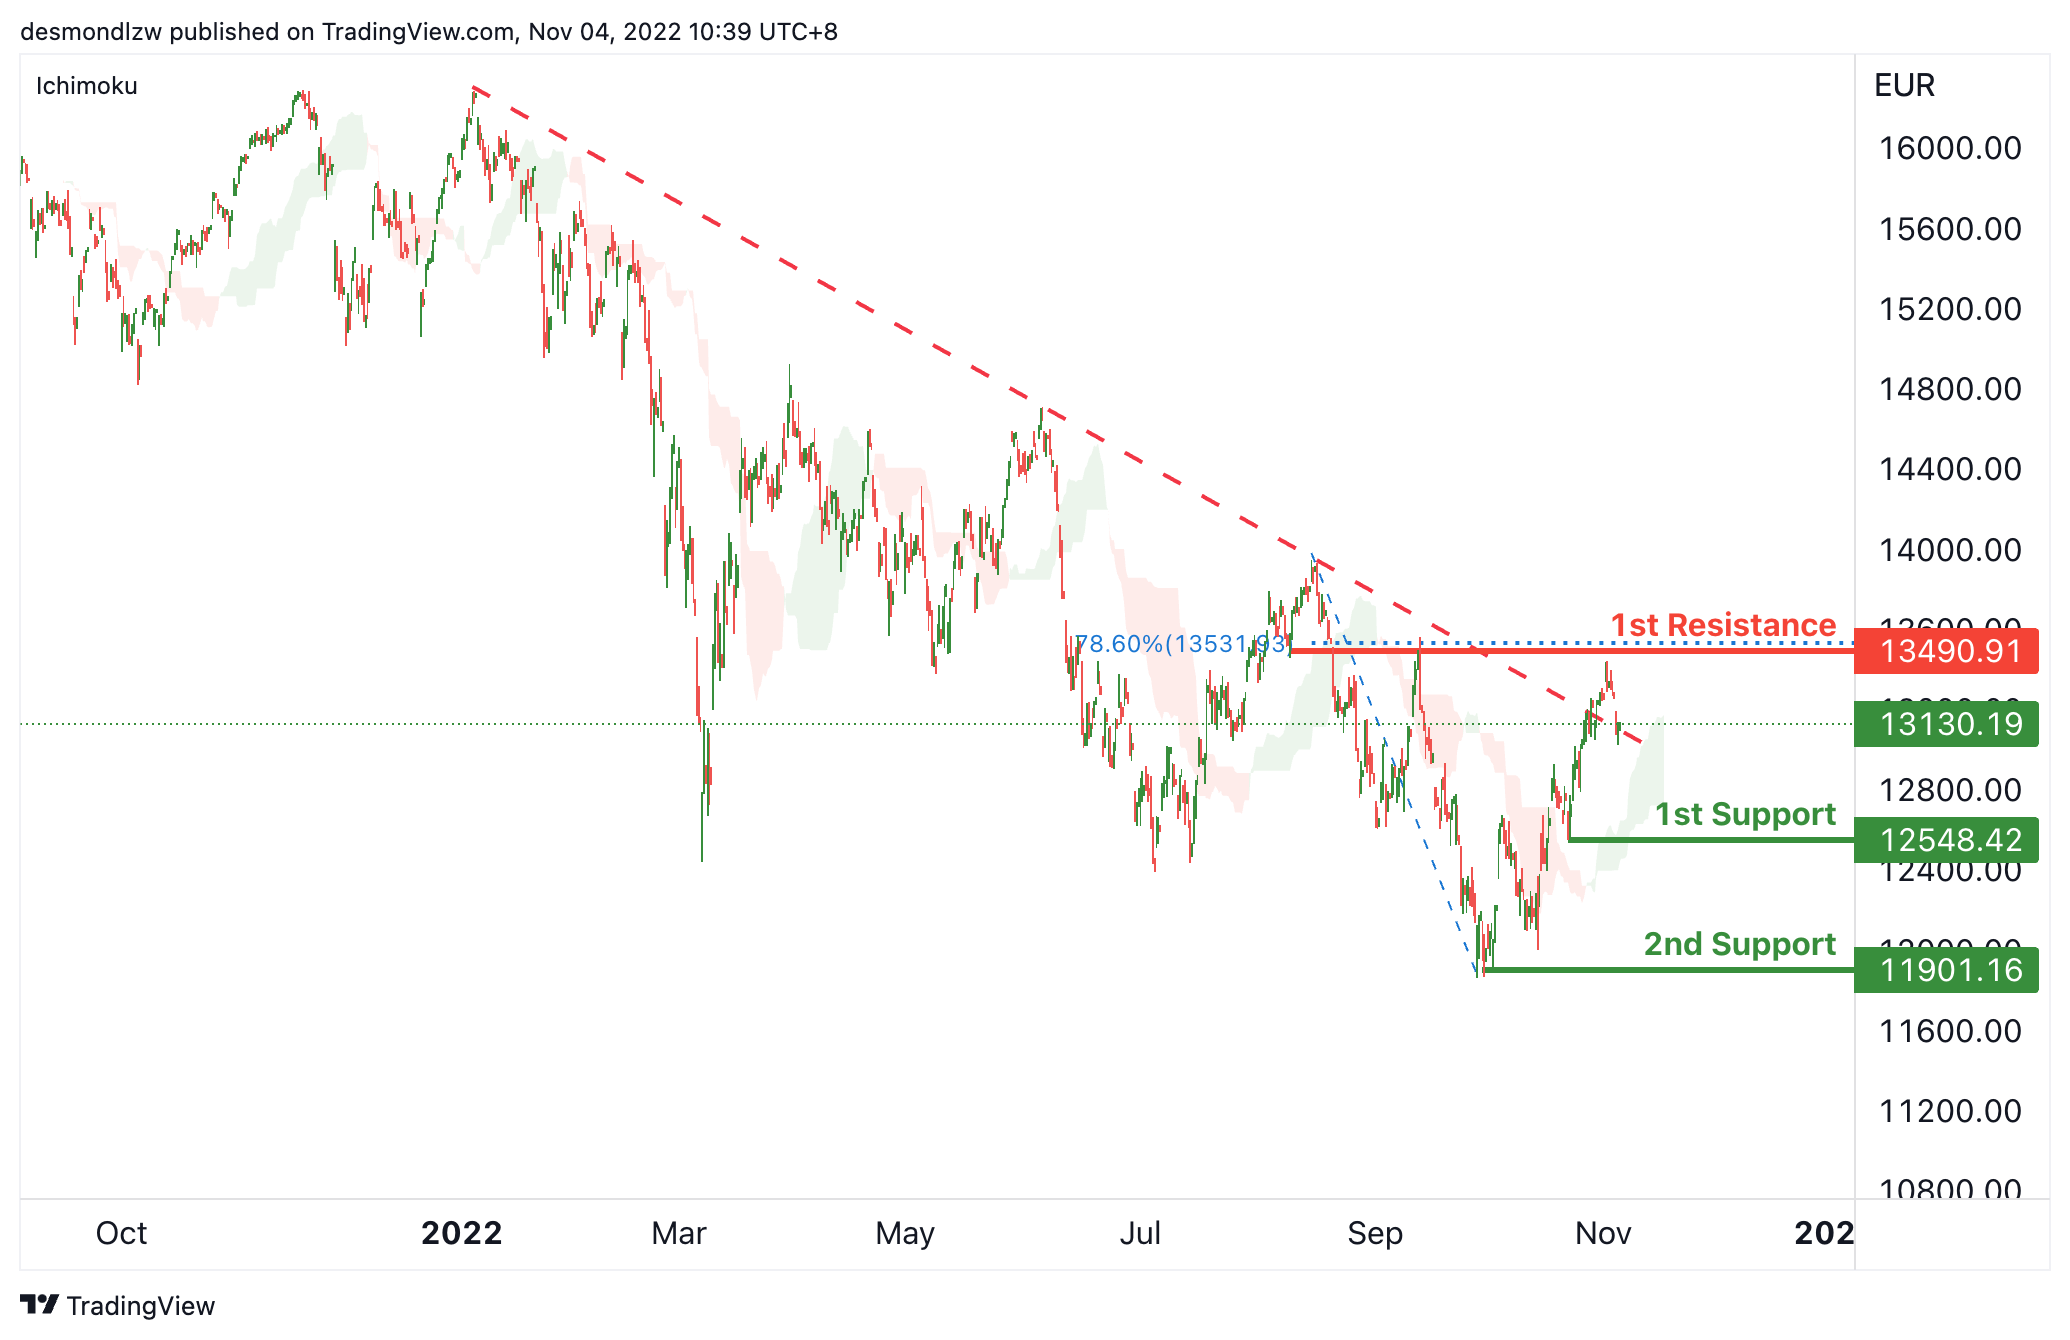
DAX:
On the H4 chart, the price dropped back to the descending trendline. Expecting price to possibly continue this bearish momentum and head towards the 1st support at 12548.42, which is in line with the previous swing low. If the 1st support is broken, the 2nd support is at 11901.16, which is in line with the significant swing low. Alternatively, as the price is above ichimoku cloud, the price may rise to the 1st resistance at 13490.91, where the 78.6% Fibonacci line is located.
Areas of consideration:
- H4 time frame, current price
- H4 time frame, 1st support at 12548.42
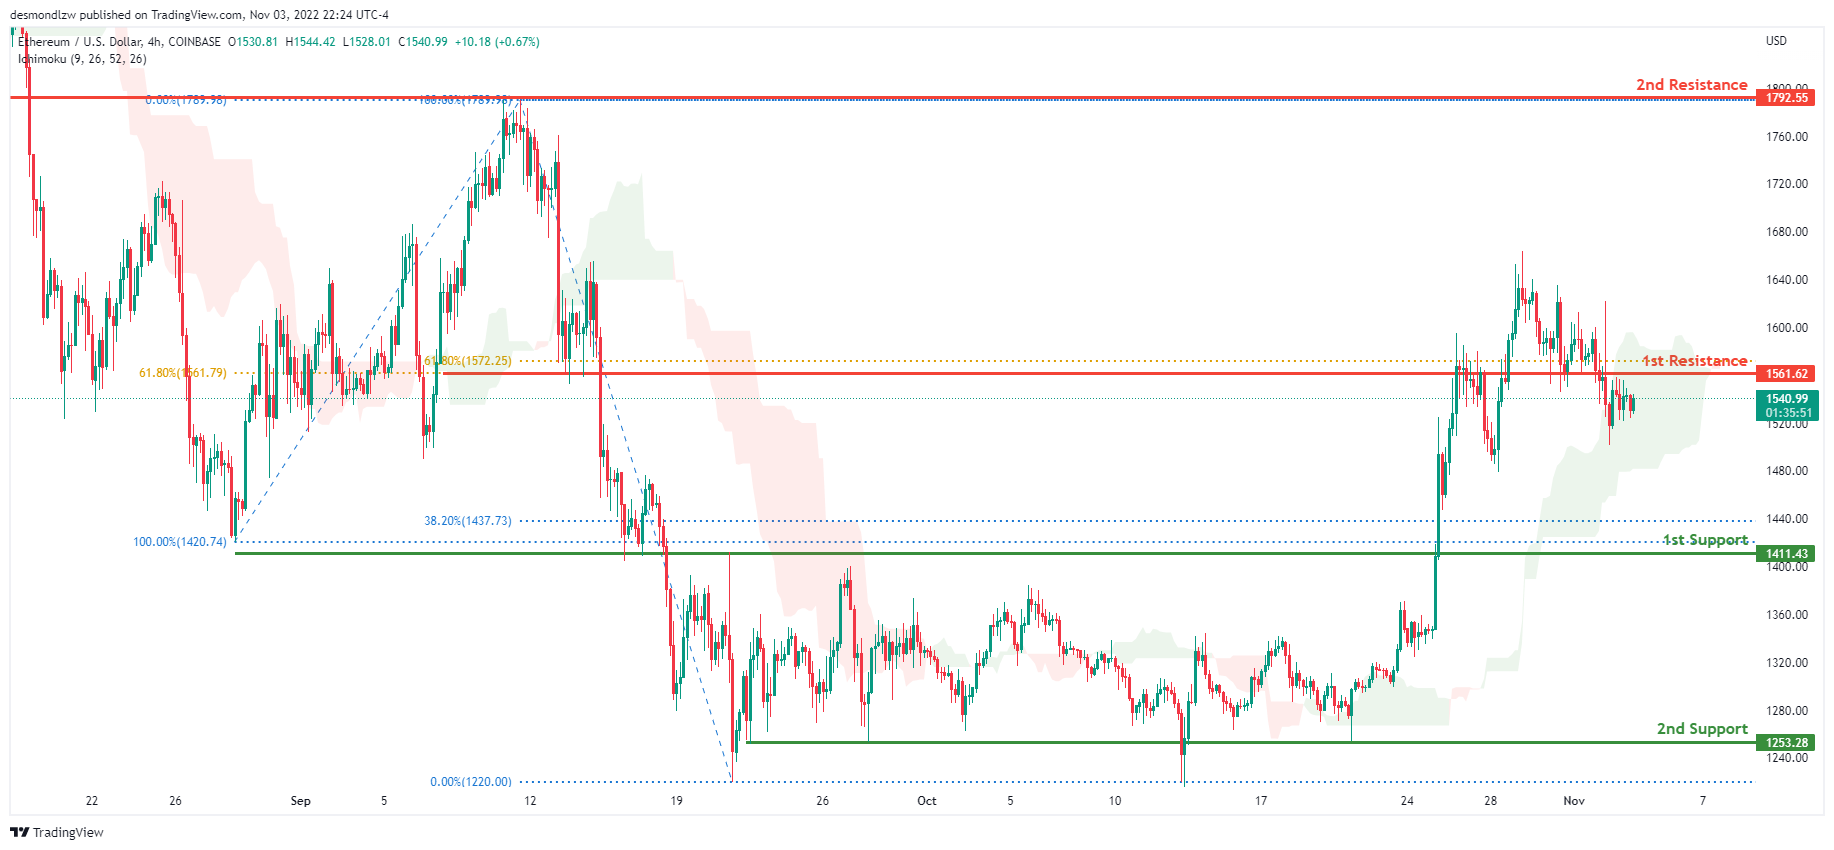
ETHUSD:
Looking at the H4 chart, the current overall bias for ETHUSD is bullish, with price currently within the green Ichimoku cloud. Overnight, price continued to consolidate under the 1st resistance level at 1561.62 where 2 of the 61.8% Fibonacci lines are located. Expecting price to possibly retrace back up and retest the 1st resistance level.
Areas of consideration:
- H4 time frame, 1st resistance of 1561.62
- H4 time frame, 1st support at 1411.43
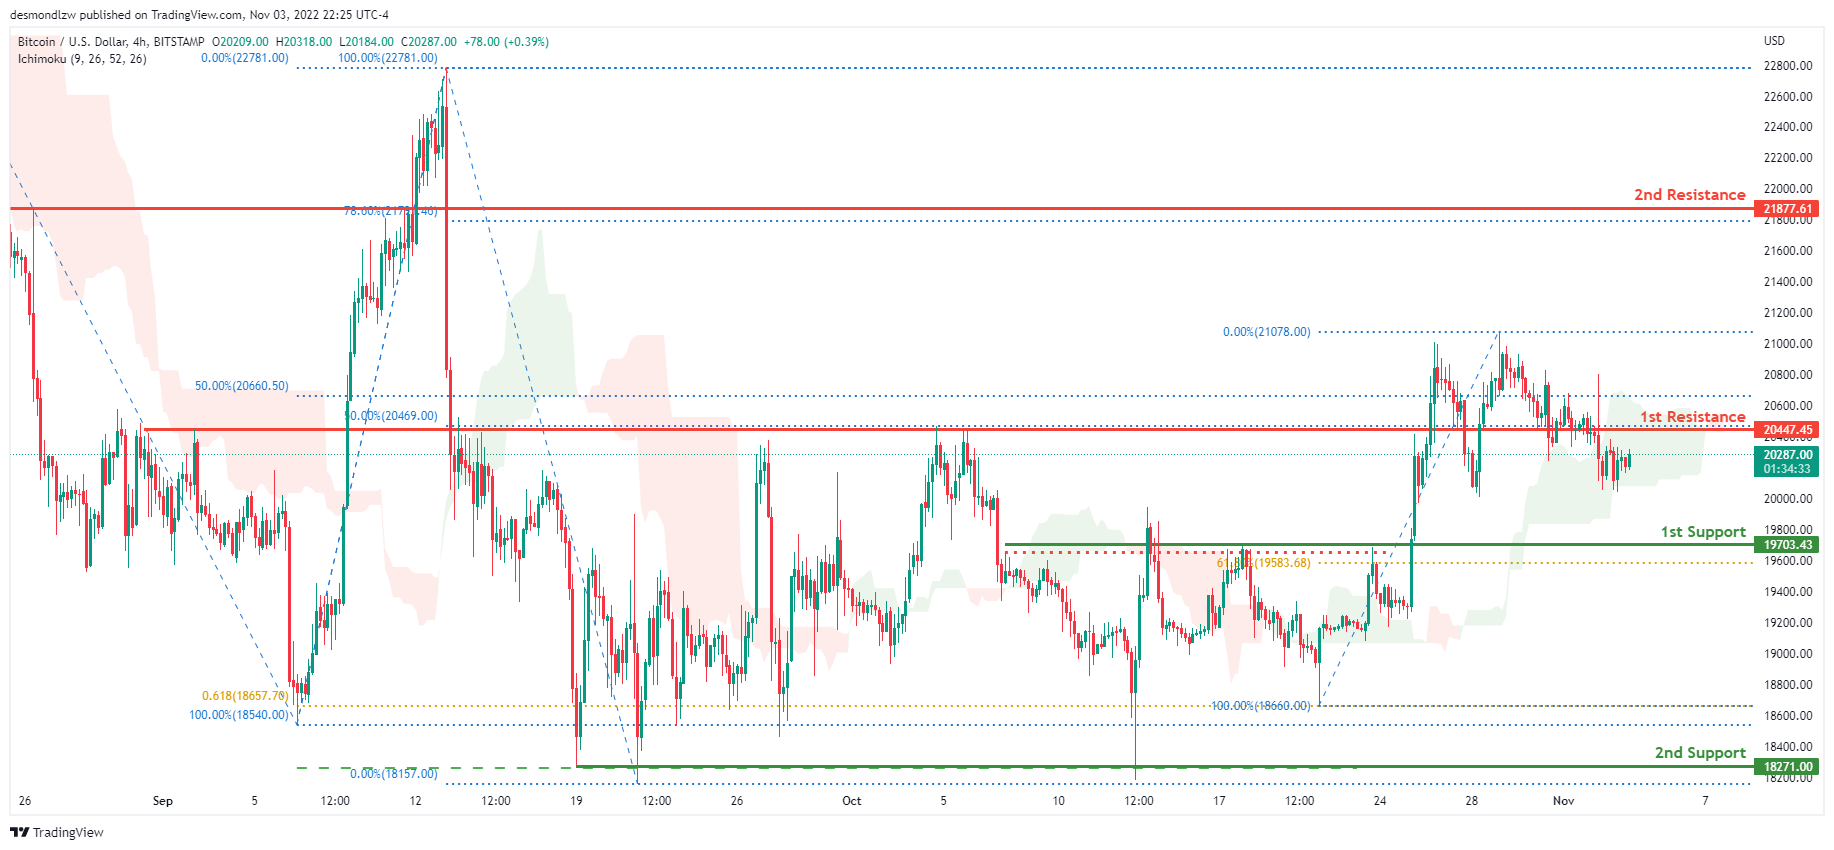
BTCUSD:
Overnight, the price continued to consolidate under the 1st resistance 20447.45 where the 2 of the 50% Fibonacci lines are located. With the price crossing the Ichimoku cloud and resting on the bullish trend line. We can expect price to continue bearish towards the 1st support level at 19703.43 where the 61.8% Fibonacci line is located.
Areas of consideration:
- H4 time frame, 1st resistance 20447.45
- H4 time frame, 1st support at 19703.43
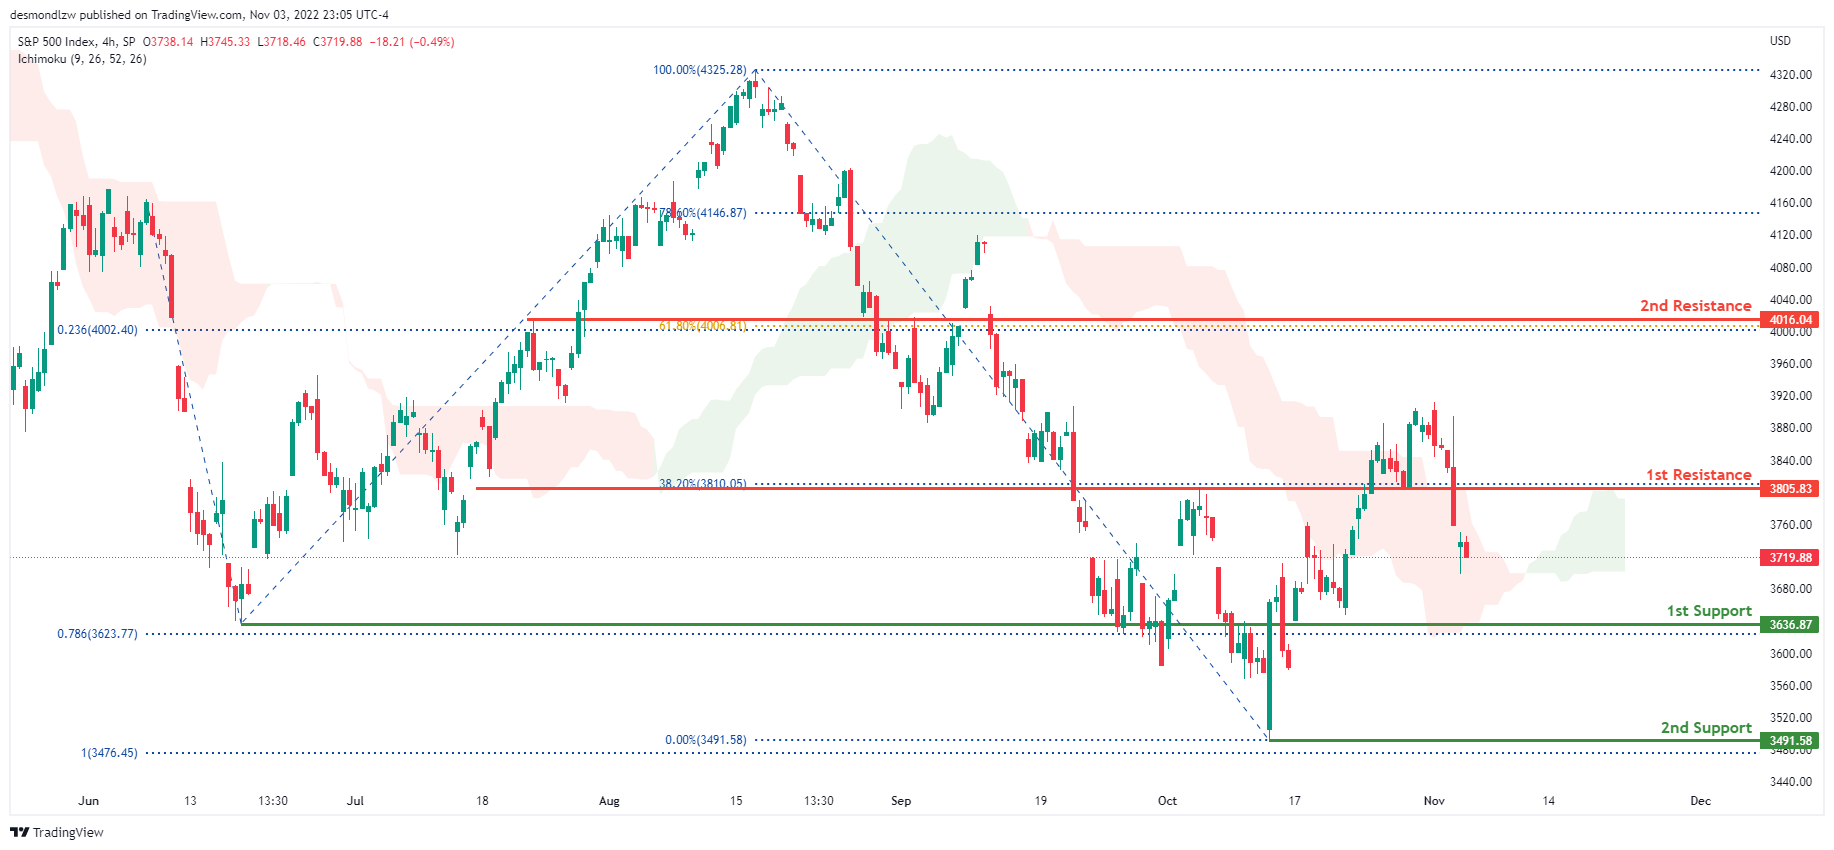
S&P 500:
On the H4 chart, the overall bias for S&P500 is bearish . Overnight, price continued its bearish momentum with price closing under the 1st resistance at 3805.83 where the 38.2% Fibonacci line is located. The price is currently trading at 3719.88 at time of writing. If this bearish momentum continues, expect price to possibly head towards the 1st support at 3636.87 where the previous swing low and 78.6% Fibonacci projection line is located.
Areas of consideration:
- H4 time frame, 1st support at 3636.87
- H4 time frame, 1st resistance at 3805.83


