
USD/JPY:
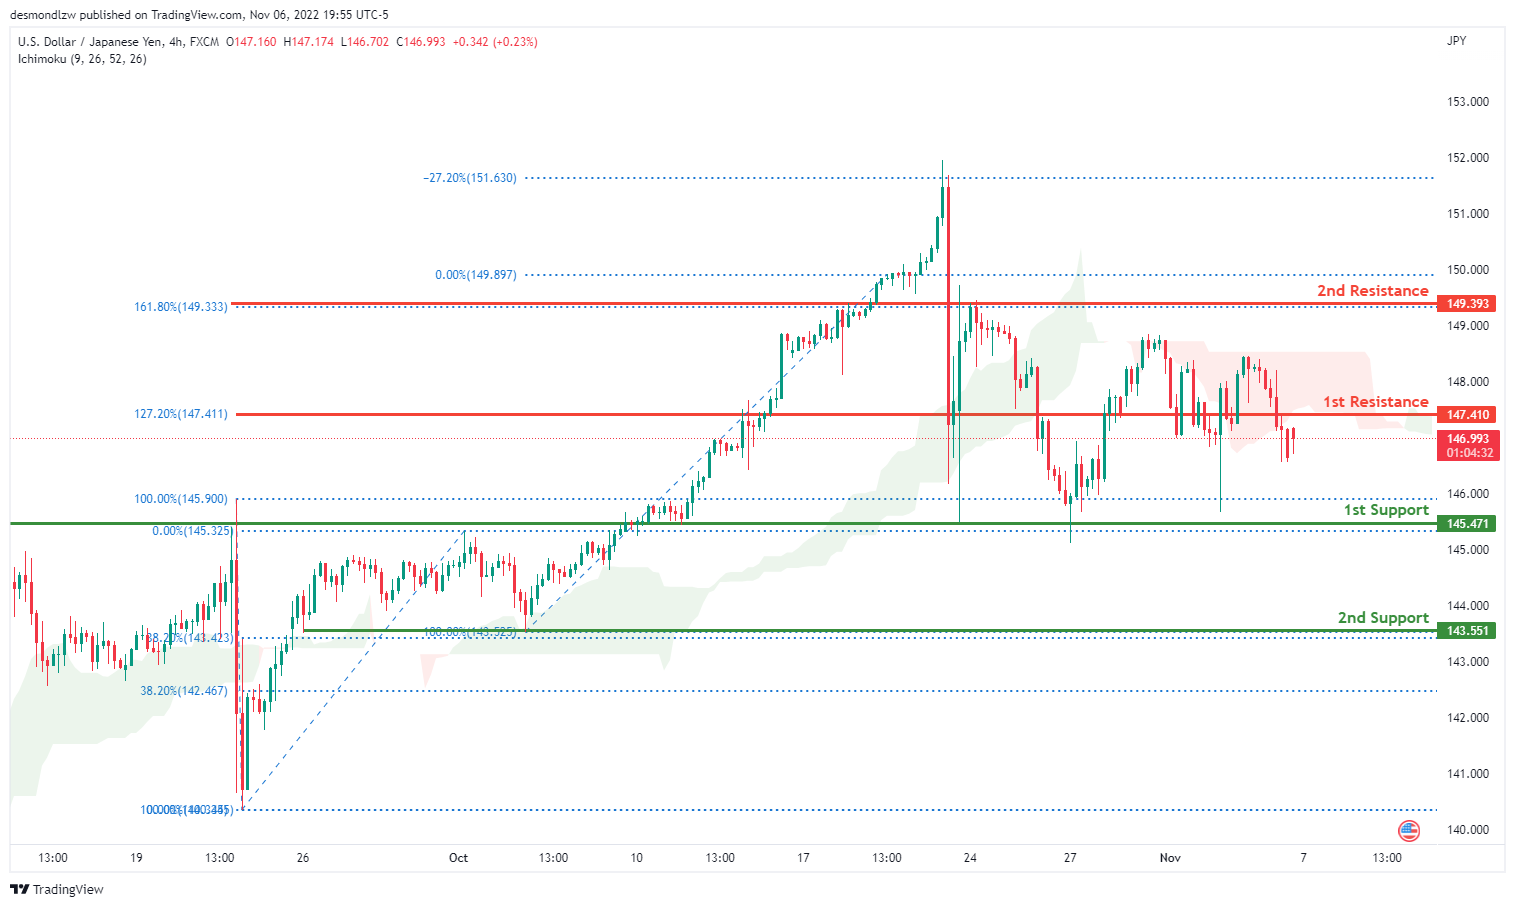
The current general bias for USDJPY on the H4 chart is bearish. To add confluence to this, the price is below the Ichimoku cloud which indicates a bearish market. Towards the end of last week, USDJPY experienced some bearish momentum due to the NFP data release with the price closing above the 1st resistance line at 147.410 where the 127.2% Fibonacci extension line is located. Price is currently trading at 147.005 at time of writing. If the bearish momentum continues, expect USDJPY to possibly head towards the 1st support line at 145.471, where the 100% and 0% Fibonacci lines are located. In an alternative scenario, price could break above the 1st resistance and head towards the 2nd resistance at 149.393 where the 161.8% and 0% Fibonacci lines are located.
Areas of consideration:
- H4 time frame, 1st resistance at 147.410
- H4 time frame, 1st resistance at 149.393
- H4 time frame, 1st support at 145.471
DXY:
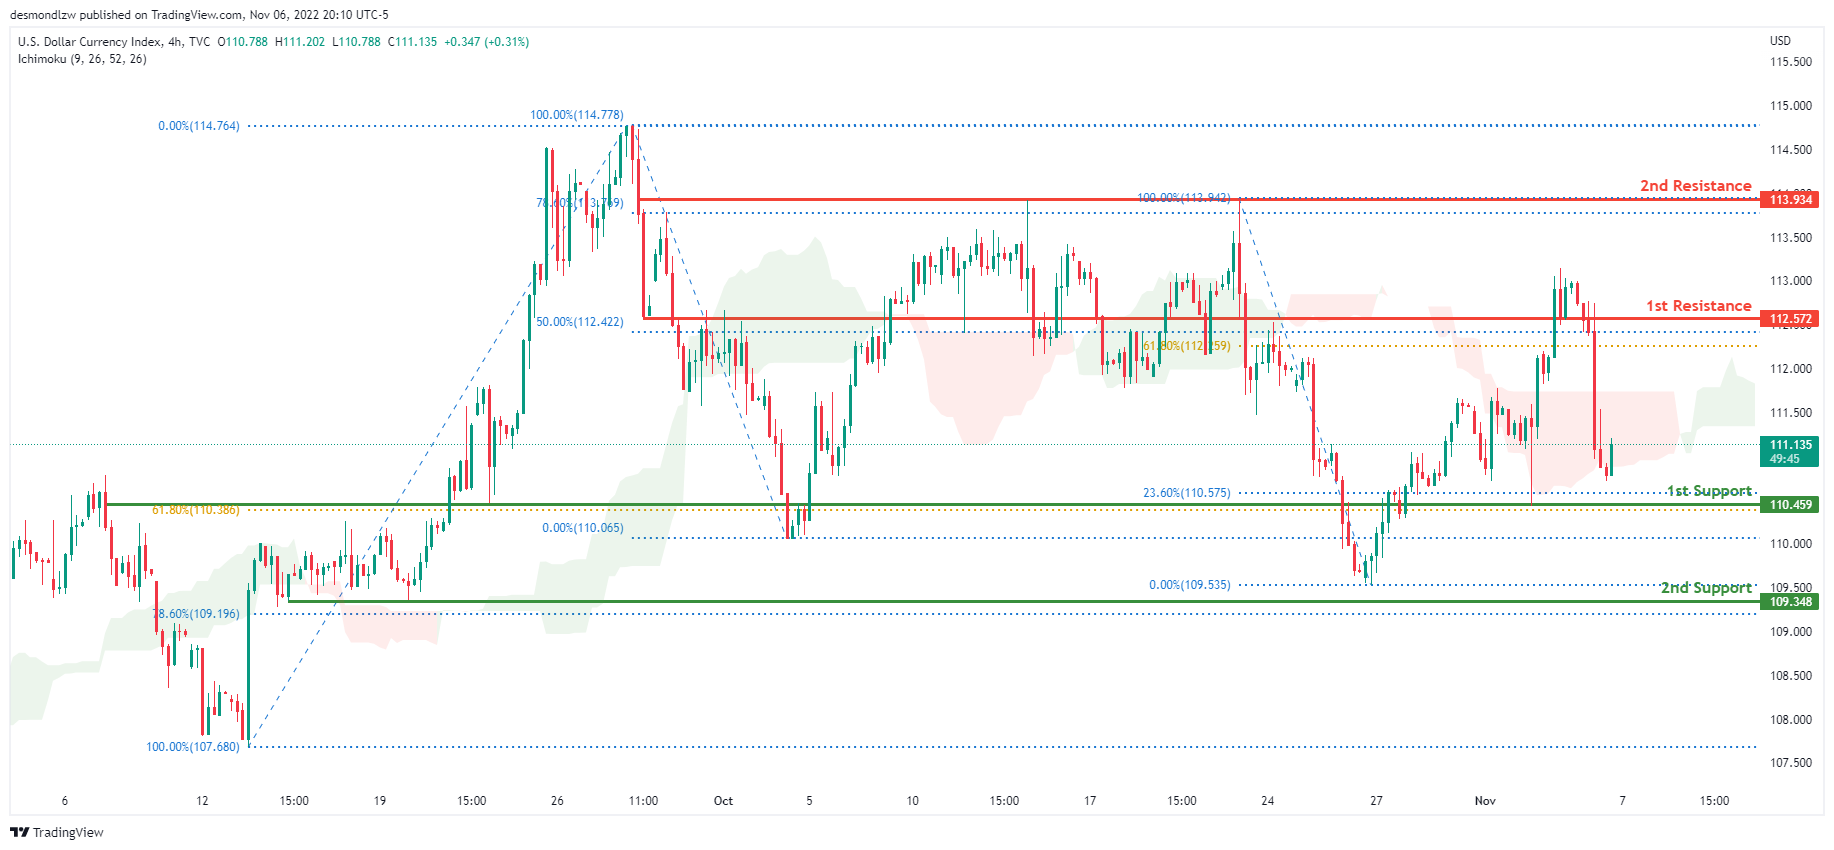
On the H4 chart, the overall bias for DXY is bearish. To add confluence to this, the price is crossing below the Ichimoku cloud which indicates a bearish market. Towards the end of last week, price had huge bearish momentum due to the release of the NFP data. The price is currently trading at 111.140 at the time of writing. If this bearish momentum continues, price could head towards the 1st support line at 110.459 where the 61.8% and 23.6% Fibonacci lines are located. In an alternative scenario, price could head back up towards the 1st resistance line at 112.572 where the 50% and 61.8% Fibonacci lines are located.
Areas of consideration:
- H4 time frame, 1st resistance at 112.572
- H4 time frame, 1st support at 110.459
EUR/USD:
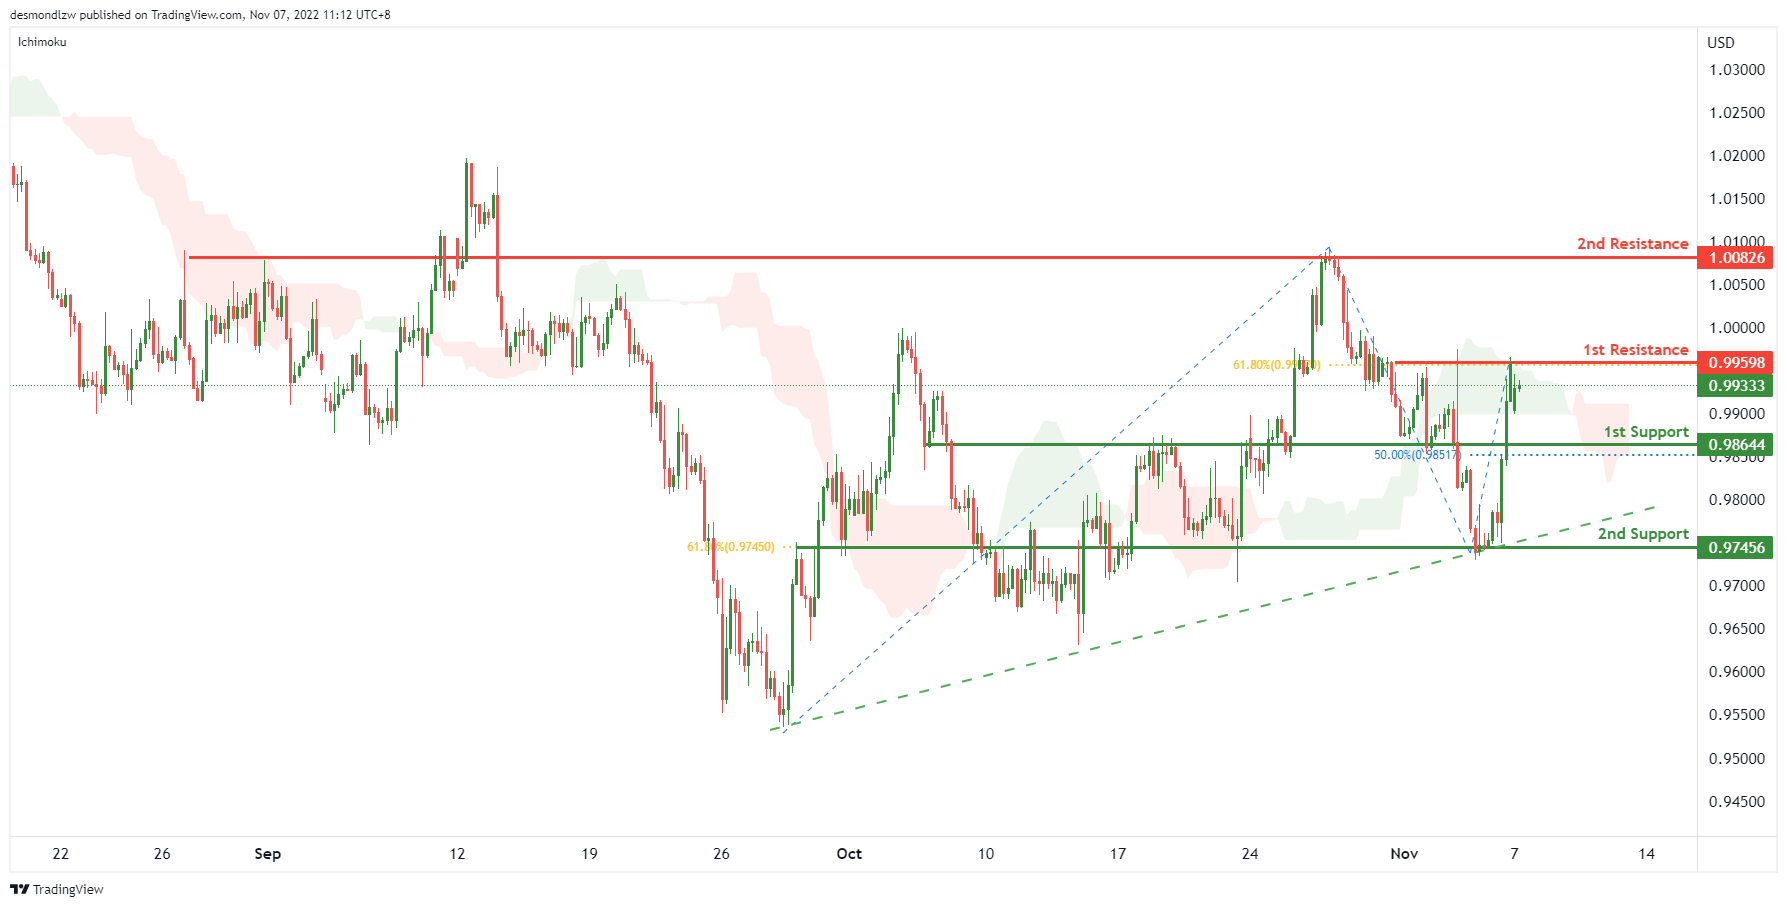
On the H4, with the price moving above the ascending trendline and above ichimoku cloud, we have a bullish bias that the price may break the 1st resistance at 0.99598, which is in line with the 61.8% fibonacci retracement and rise to the 2nd resistance at 1.00826, where the previous swing highs are. Alternatively, the price may drop to the 1st support at 0.98644, which is in line with the 50% fibonacci retracement and overlap support. If the 1st support is broken, the 2nd support is at 0.97456, which is in line with the swing low and 61.8% fibonacci
Areas of consideration :
- H4 1st support at 0.97456
- H4 2nd support is 0.96484,
GBP/USD:
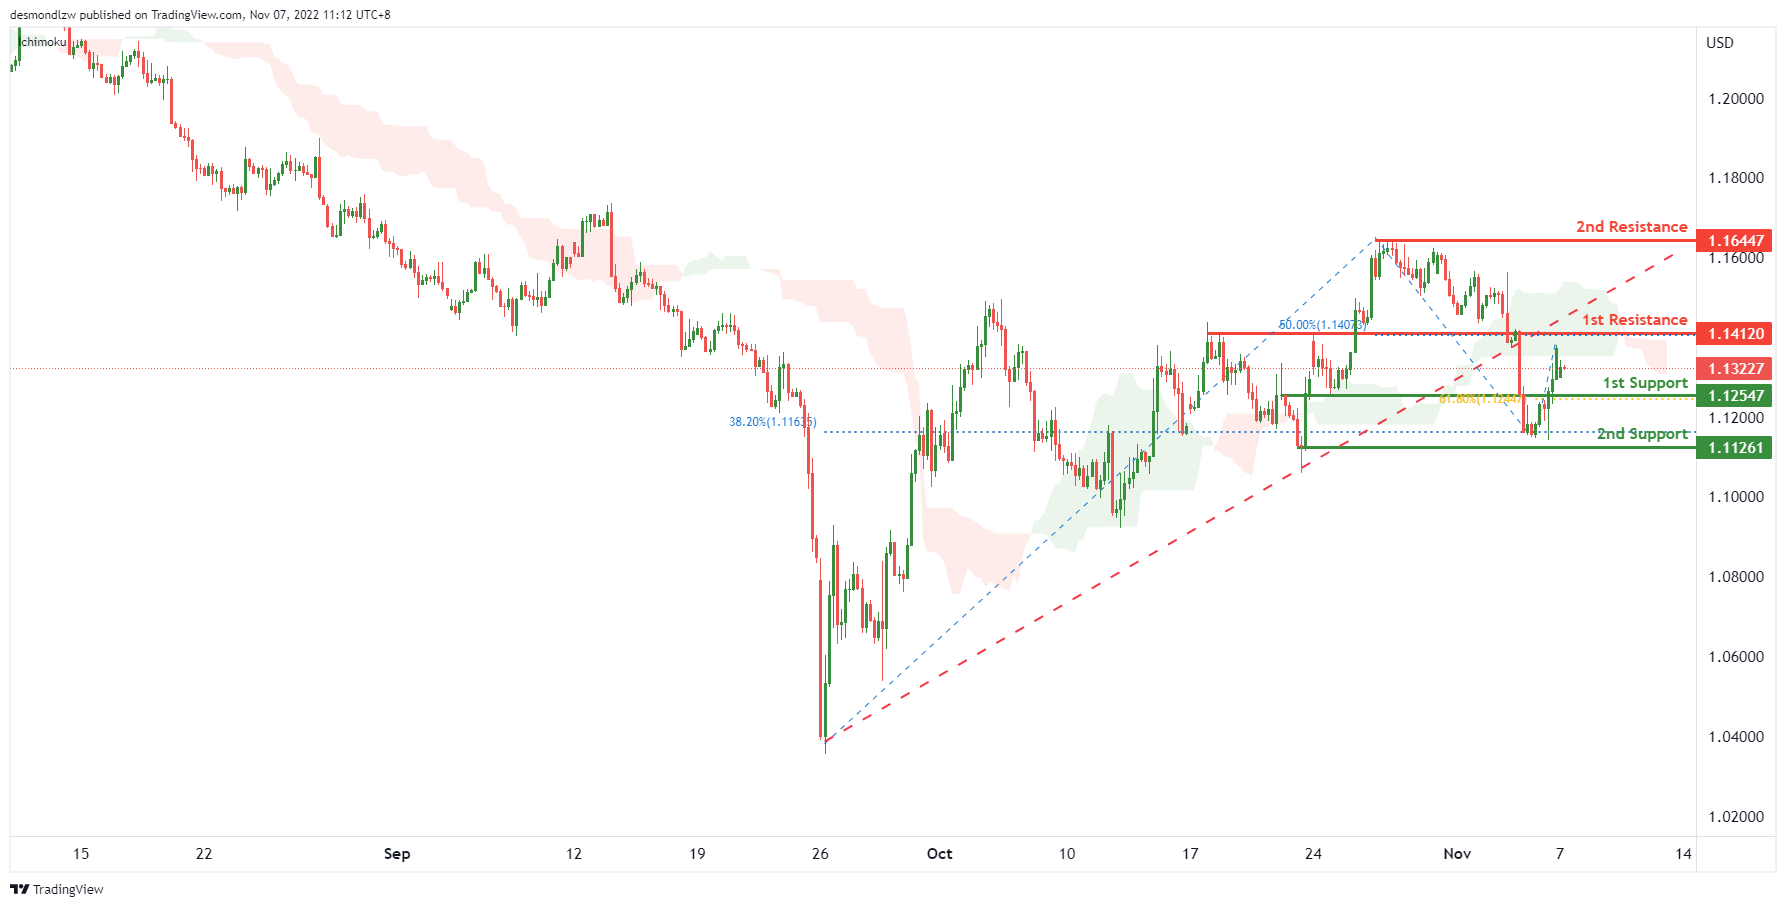
On the H4, price is below the ichimoku cloud and breaking the ascending trendline, we have a bearish bias that the price may rise to test the 1st resistance at 1.14120, which is in line with the 50% fibonacci retracement and overlap resistance and drop to the 1st support at 1.12547, which is in line with the 61.8% fibonacci retracement. If the 1st support is broken, the 2nd support is at 1.11261, where the swing low is. Alternatively, the price may break the 1st resistance and rise to the 2nd resistance at 1.16447, which is in line with the swing high.
Areas of consideration:
- H4 1st resistance at 1.14120
- H4 1st support at 1.12547
USD/CHF:
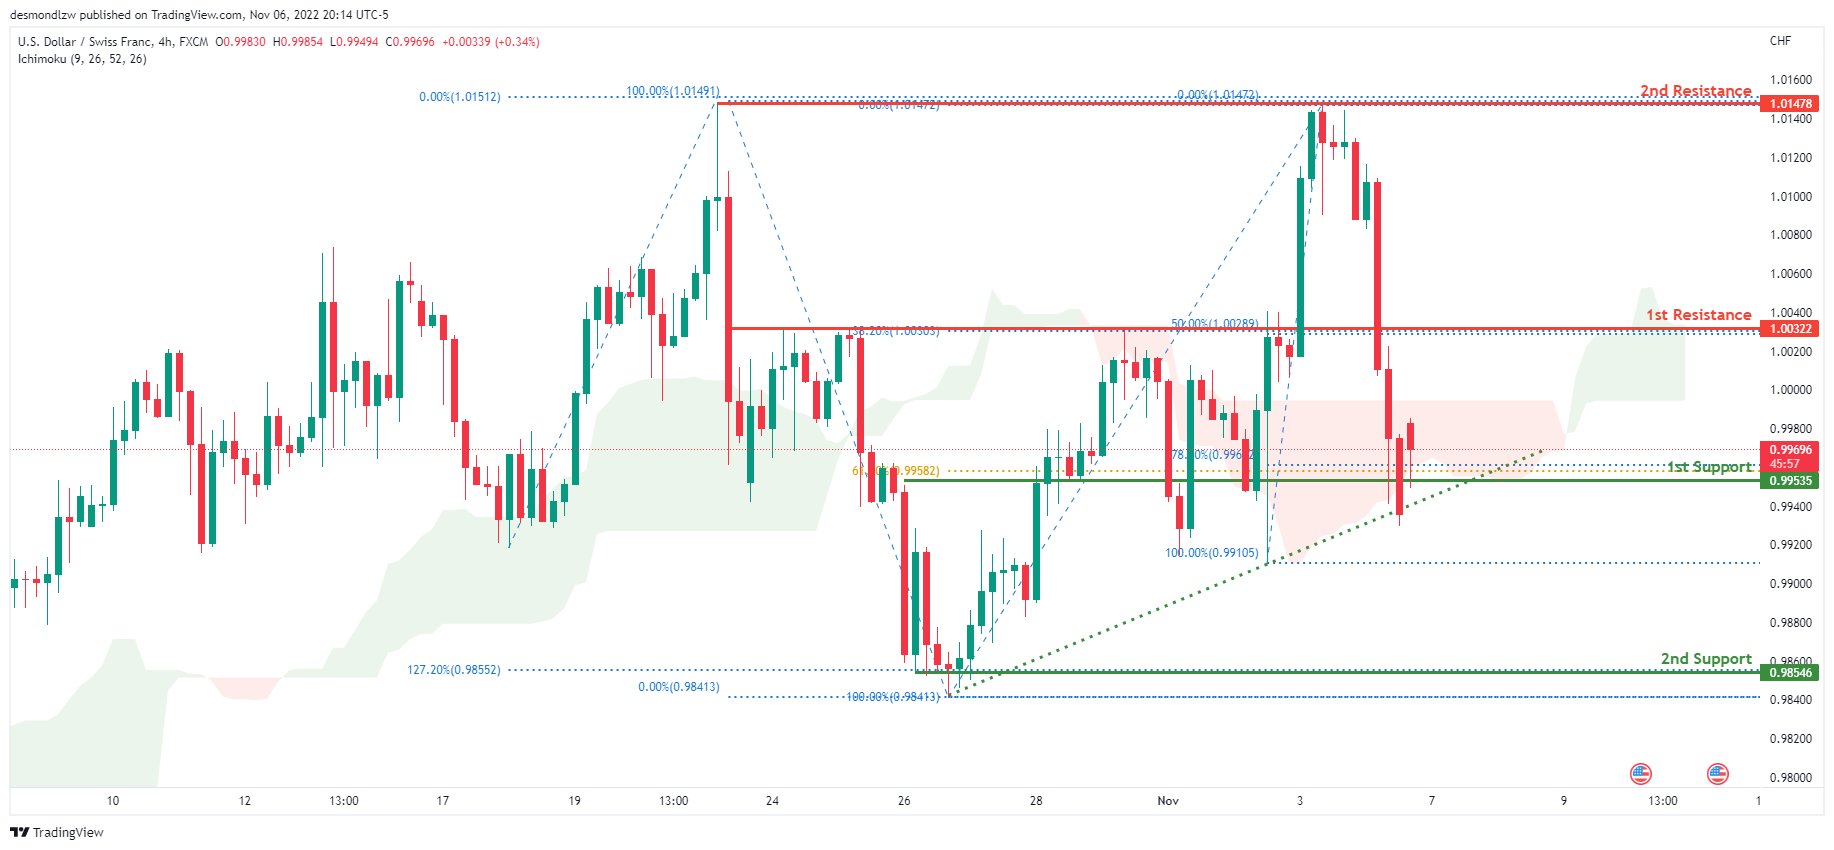
On the H4 chart, the overall bias for USDCHF is bearish. To add confluence to this, the price is below the Ichimoku cloud which indicates a bearish market. Towards the end of last week, price had huge bearish momentum downwards due to the release of the NFP data. The price is currently trading at 0.99716 at the time of writing. If this bearish momentum continues, expect price to break the 1st support line at 0.99535 where the 61.8% and 78.6% Fibonacci lines are located and head towards the 2nd support line at 0.98546, where the 127.2% Fibonacci extension line, 100% Fibonacci line and previous swing low are located. In an alternative scenario, price could head back up towards the 1st resistance line at 1.00322, where the 382% and 50% Fibonacci lines are located.
Areas of consideration
- H4 1st support at 0.99535
- H4 2nd support at 0.98546
- H4 1st resistance at 1.00322
XAU/USD (GOLD):
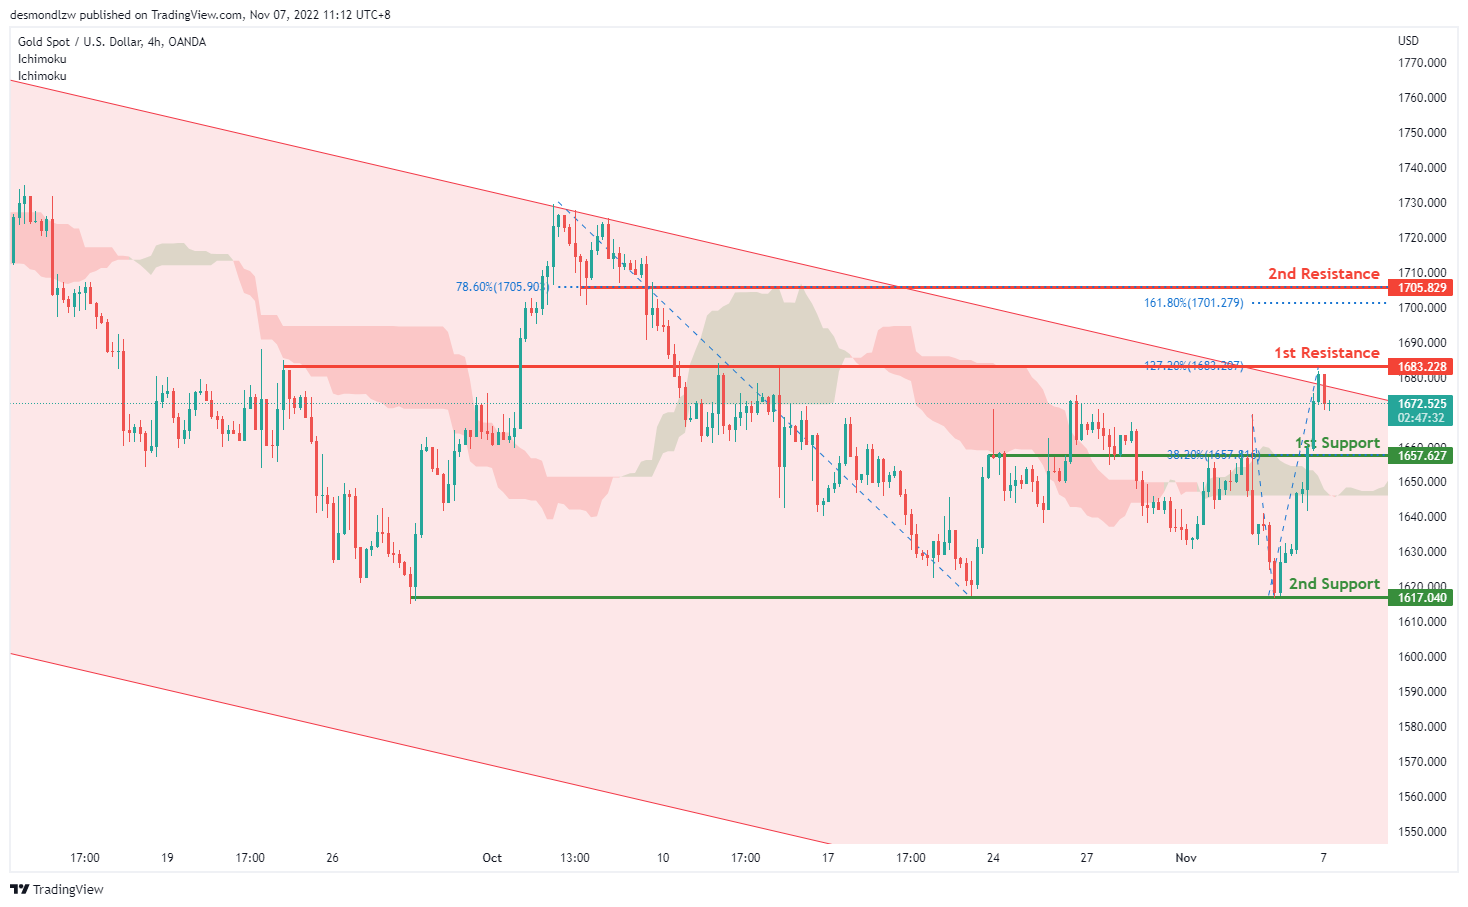
On H4, with the price breaking the descending channel and reversing from the 1st resistance, we can expect the price to drop to the 1st support at 1657.627, which is in line with the overlap support and 38.2% fibonacci retracement. If the 1st support is broken, we can expect the price drop to the 2nd support at 1617.040, where the previous swing lows are. Alternatively, the price may rise to retest the 1st resistance at 1683.228, which is in line with the previous swing high and 127.2% fibonacci extension. If the 1st resistance is broken, we can expect the bullish momentum to carry the price to the 2nd resistance at 1705.829, where the 78.6% fibonacci retracement and 161.8% fibonacci extension sit.
Areas of consideration:
- H4 time frame, 1st resistance at 1683.228
- H4 time frame, 1st support at 1657.627
AUD/USD:
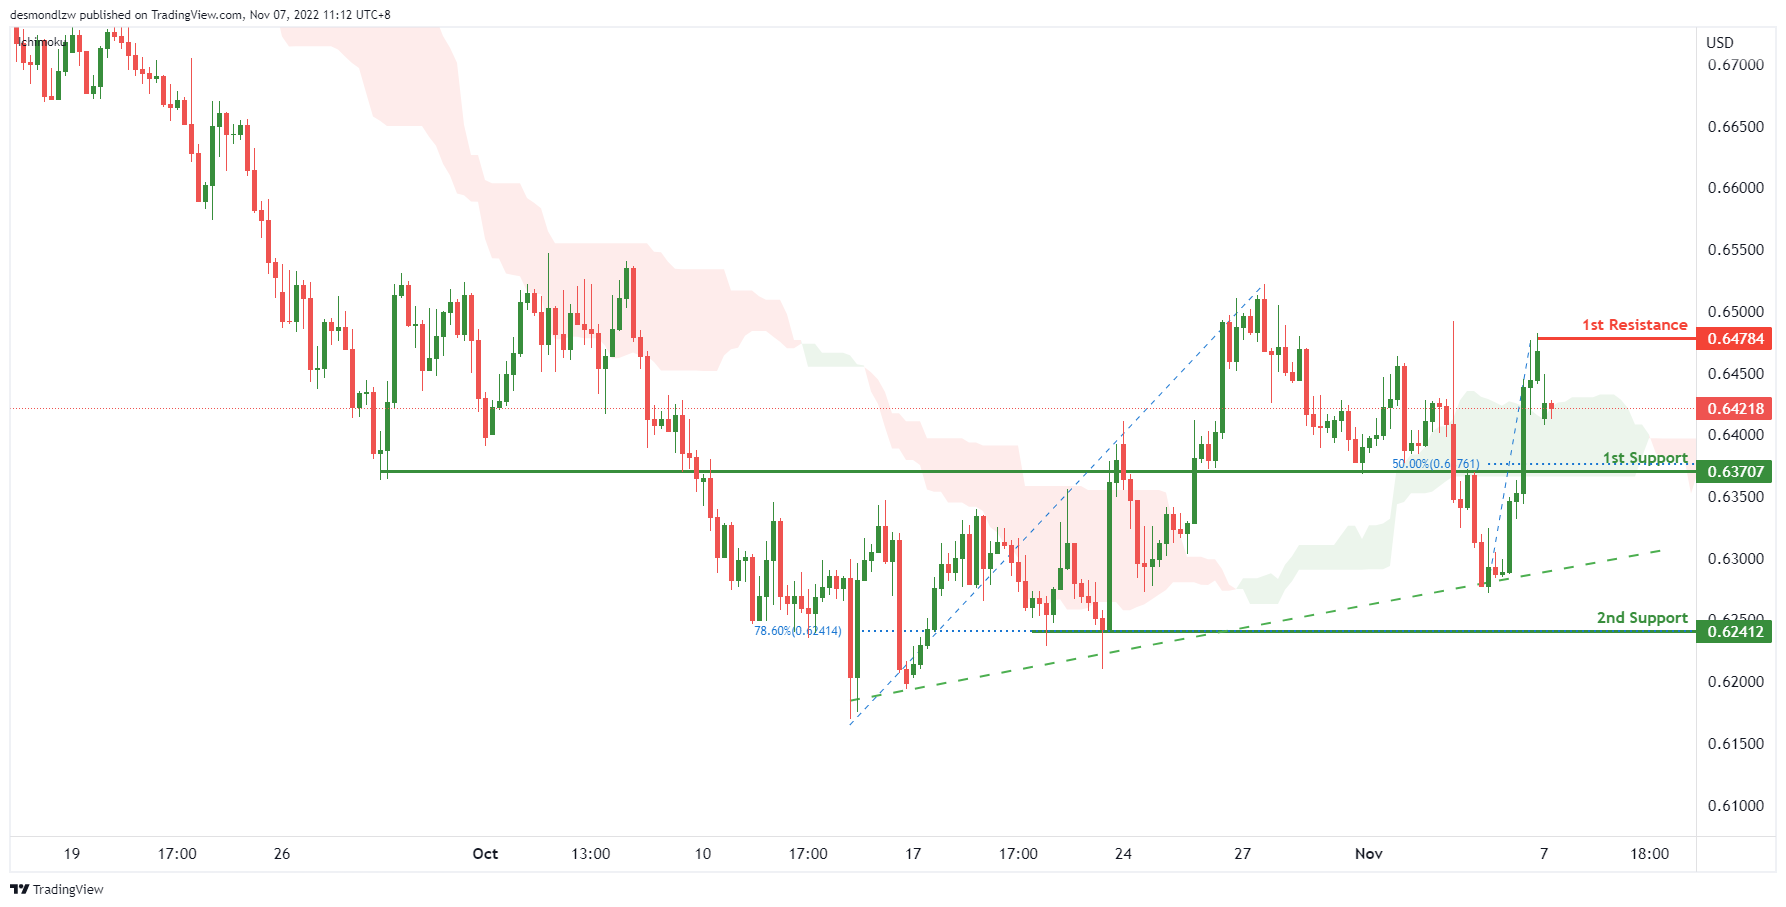
On the H4, with the price crossing the ichimoku cloud and moving above the ascending trendline, we can expect the price to rise to the 1st resistance at 0.64784, which is in line with the swing high. After testing the swing high, the price may reverse and drop to the 1st support at 0.63707, which is in line with the 50% fibonacci retracement and overlap support. If the 1st support is broken, the 2nd support is at 0.62412, where the 778.6% fibonacci retracement is.
Areas of consideration
- H4, 1st resistance at 0.64784
- H4, 1st support at 0.63707
NZD/USD:
On the H4 chart, as the price is moving above ichimoku cloud and ascending trendline, the price may rise to the 1st resistance at 0.59358, which is in line with the swing highs. If the 1st resistance is broken, the 2nd resistance is at 0.59997, which is in line with the 127.2% fibonacci extension. Alternatively, the price may drop to the 1st support at 0.57426, which is in line with the swing low and 50% fibonacci retracement. If the 1st support is broken, the 2nd support is at 0.56014, which is in line with the 78.6% fibonacci retracement.
Areas of consideration:
- H4 time frame, 1st resistance at 0.59358
- H4 time frame, 2nd resistance at 0.59997

USD/CAD:
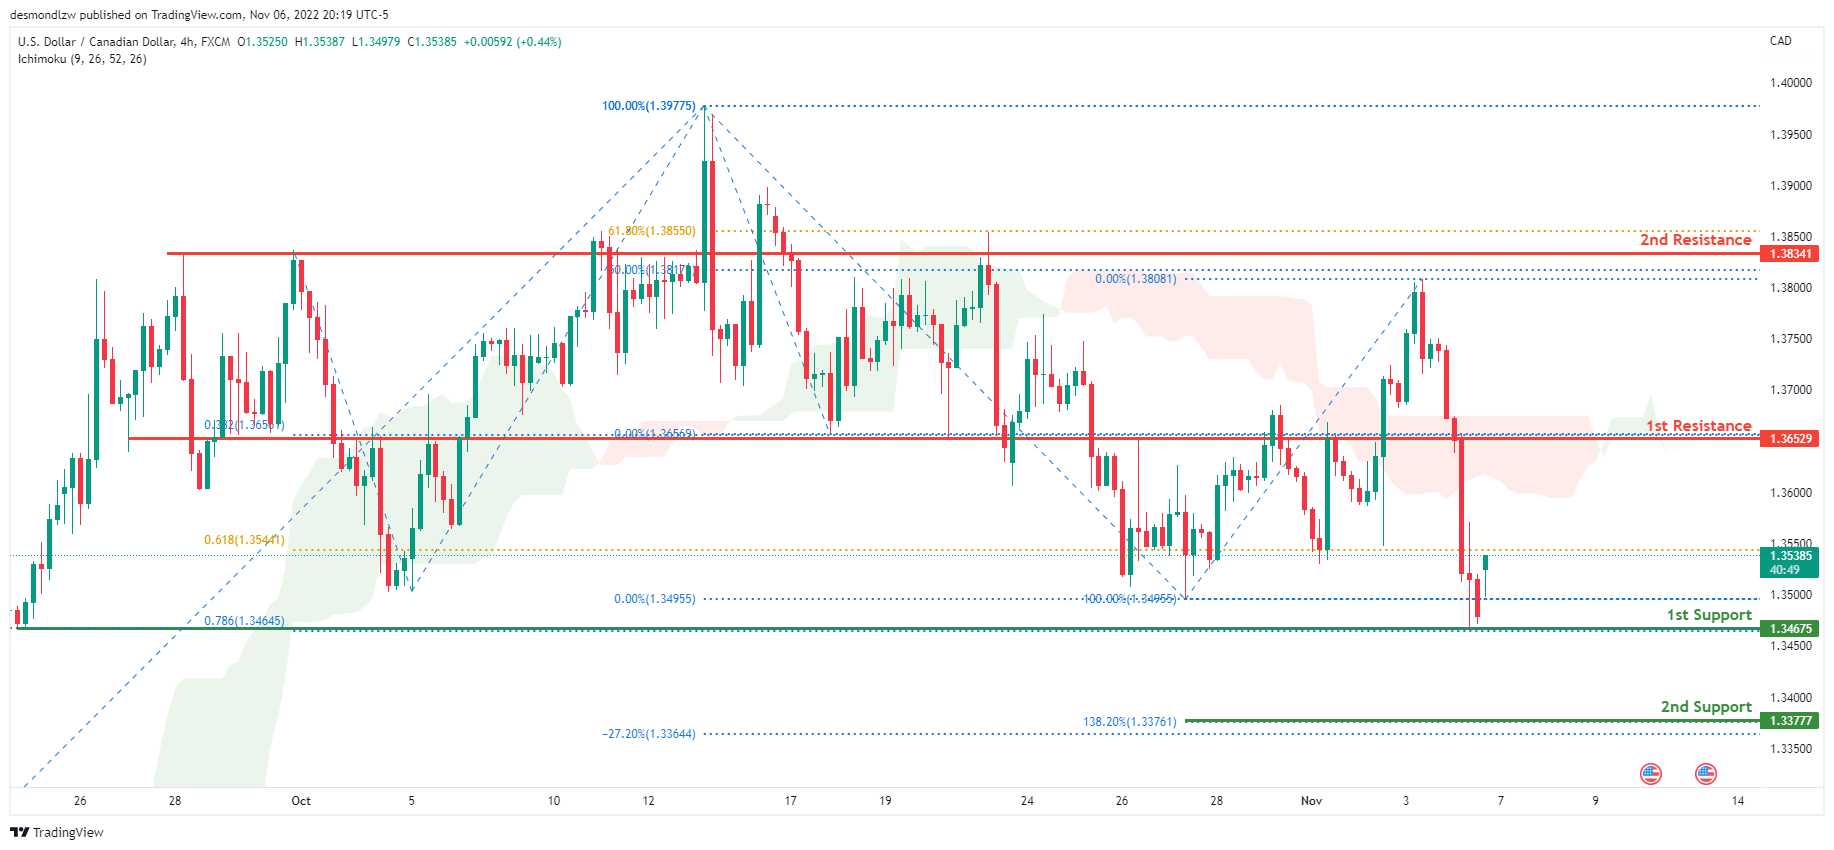
On the H4 chart, the overall bias for USDCAD is bearish. To add confluence to this, the price is below the Ichimoku cloud which indicates a bearish market. Towards the end of last week, the price had huge bearish momentum downwards due to the release of the NFP data. The price is currently trading at 1.35390 at the time of writing. If this bearish momentum continues, expect the price to head back down towards the 1st support line at 1.34675 where the 78.6% Fibonacci projection line and previous low is located. In an alternative scenario, price could head back up towards the 1st resistance line at 1.36529, where the 38.2% Fibonacci projection line is located.
Areas of consideration:
- H4 time frame, 1st resistance at 1.36529
- H4 time frame, 1st support at 1.34675
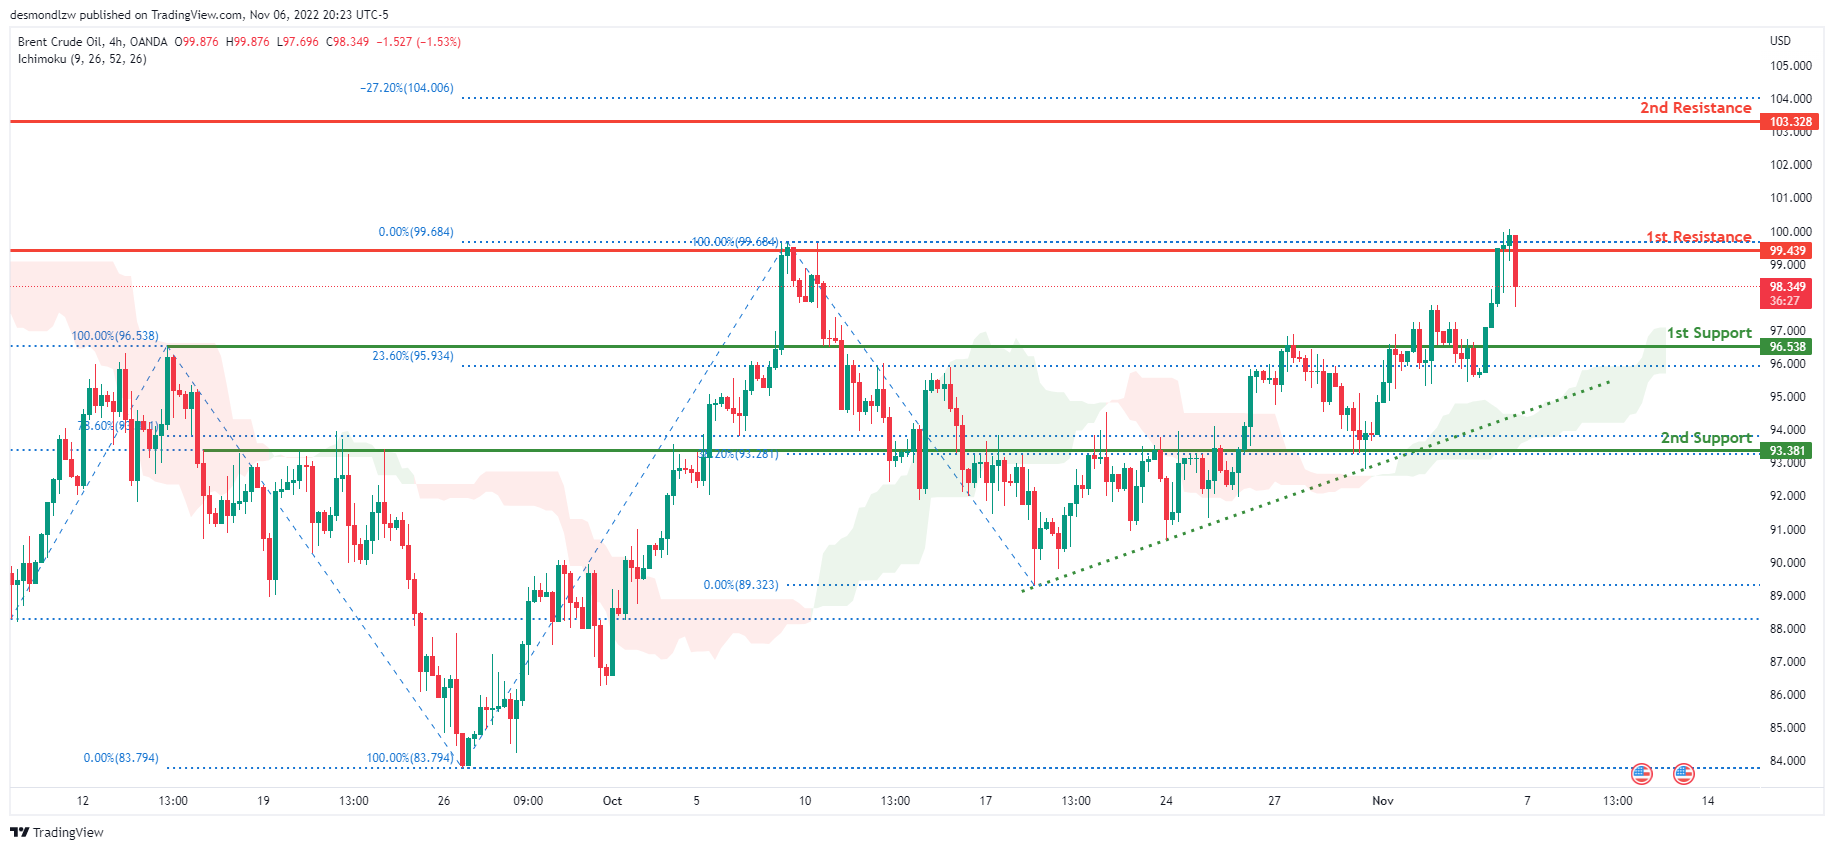
OIL:
Looking at the H4 chart, the current overall bias for Oil is bullish. To add confluence to this, the price is above the Ichimoku cloud which indicates a bullish market. Towards the end of last week, price had bullish momentum due to the release of the NFP data. The price is currently trading at 98.455 at the time of writing. If this bullish momentum continues, expect price to possibly head back up towards the 1st resistance at 99.439 where previous swing high and 0% Fibonacci line is located. In an alternative scenario, price could head back down to the 1st support level at 96.538 where the 23.6% and 100% Fibonacci lines are located.
Areas of consideration:
- H4 time frame, 1st resistance at 99.439
- H4 time frame, 1st support at 96.538
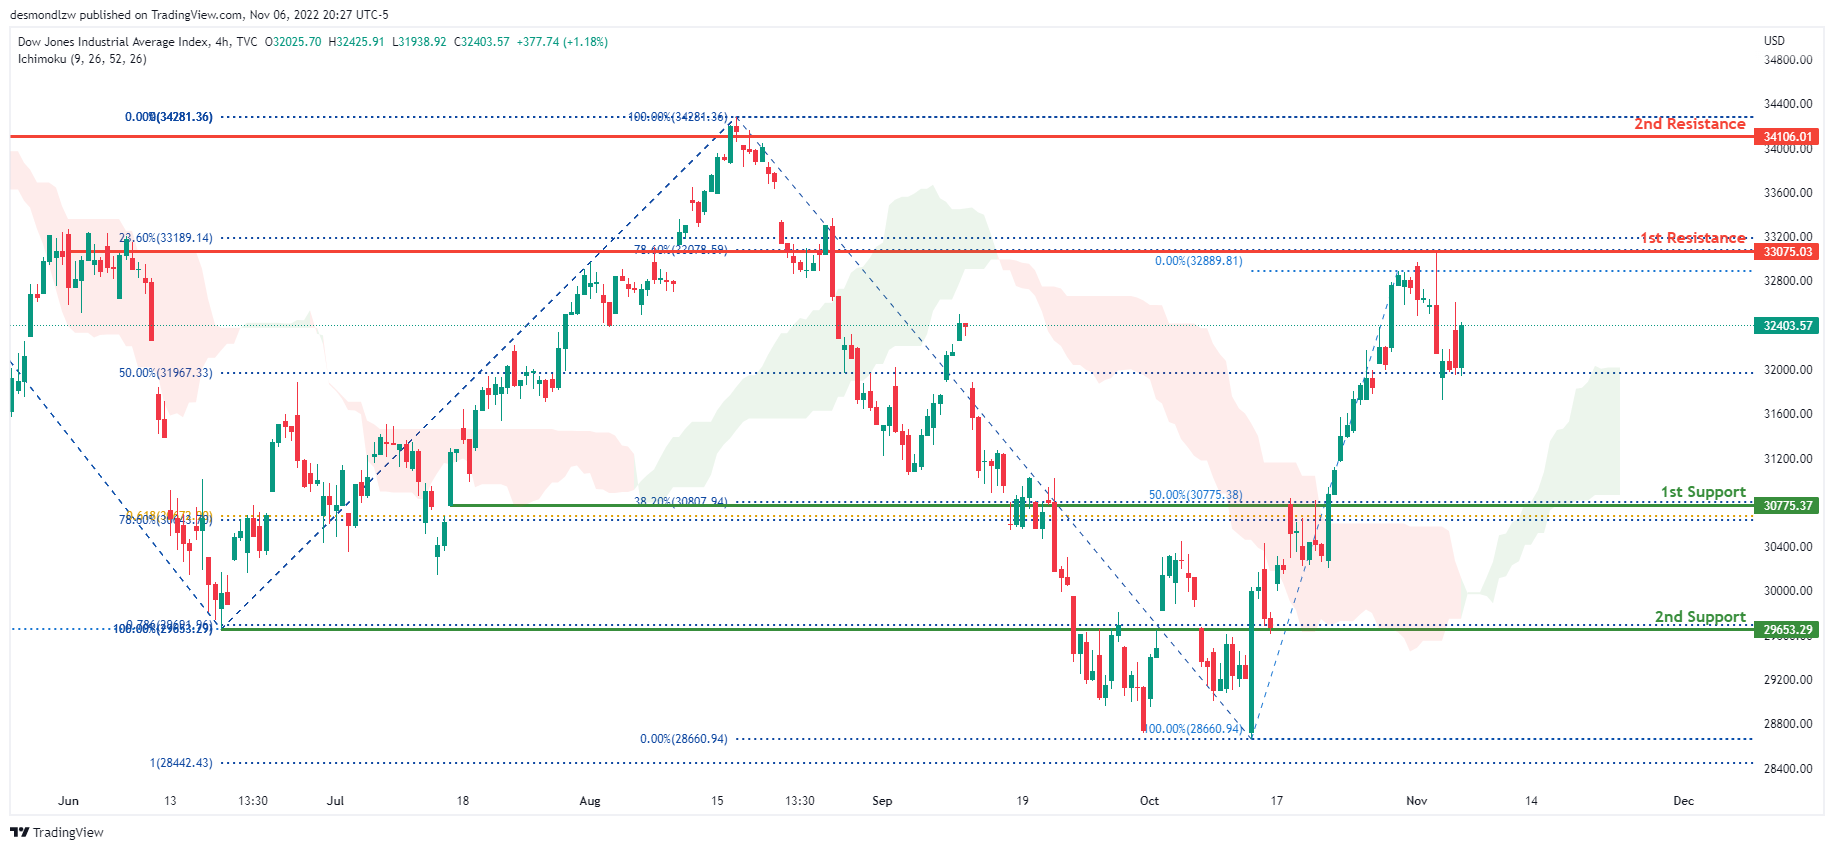
Dow Jones Industrial Average:
On the H4 chart, the overall bias for DJI is bullish. To add confluence to this, the price is above the Ichimoku cloud which indicates a bullish market. Towards the end of last week, it continued its bearish momentum downwards due to the release of the NFP data. The price is currently trading at 32403.57 at time of writing. If this bullish momentum continues, expect the price to possibly head towards the 1st resistance at 33272.34 where the 23.6% and 78.6% Fibonacci lines are located. In an alternative scenario, price could head towards the 1st support line at 30775.37, where the 38.2% and 50% Fibonacci lines are located.
Areas of consideration:
- H4 time frame, 1st support at 30775.37
- H4 time frame, 1st Resistance at 33272.34
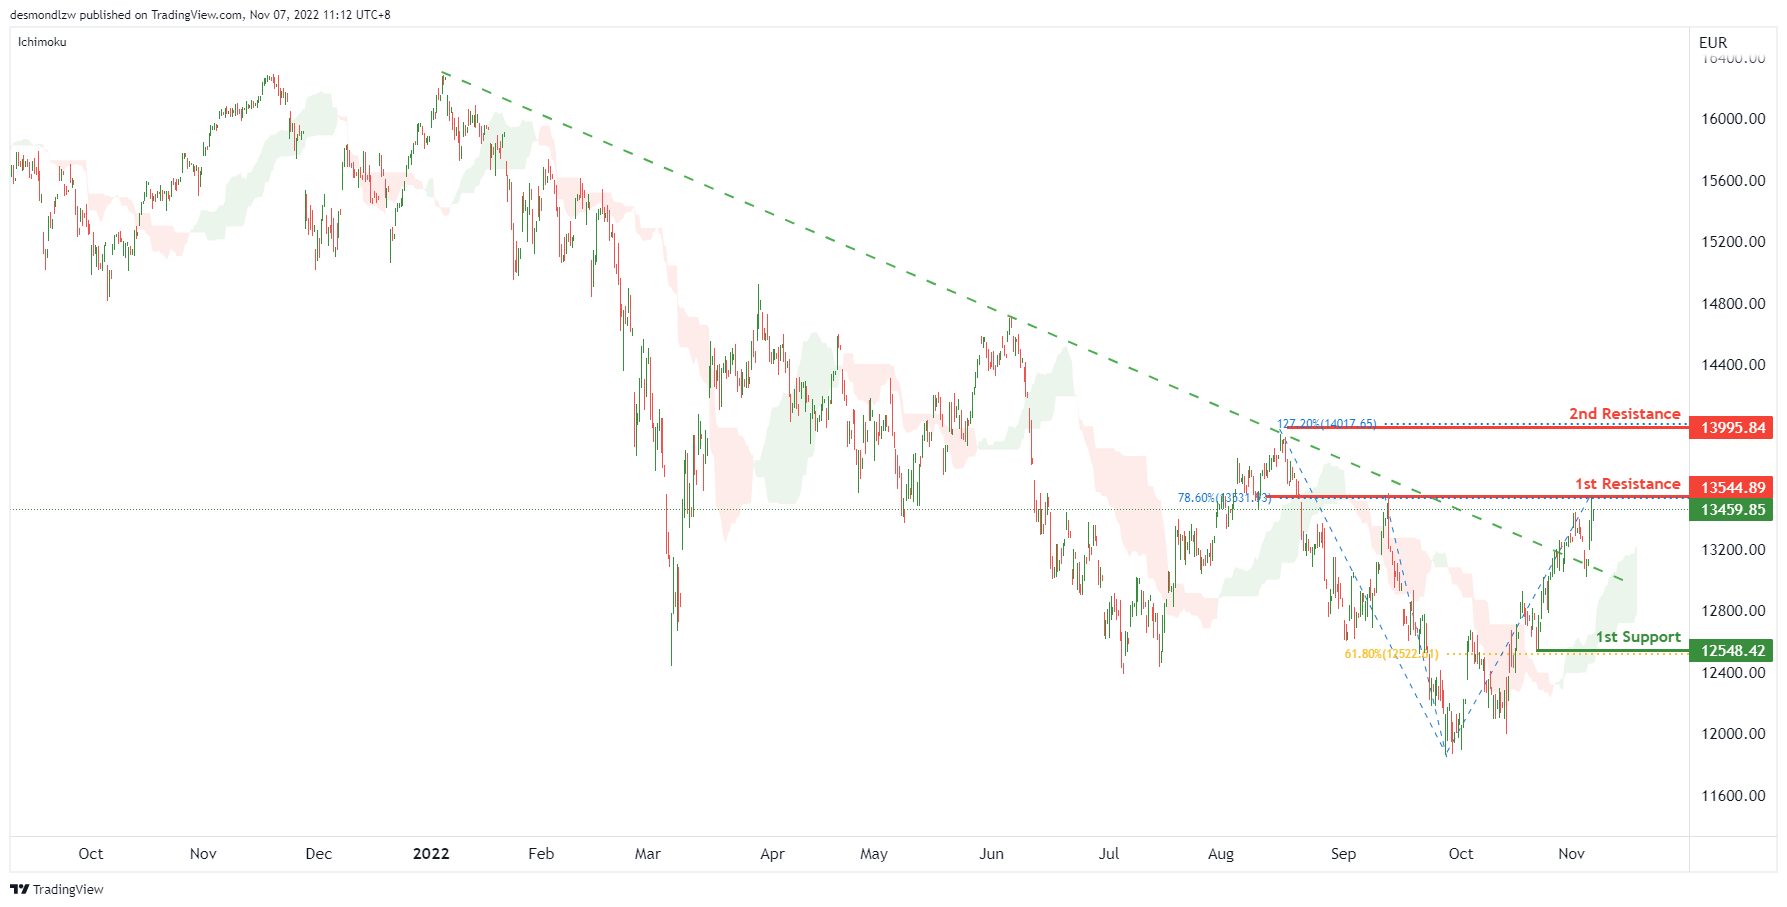
DAX:
On the H4 chart, the price breaking descending trendline. Expecting price to possibly continue this bullish momentum and break the 1st resistance at 13544.89, which is in line with the previous swing high and 78.6% fibonacci retracement. If the 1st resistance is broken, the 2nd resistance is at 13995.84, where 127.2% fibonacci extension sits. Alternatively, the price may drop to the 1st support at 12548.42, which is in line with the 61.8% fibonacci retracement.
Areas of consideration:
- H4 time frame, 1st resistance at 13544.89
- H4 time frame, 2nd resistance is at 13995.84
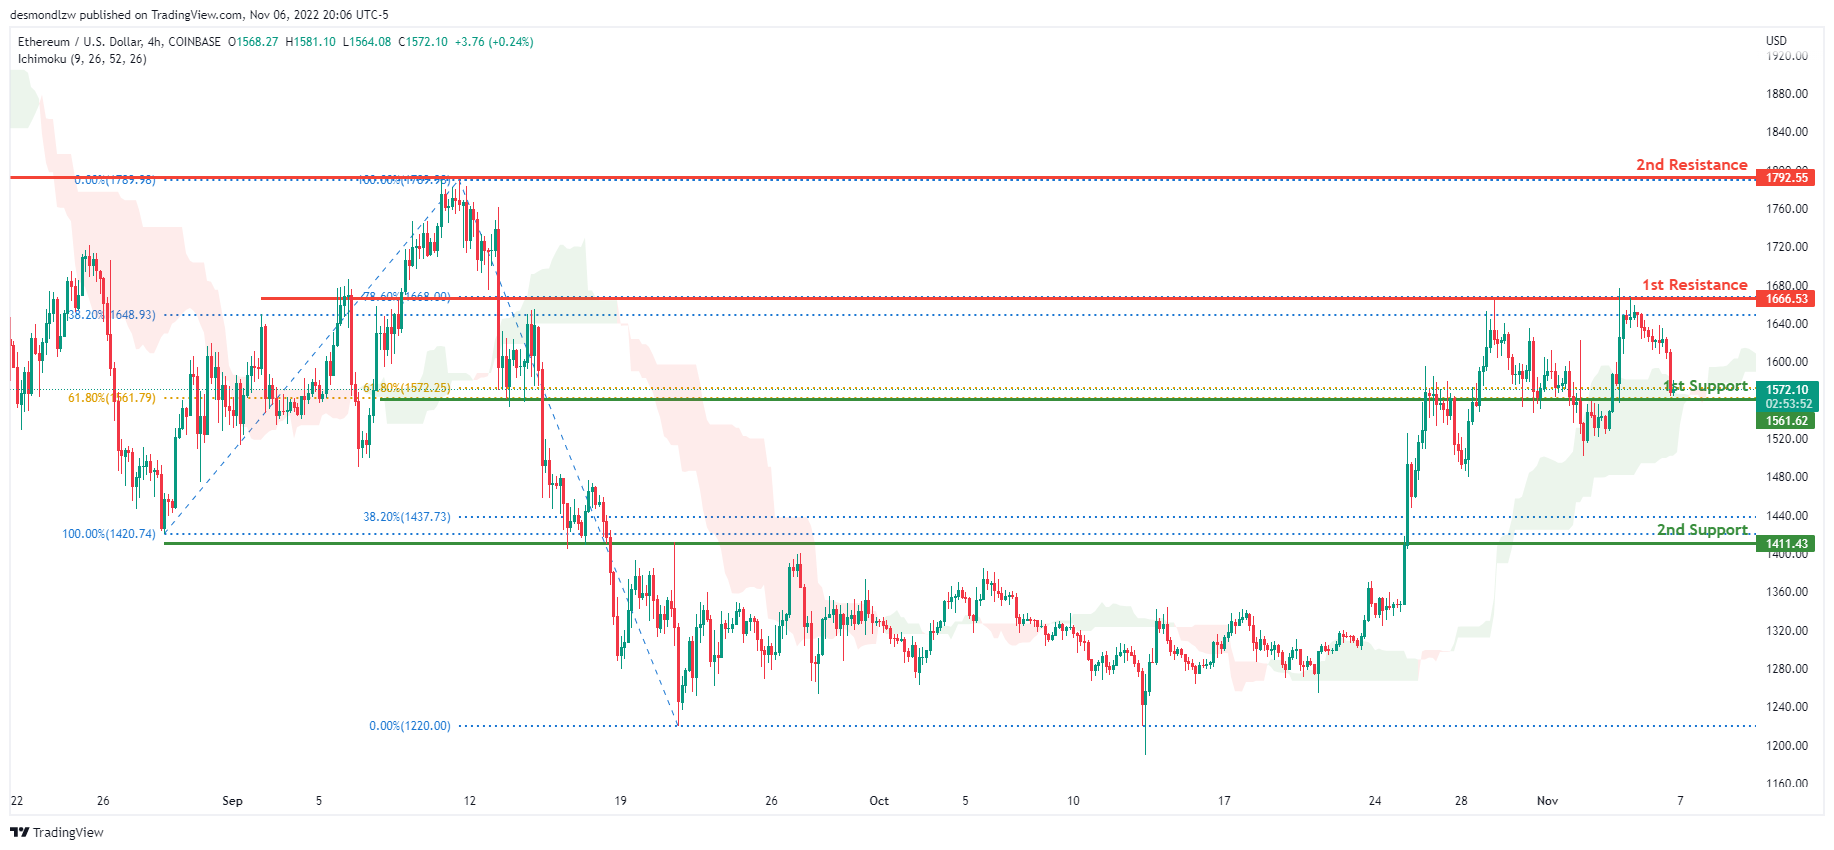
ETHUSD:
Looking at the H4 chart, the current overall bias for ETHUSD is bullish, with price currently within the green Ichimoku cloud. Towards the end of last week, price had a bearish retracement downwards with price currently resting on the 1st support line at 1561.62, where 2 of the 61.8% Fibonacci lines are located. The price is currently trading at 1561.62 at the time of writing. If this bullish momentum continues, expect the price to head towards the 1st resistance line at 1666.53, where the 78.6% and 38.2% Fibonacci lines are located. In an alternative scenario, price could break the 1st support line and head towards the 2nd support line at 1411.43, where the 38.2% and 100% Fibonacci lines are located.
Areas of consideration:
- H4 time frame, 1st resistance of 1666.53
- H4 time frame, 1st support at 1561.62
- H4 time frame, 2nd support at 1411.43
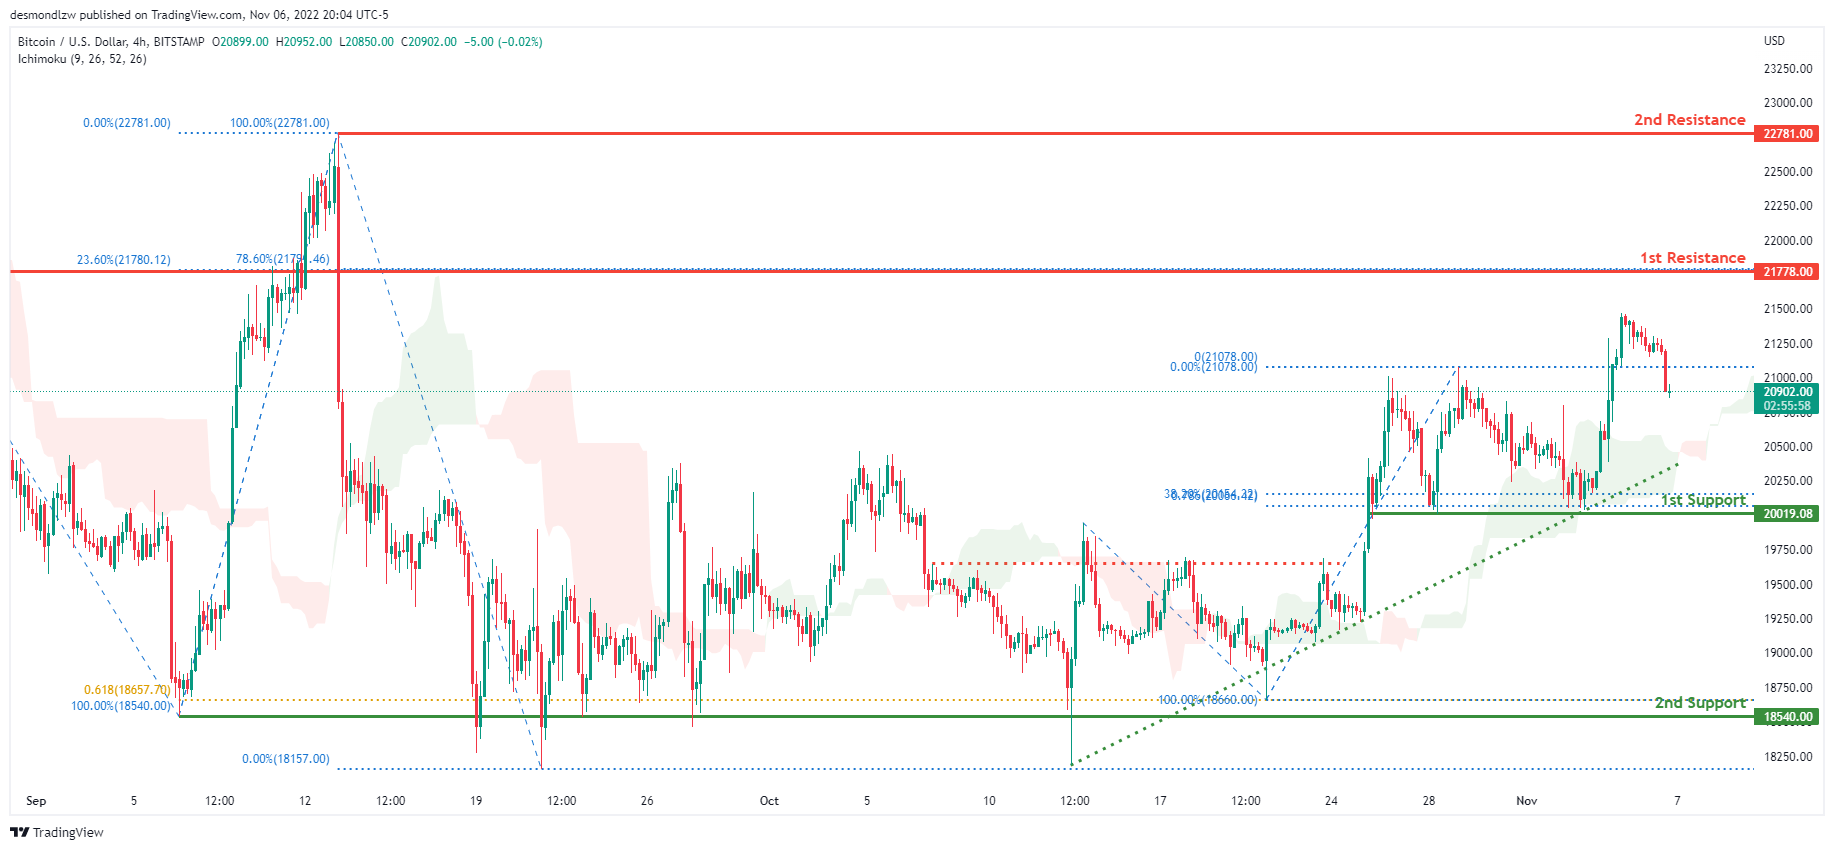
BTCUSD:
On the H4 chart, the overall bias for BTCUSD is bullish. To add confluence to this, the price is above the Ichimoku cloud which indicates a bullish market. Towards the end of last week, price had bullish momentum before having a downwards bearish retracement. Price is currently trading at 20897.00 at time of writing. If this bullish momentum continues, expect the price to head towards the 1st resistance line at 21788.00 where the 78.6% and 23.6% Fibonacci lines are located. In an alternative scenario, price could continue its bearish retracement and head towards the 1st support line at 20019.08, where the 38.2% Fibonacci line and 78.6% Fibonacci projection line is located.
Areas of consideration:
- H4 time frame, 1st resistance 21778.00
- H4 time frame, 1st support at 20019.08
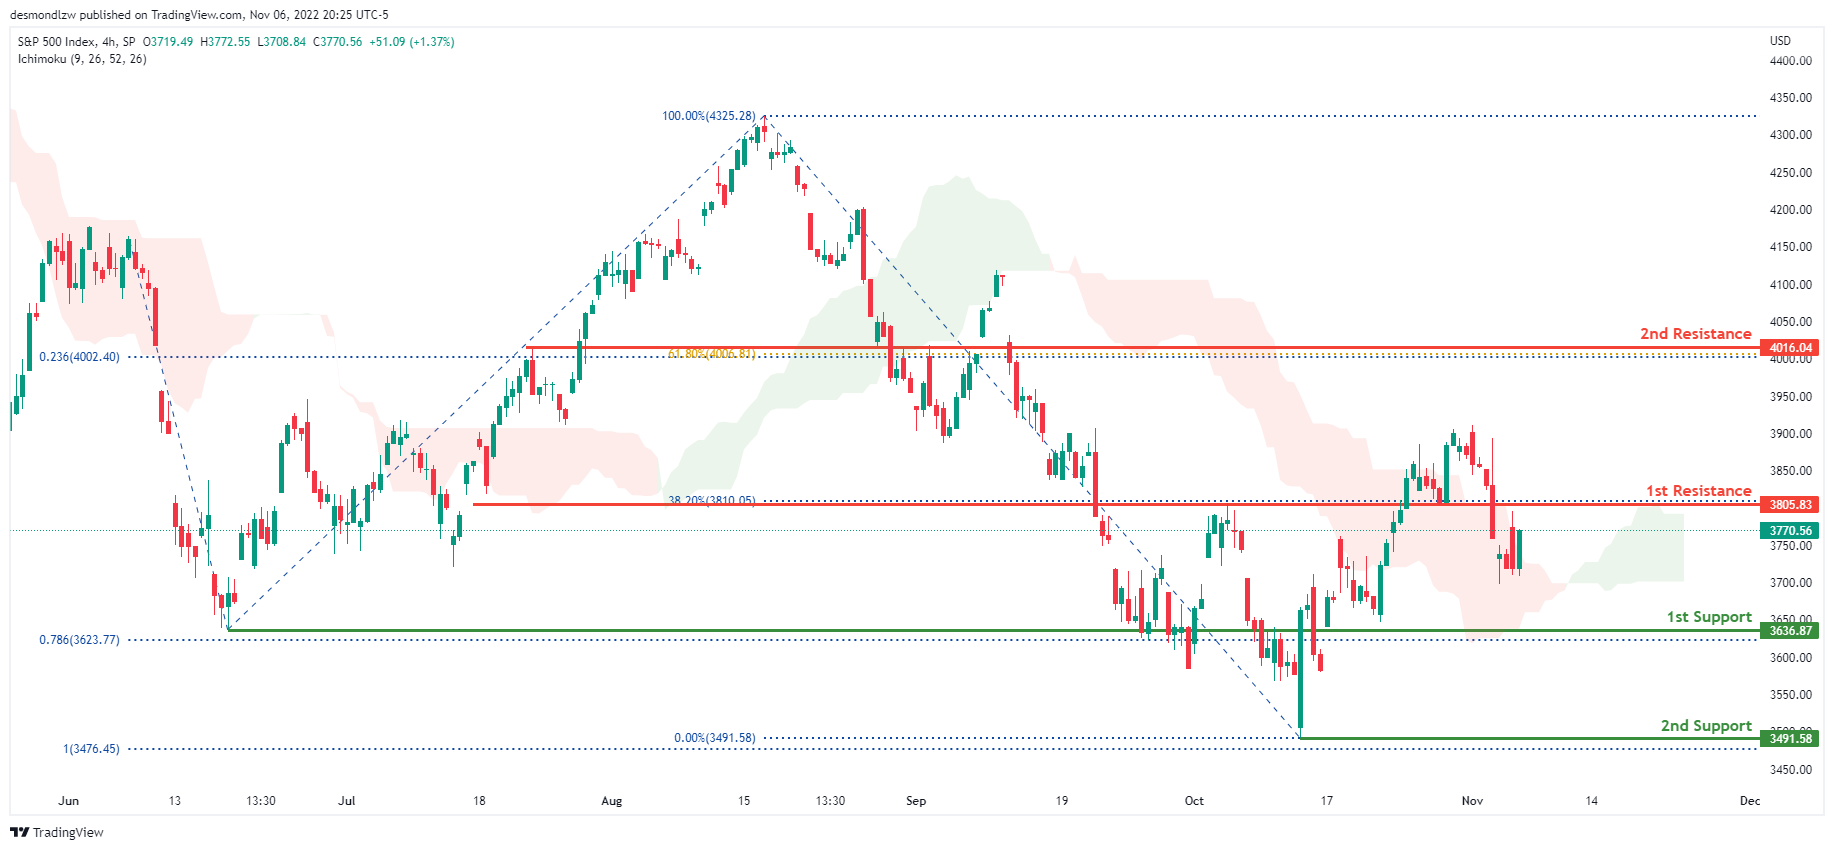
S&P 500:
On the H4 chart, the overall bias for S&P500 is bearish with price currently crossing under the Ichimoku cloud. Towards the end of last week, price continued its bearish momentum with price closing under the 1st resistance at 3805.83 where the 38.2% Fibonacci line is located. The price is currently trading at 3770.56 at time of writing. If this bearish momentum continues, expect price to possibly head towards the 1st support at 3636.87 where the previous swing low and 78.6% Fibonacci projection line is located. In an alternative scenario, price could break back up to test the 1st resistance line.
Areas of consideration:
- H4 time frame, 1st support at 3636.87
- H4 time frame, 1st resistance at 3805.83


