
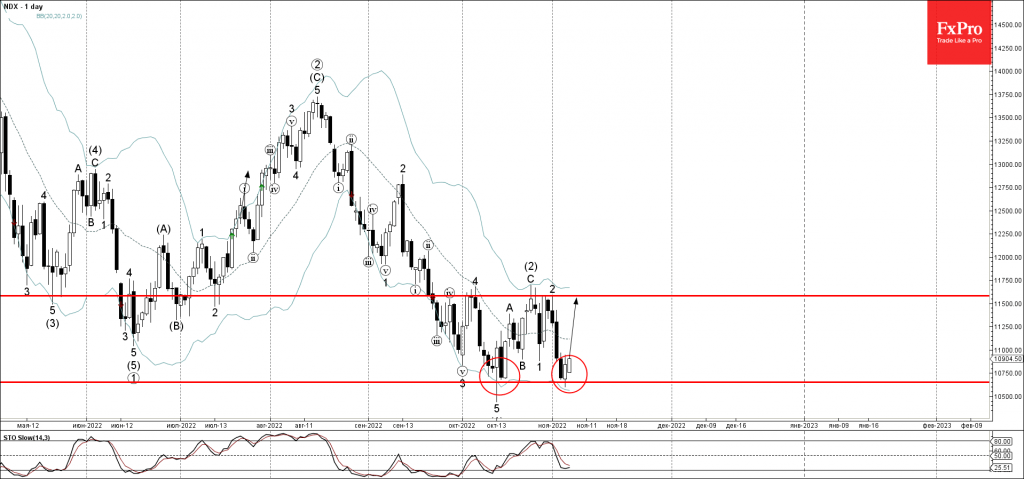
- Nasdaq 100 reversed from pivotal support 10650.00
- Likely to rise to resistance level 11585.00
Nasdaq 100 index recently reversed up from the pivotal support 10650.00 (which stopped wave 5 in the middle of October) – standing near the lower daily Bollinger Band.
Upward reversal from the key support 10650.00 created the daily candlesticks reversal pattern Piercing Line, which stopped the earlier impulse waves 3 and (3).
Given the strength of the support 10650.00 ,Nasdaq 100 can be expected to rise further toward the next resistance level 11585.00.


