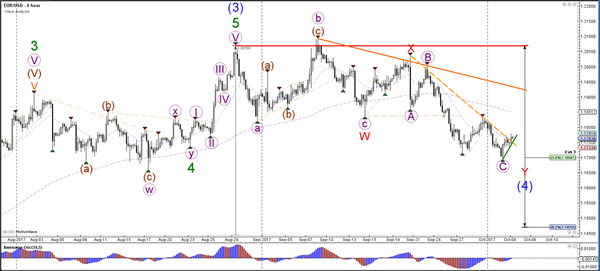
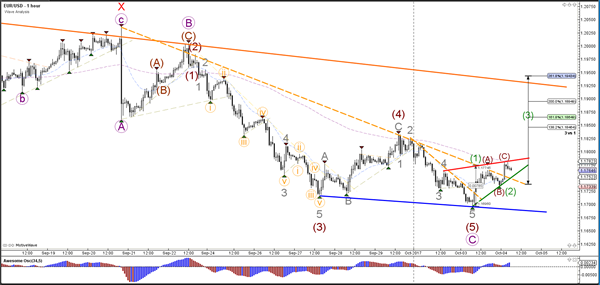
Currency pair EUR/USD
The EUR/USD broke the resistance trend line (dotted orange) which could indicate that price is making a second bounce at the 23.6% Fibonacci support level of wave 4 (blue). A third attempt to break below the Fib could start a larger correction towards the 38.2% Fib.
The EUR/USD bullish price action broke above two resistance lines (dotted orange) but could still resemble a rising wedge pattern and an ABC (brown). A bullish breakout becomes more likely if price manages to break above resistance (red) and the 1.18 round level.
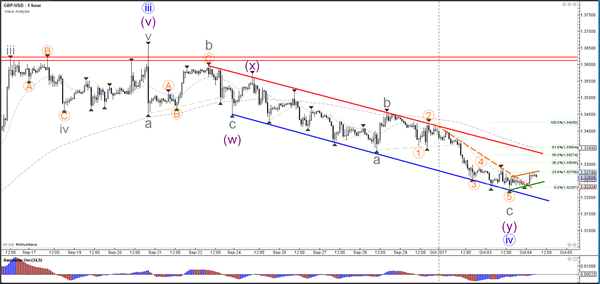
Currency pair GBP/USD
The GBP/USD is at the round level of 1.3250, which is an important support zone as they are two trend lines (blue) and a 50% Fib of wave 4 vs 3. Price will need to break above resistance (red) of the bearish channel before a larger uptrend continuation becomes more likely.
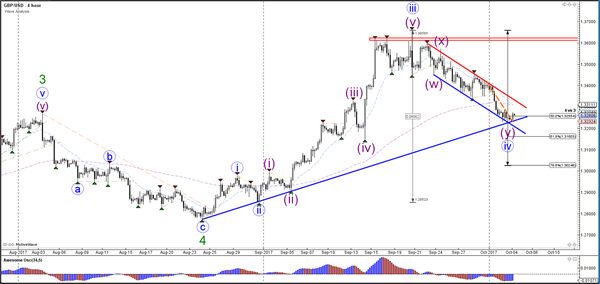
On the 1 hour chart it seems like price is building a bear flag chart pattern after breaking above the steep resistance trend line (dotted orange). A break above the resistance or below support could confirm a potential breakout.
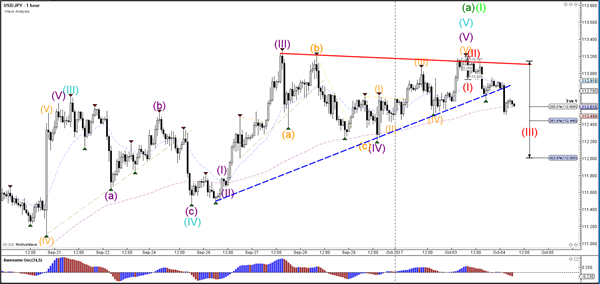
Currency pair USD/JPY
The USD/JPY failed to break the resistance trend line (red) and instead broke below the support trend line (dotted blue). The bearish breakout could indicate the completion of wave A or 1 and the start of wave B or 2.
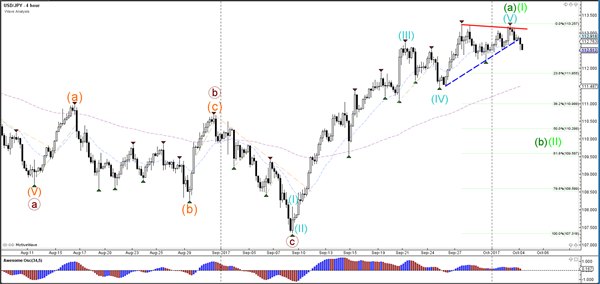
The USD/JPY could be in a bearish wave 3 (red).