
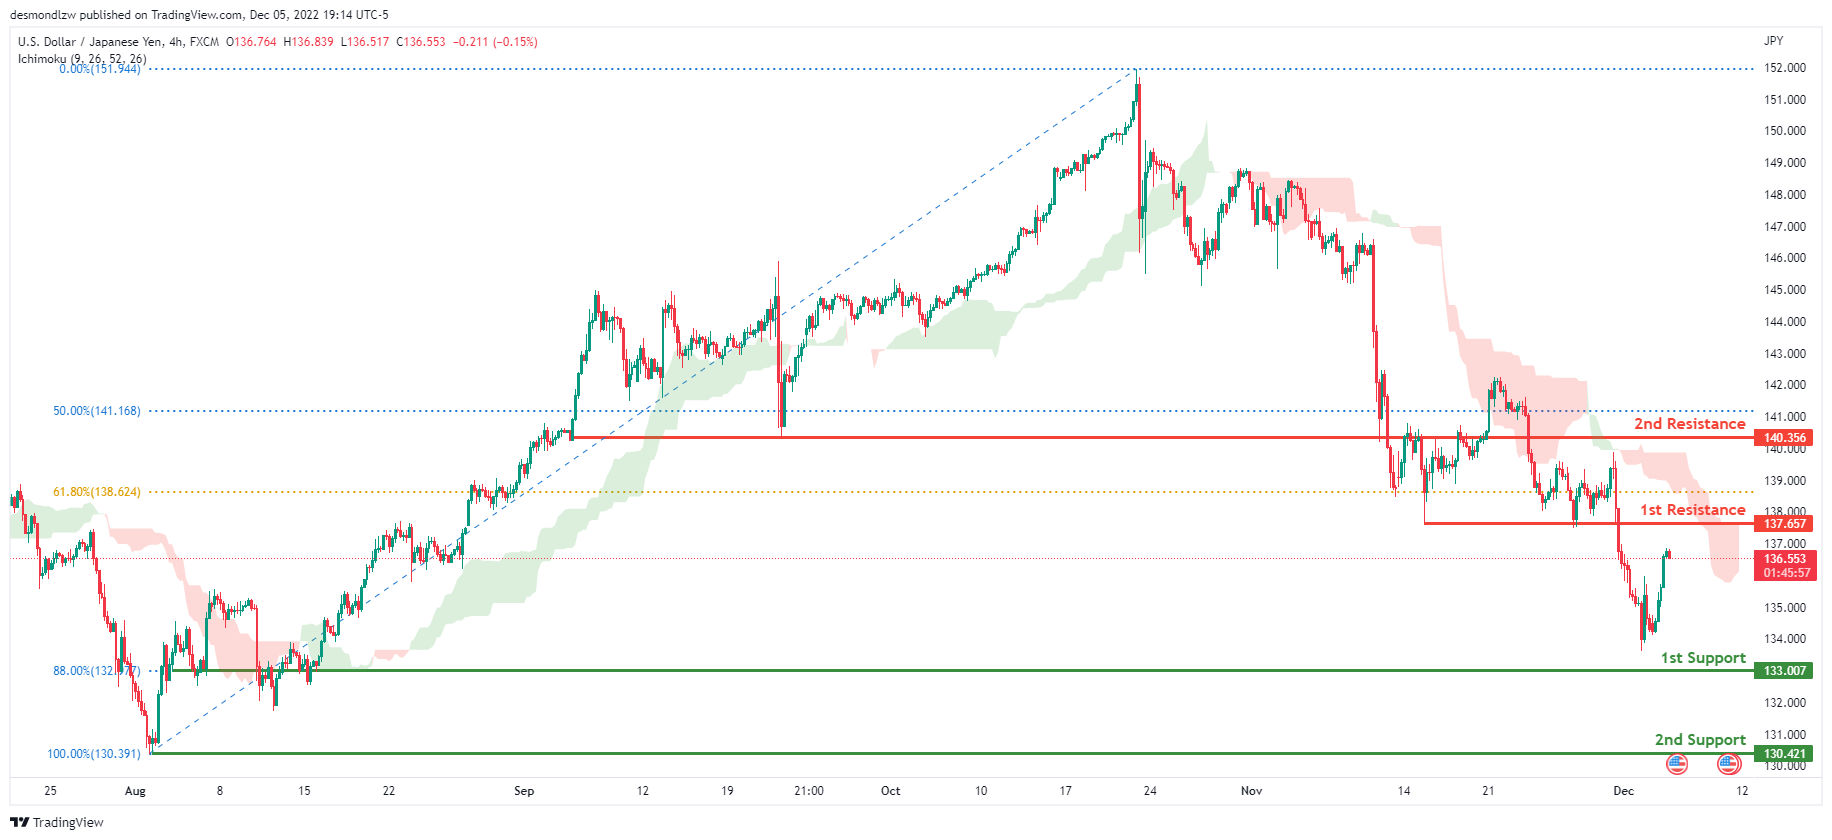
USD/JPY:
The current general bias for USDJPY on the H4 chart is bearish. To add confluence to this, the price is under the Ichimoku cloud which indicates a bearish market. If the bearish momentum continues, expect USDJPY to continue heading towards the 1st support at 133.007 where the 88% Fibonacci line is. In an alternative scenario, price could head back up to retest the 1st resistance line at 137.657, where the 61.8% Fibonacci line and previous low are located.
Areas of consideration:
- H4 time frame, 1st resistance at 137.657
- H4 time frame, 1st support at 133.007
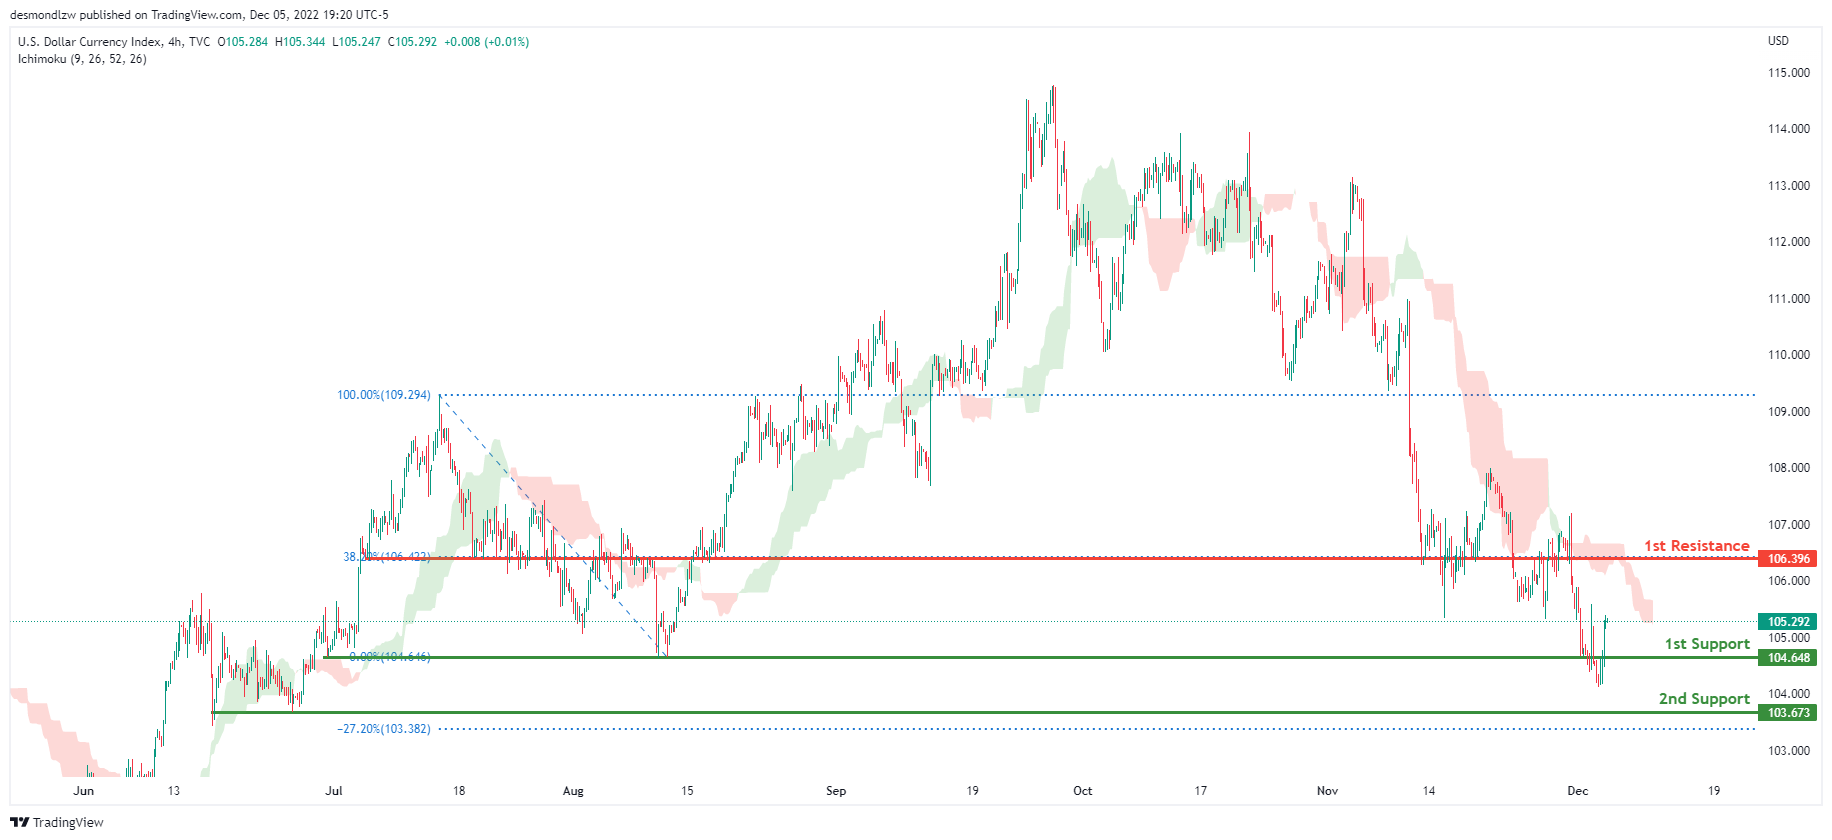
DXY:
On the H4 chart, the overall bias for DXY is bearish. To add confluence to this, the price is crossing below the Ichimoku cloud which indicates a bearish market. If this bearish momentum continues, expect the price to continue heading towards the 1st support line at 104.648, where the previous swing low is. In an alternative scenario, price could head back up and retest the 1st resistance line resistance at 106.396, where the 38.2% Fibonacci line is.
Areas of consideration:
- H4 time frame, 1st resistance at 106.396
- H4 time frame, 1st support at 104.648
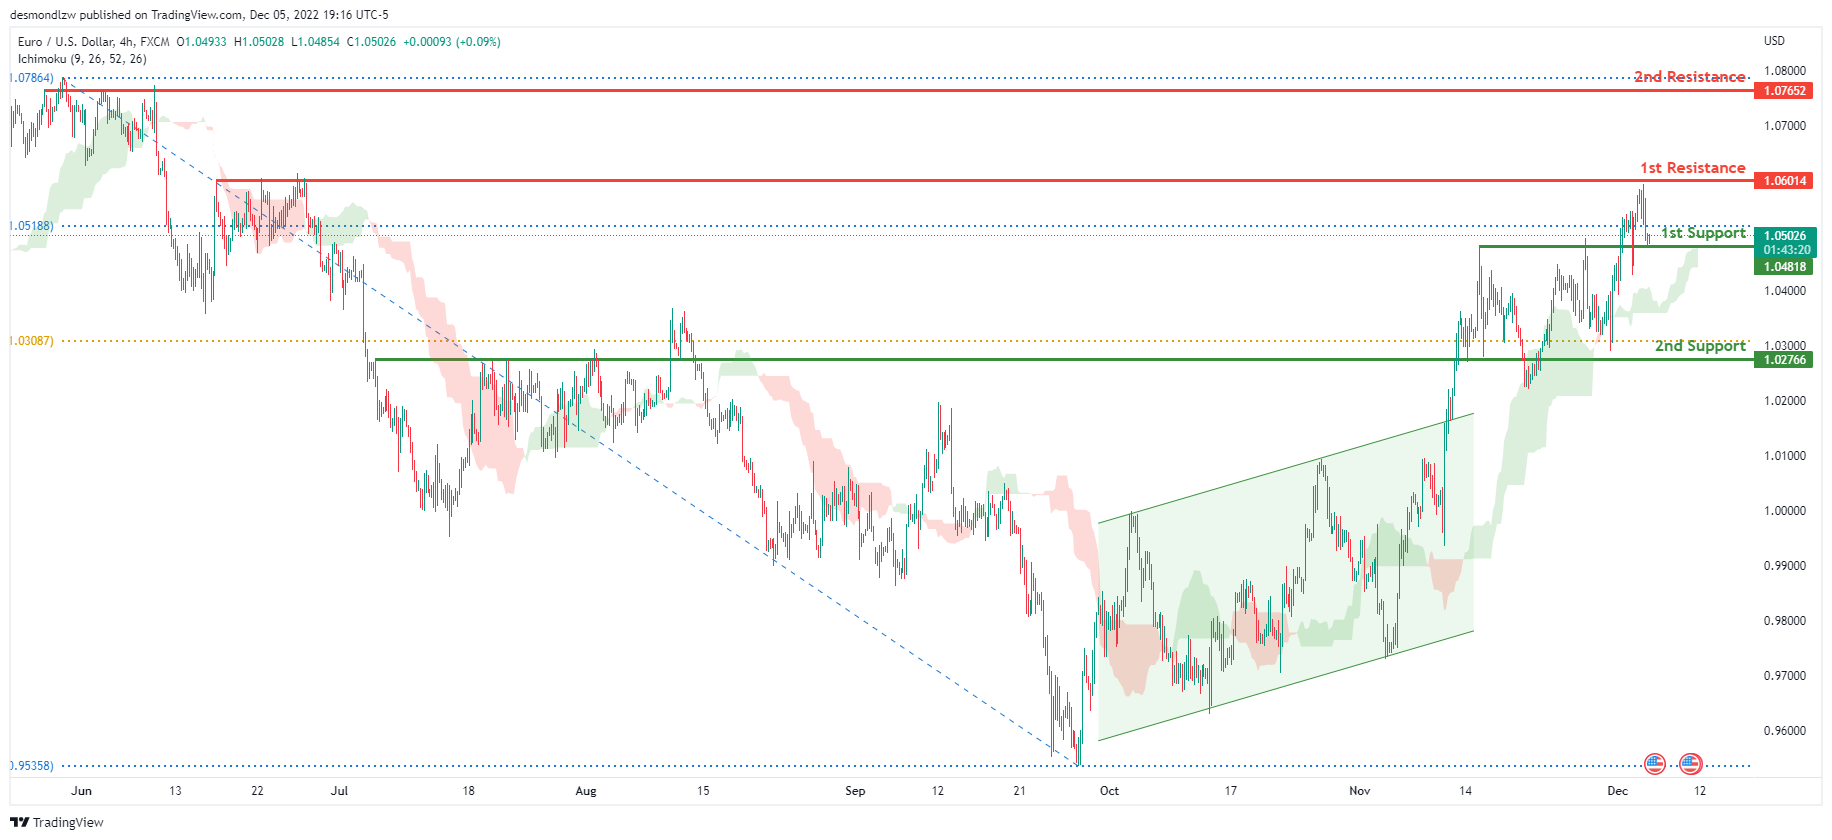
EUR/USD:
Looking at the H4 chart, my overall bias for EURUSD is bullish due to the current price being above the Ichimoku cloud, indicating a bullish market. To add confluence to this bias, price has also broken above the ascending bullish channel. If this bullish momentum continues, expect the price to possibly head towards the 1st resistance at 1.06014, where the previous swing high and 78.6% Fibonacci line are located. In an alternate scenario, price could possibly head back down to break the 1st support level at 1.04818, where the previous high and 78.6% Fibonacci line are located before heading towards the 2nd support at 1.02766 where the 61.8% Fibonacci line is.
Areas of consideration :
- H4 1st resistance at 1.06014
- H4 1st support at 1.04818
- H4 2nd support at 1.02766
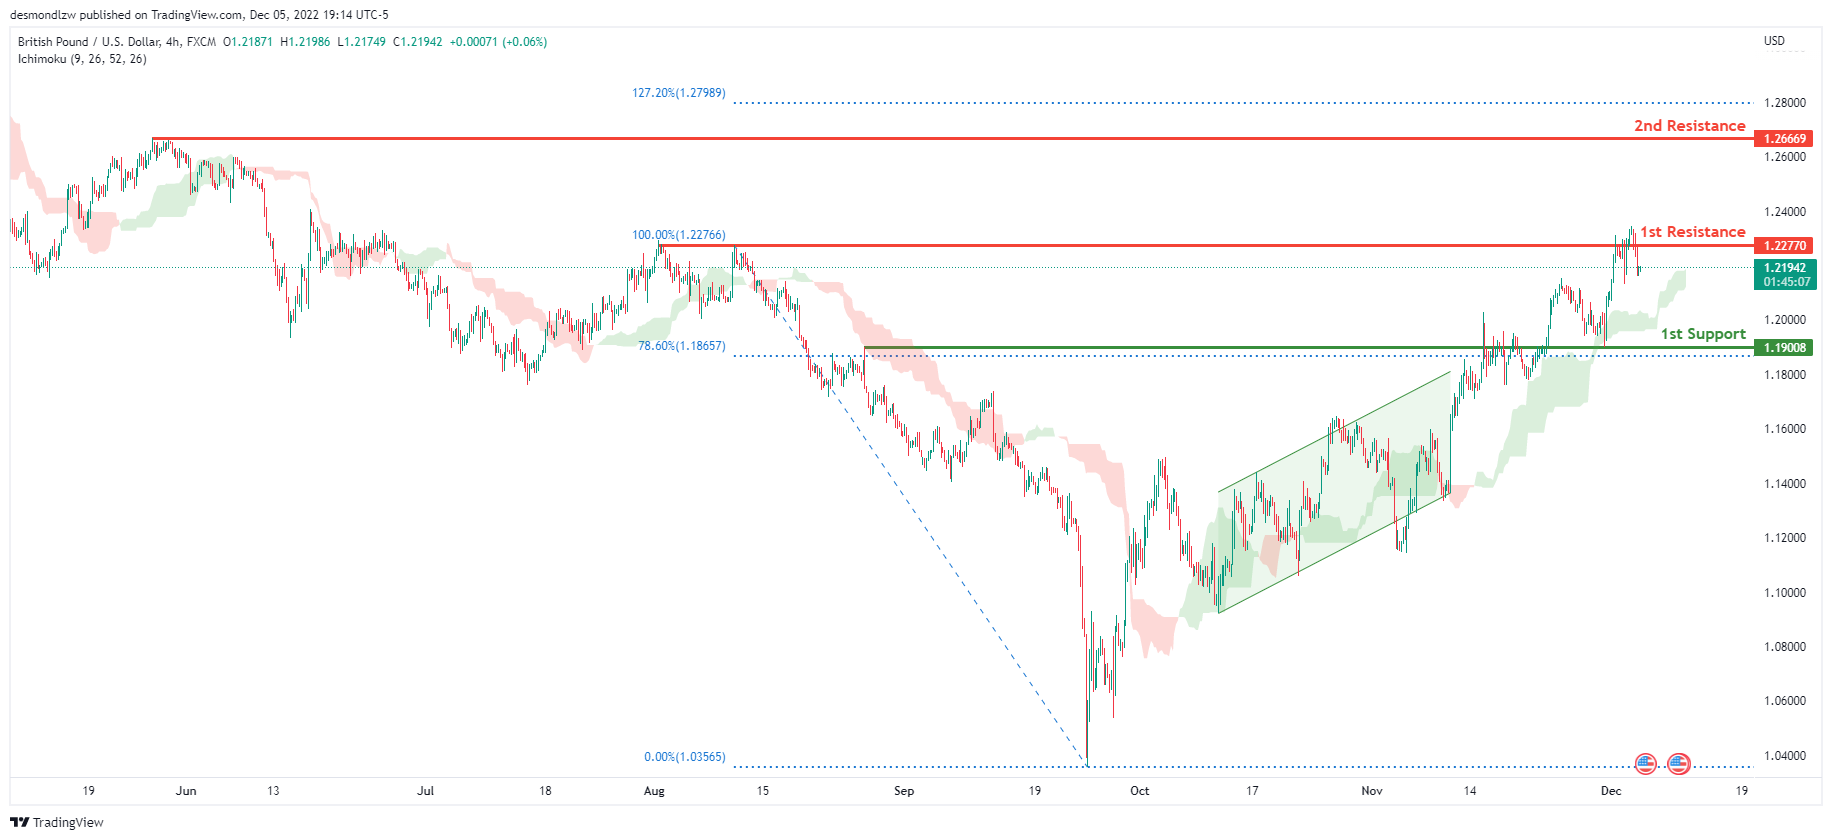
GBP/USD:
Looking at the H4 chart, my overall bias for GBPUSD is bullish due to the current price being above the Ichimoku cloud, indicating a bullish market. Expecting price to head back up to retest the 1st resistance line at 1.22770, where the previous high is. In an alternative scenario, price could possibly head back down towards the 1st support at 1.19008, where the 78.6% Fibonacci line is.
Areas of consideration:
- H4 1st resistance at 1.22770
- H4 1st support at 1.19008
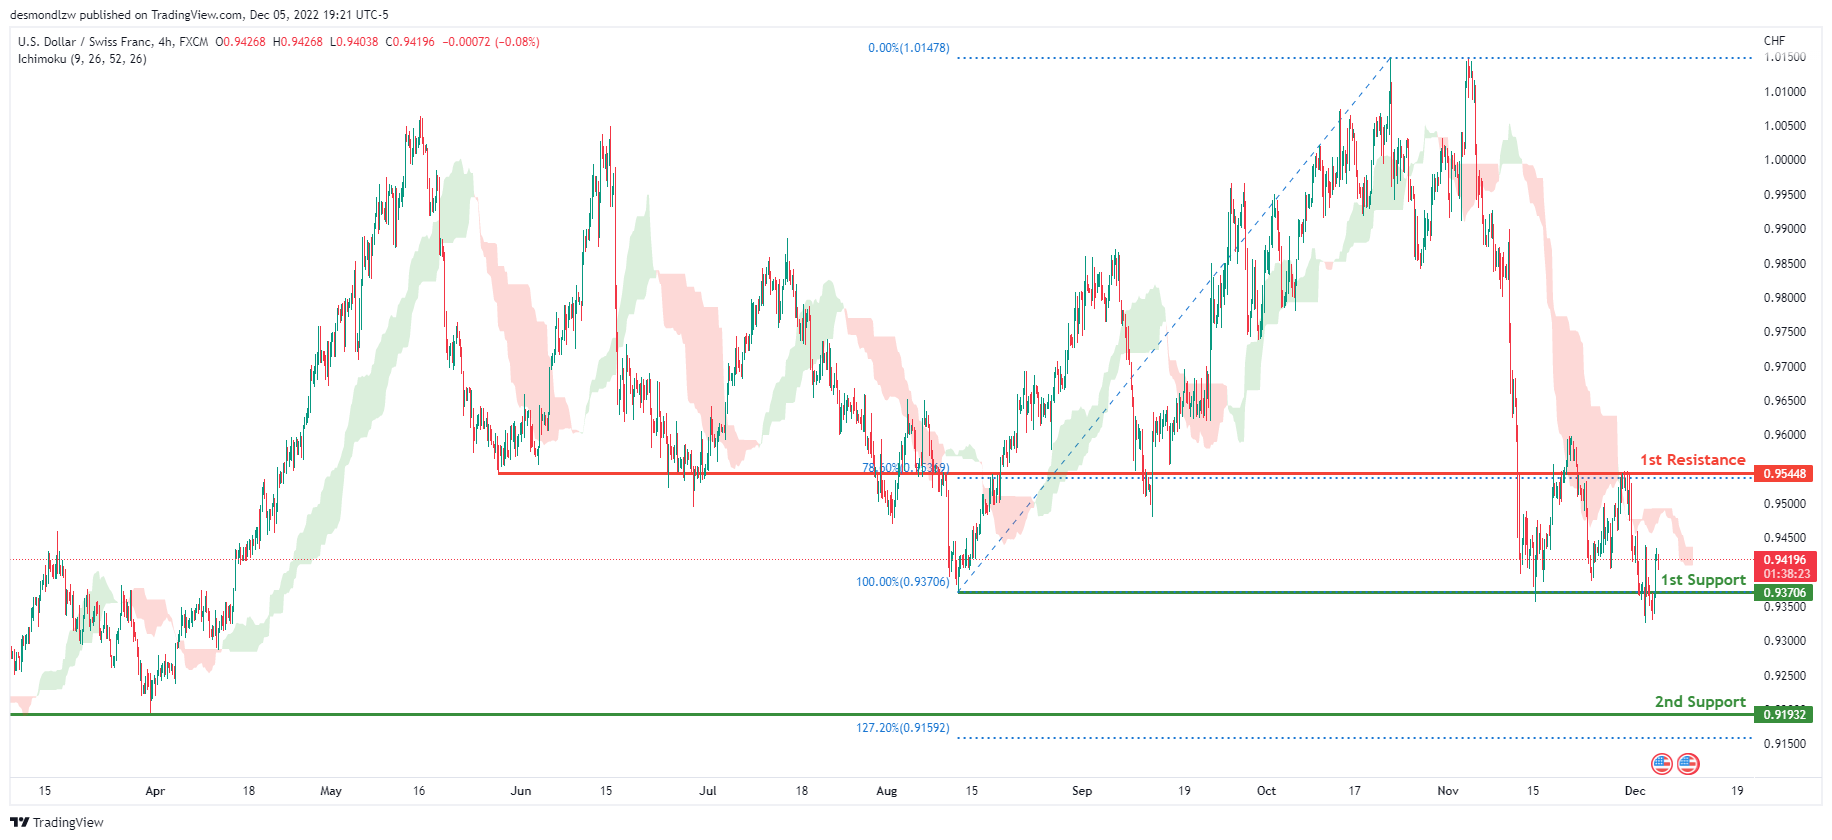
USD/CHF:
The overall bias for USDCHF on the H4 chart is bearish. In addition, the price is below the Ichimoku cloud, indicating a bearish market. If the current bearish trend continues, expect the price to head back down towards the 1st support line at 0.93706, where the previous swing low is . In an alternative scenario, price could possibly head up towards the 1st resistance at 0.95448, where the 78.6% Fibonacci line is.
Areas of consideration
- H4 1st support at 0.93706
- H4 1st resistance at 0.95448
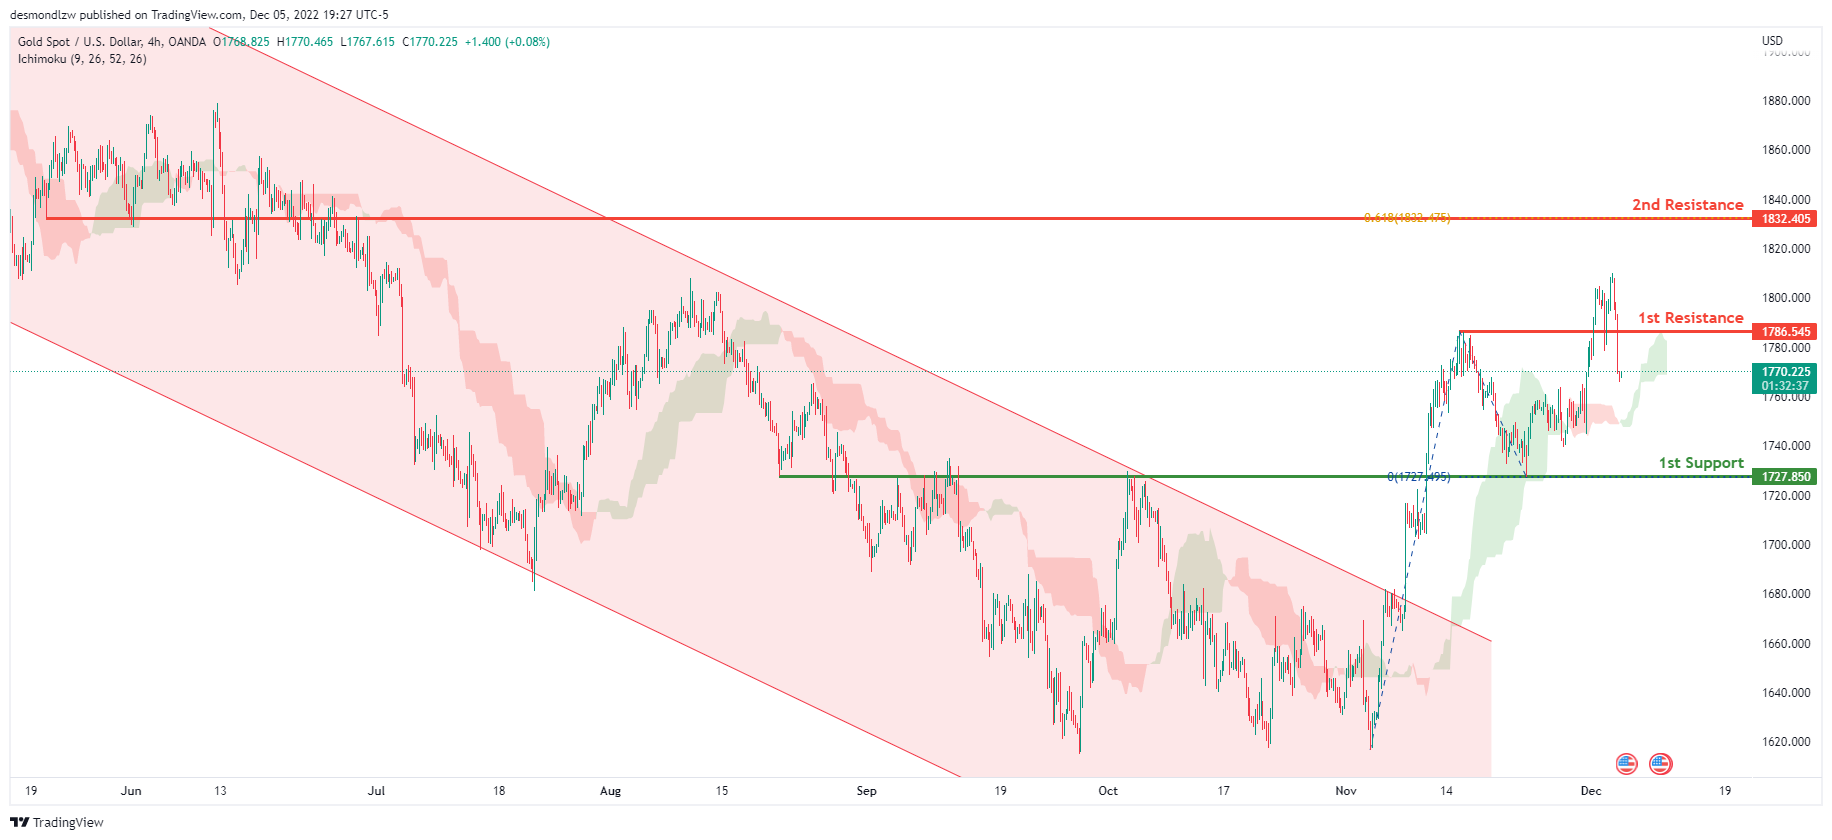
XAU/USD (GOLD):
Looking at the H4 chart, my overall bias for XAUUSD is bullish due to the current price crossing above the Ichimoku cloud, indicating a bullish market. If this bullish momentum continues, expect the price to possibly continue heading towards the 1st resistance at 1786.545, where the previous swing high is located. In an alternate scenario, price could possibly head back down towards the 1st support level at 1727.850, where the previous swing low is located.
Areas of consideration:
- H4 time frame, 1st resistance at 1786.545
- H4 time frame, 1st support at 1727.850
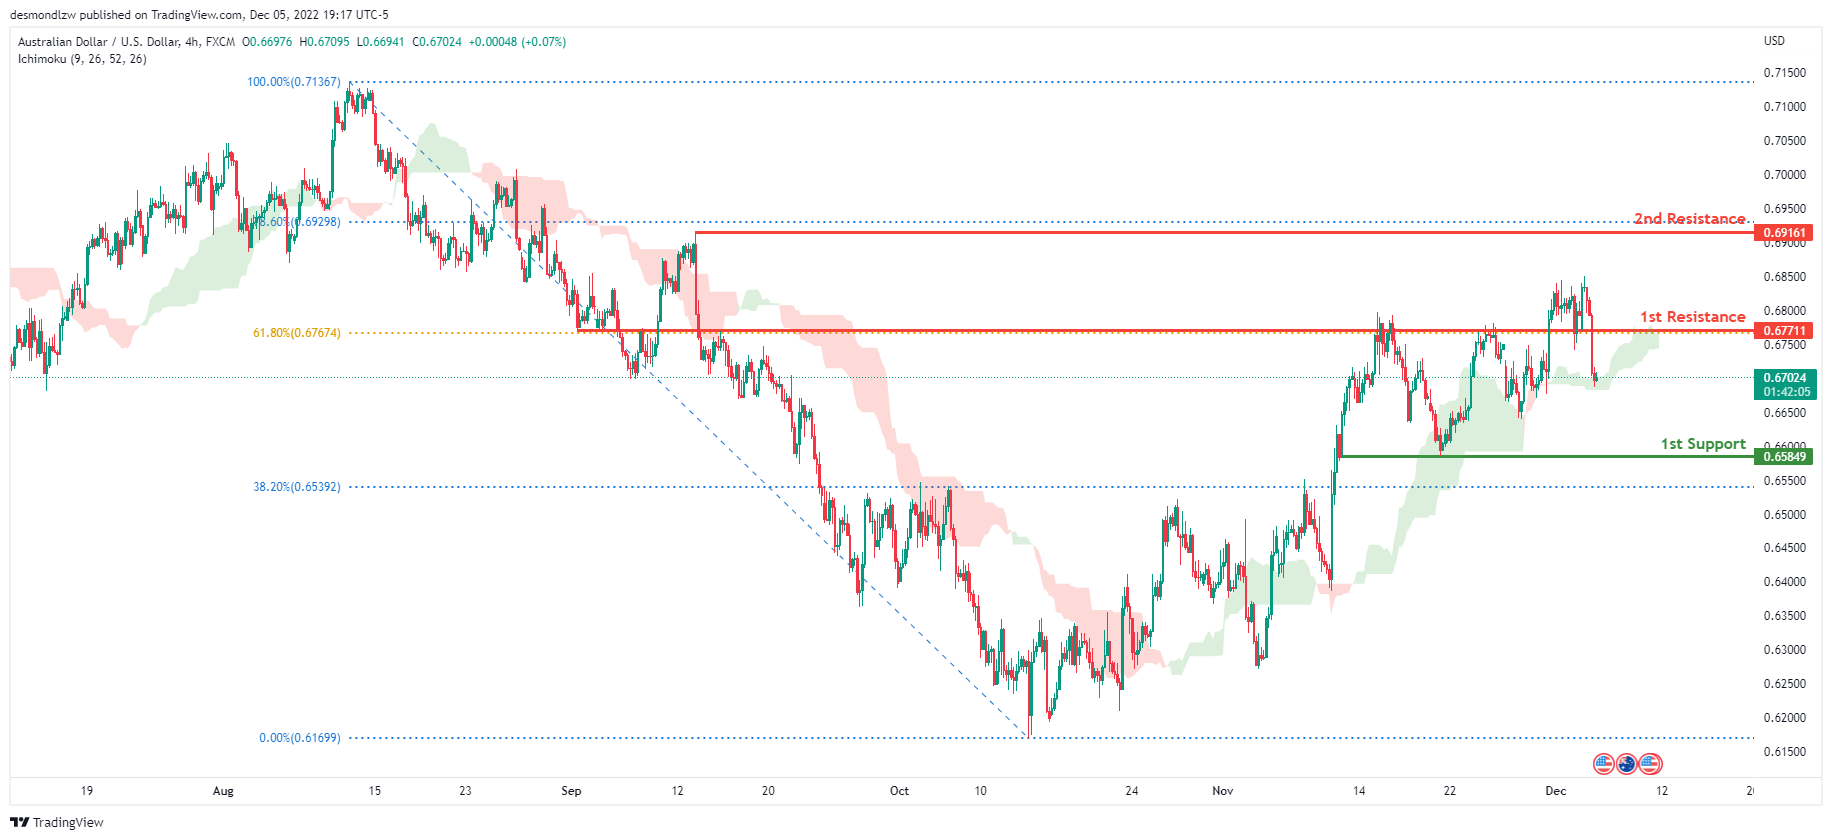
AUD/USD:
Looking at the H4 chart, my overall bias for AUDUSD is bearish due to the current price crossing below the Ichimoku cloud, indicating a bearish market. If this bearish momentum continues, expect price to head towards the 1st support at 0.65849, where the 38.2% Fibonacci line and previous swing low is. In an alternative scenario, price could possibly head back up to retest the 1st resistance line at 0.67711, where the 61.8% Fibonacci line is.
Areas of consideration
- H4, 1st resistance at 0.67711
- H4, 1st support at 0.65849
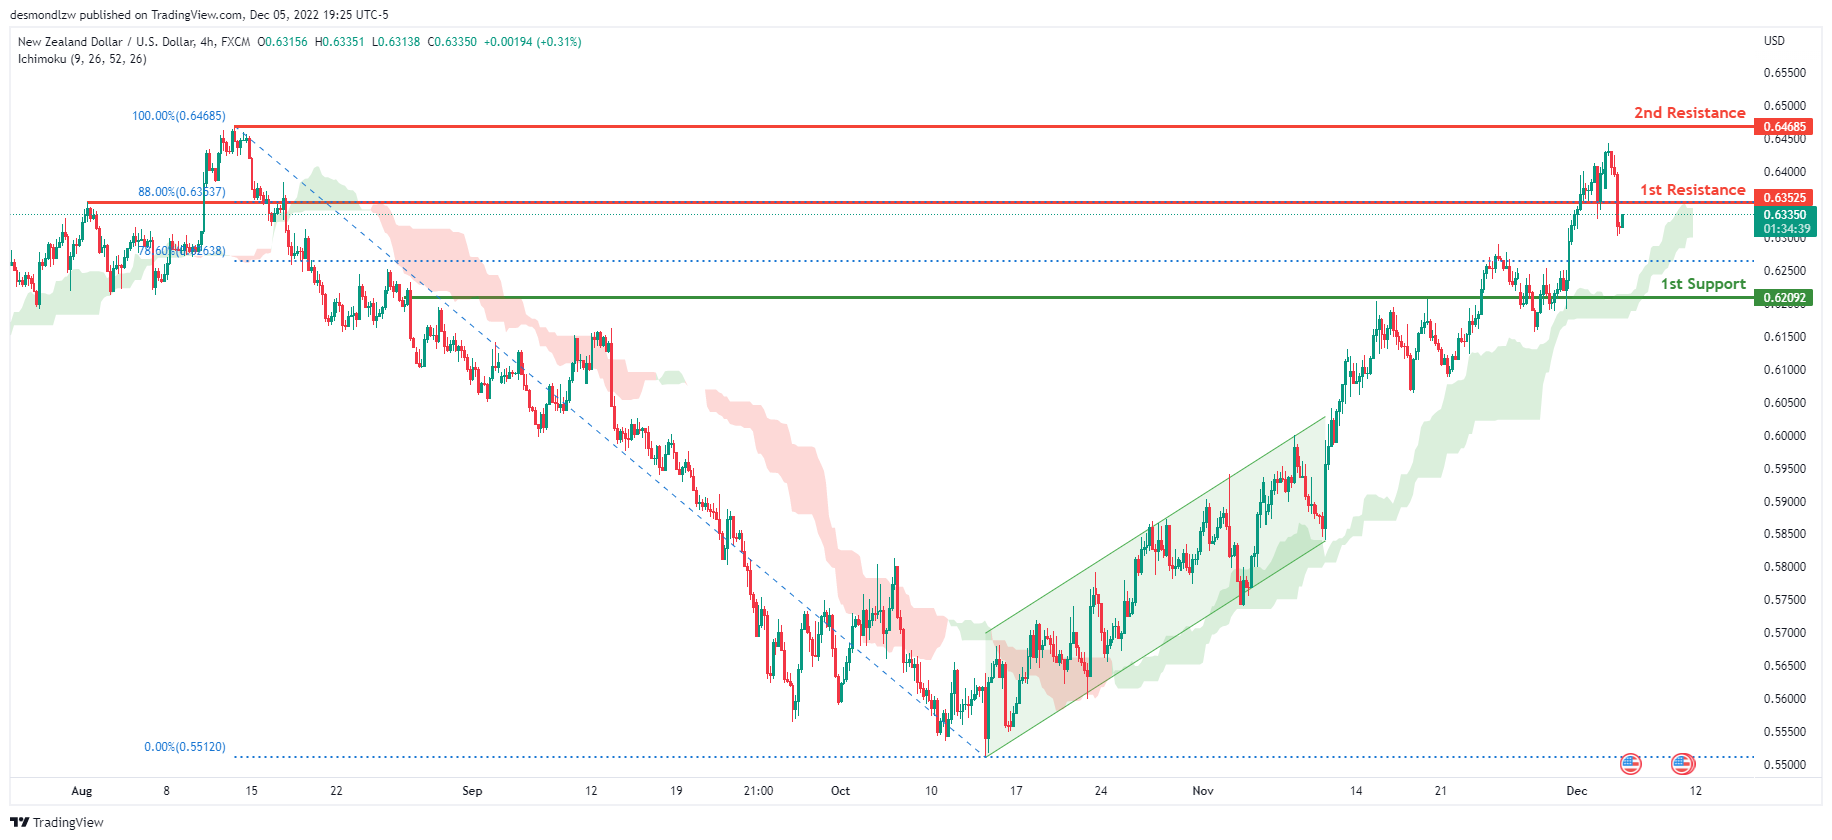
NZD/USD:
Looking at the H4 chart, my overall bias for NZDUSD is bullish due to the current price being above the Ichimoku cloud, indicating a bullish market.
To add confluence to this bias, price has broken out of the ascending channel. If this bullish momentum continues, expect the price to head back up to retest the 1st resistance line at 0.63525, where the 88% Fibonacci line is. Alternatively, the price may head back down towards the 1st support at 0.62092, where the previous high and 78.6% Fibonacci line are.
Areas of consideration:
- H4 time frame, 1st resistance at 0.63525
- H4 time frame, 1st support at 0.62092
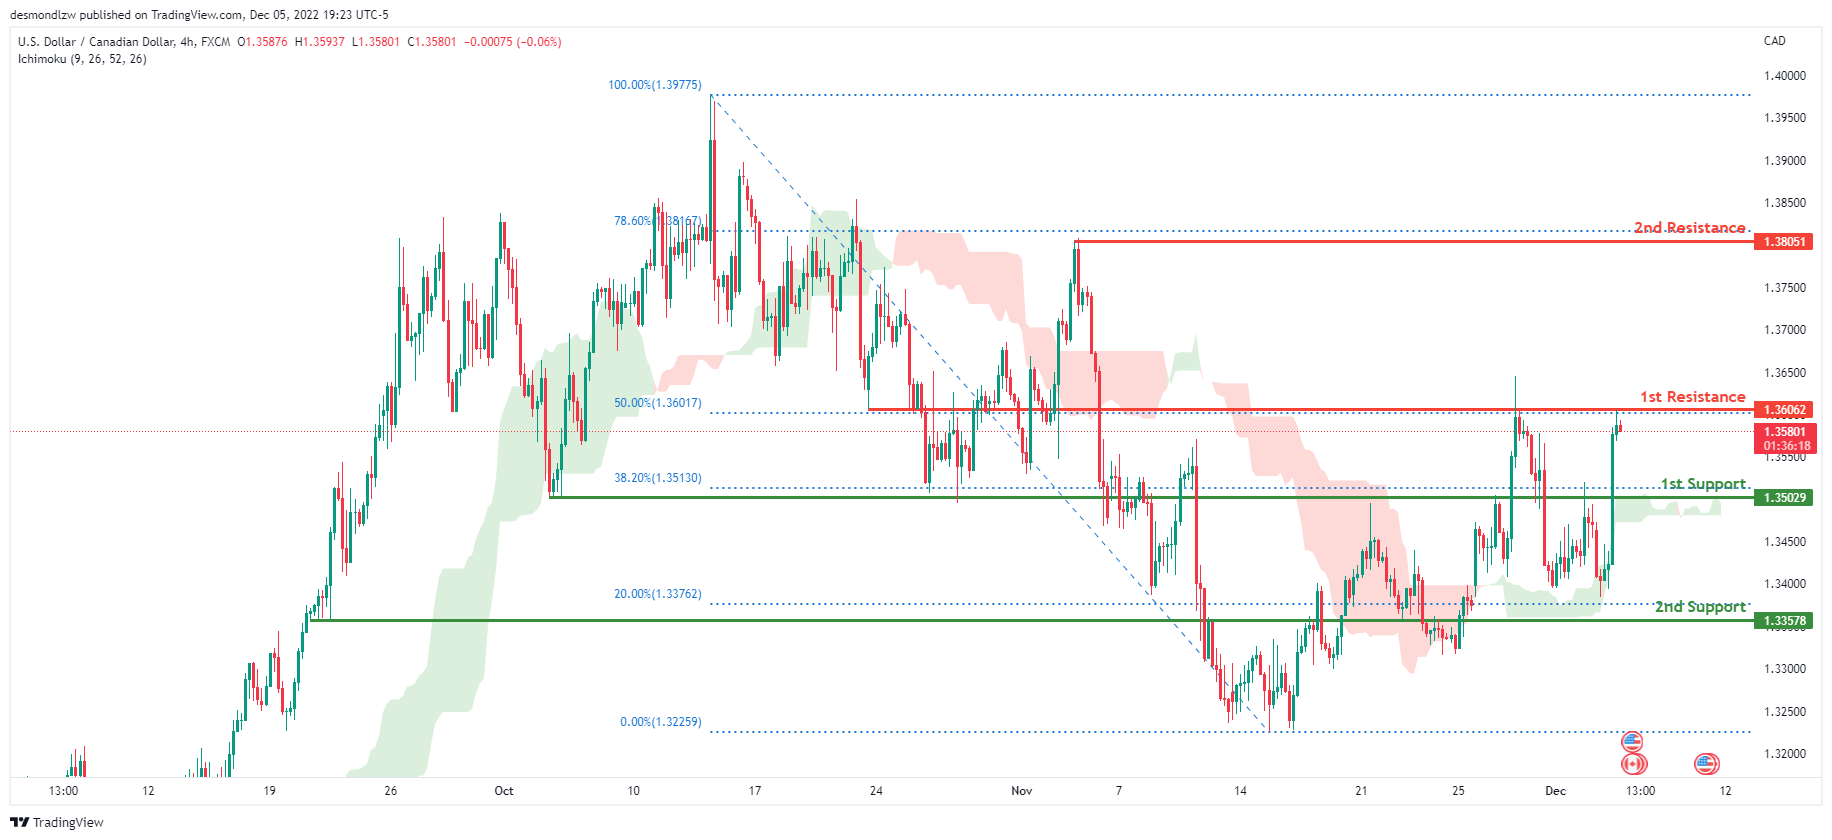
USD/CAD:
On the H4 chart, the overall bias for USDCAD is bullish. To add confluence to this, the price is above the Ichimoku cloud which indicates a bullish market. If this bullish momentum continues, expect the price to break the 1st resistance line at 1.36062 where the 50% Fibonacci line is before heading towards the 2nd resistance at 1.38051, where the previous swing high is. In an alternative scenario, price could head back down to retest the 1st support at 1.35029, where the 38.2% Fibonacci line is.
Areas of consideration:
- H4 time frame, 1st resistance at 1.36062
- H4 time frame, 2nd resistance at 1.38051
- H4 time frame, 1st support at 1.35029
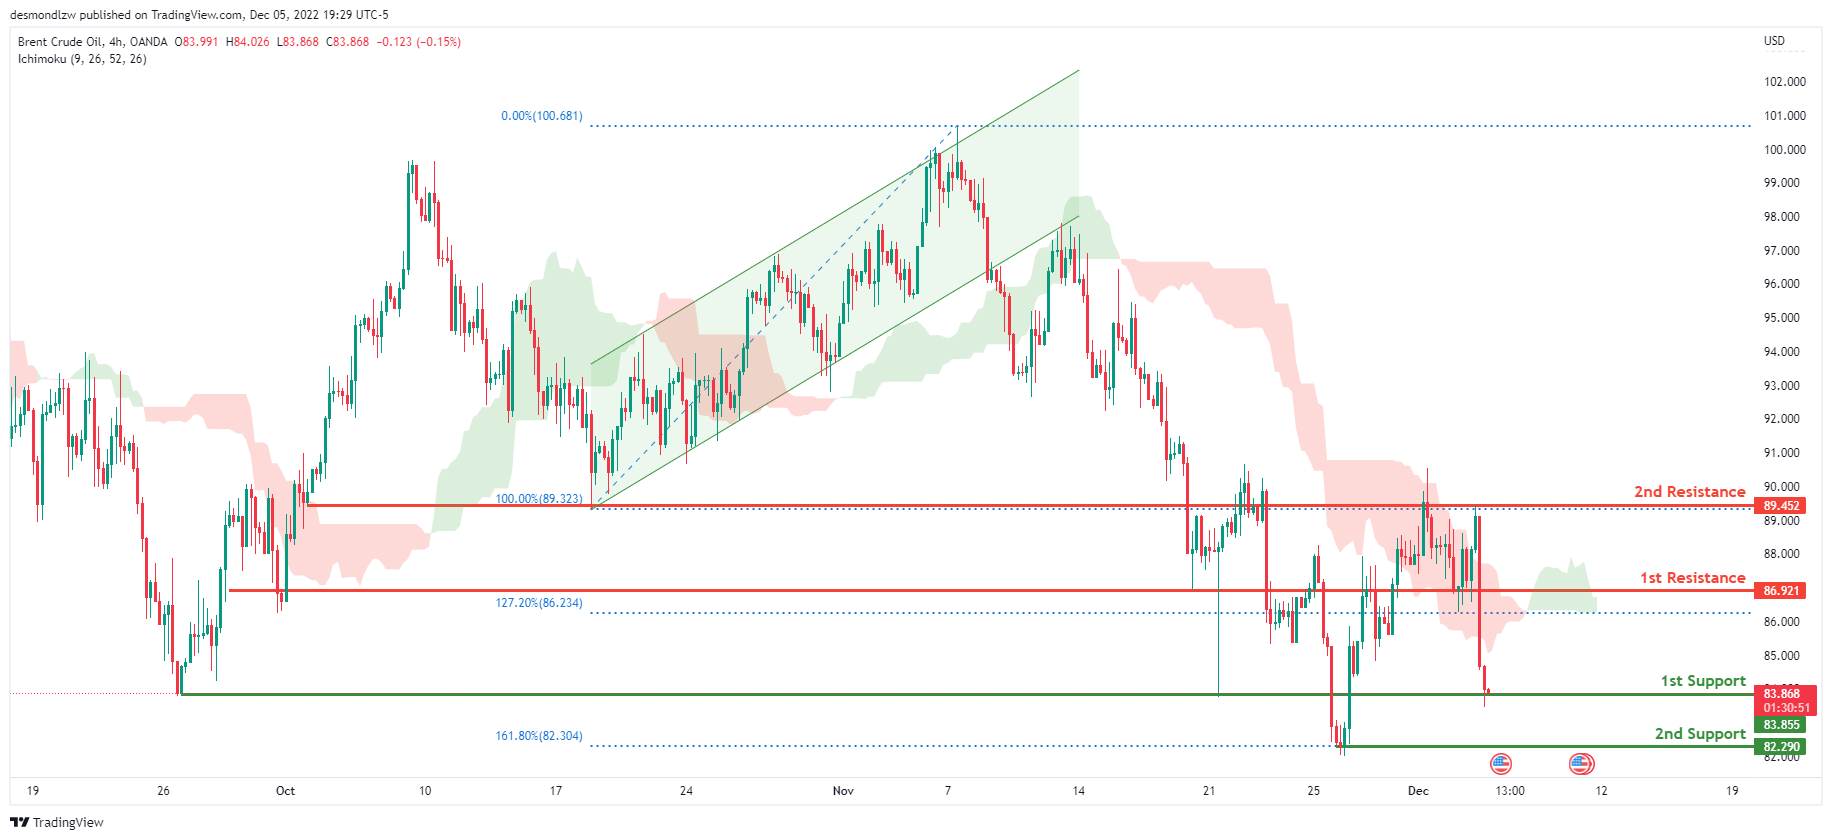
OIL:
Looking at the H4 chart, my overall bias for BCOUSD is bearish due to the current price being below the Ichimoku cloud, indicating a bearish market. If this bearish momentum continues, expect price to possibly break the 1st support at 83.855, where the previous swing low is before heading towards the 2nd support at 82.290, where the previous swing low and 161.8% Fibonacci expansion line are. In an alternate scenario, price could possibly head up towards the 1st resistance line at 86.921, where the 127.2% Fibonacci extension line is located.
Areas of consideration:
- H4 time frame, 1st resistance at 86.921
- H4 time frame, 1st support at 83.855
- H4 time frame, 2nd support at 82.290
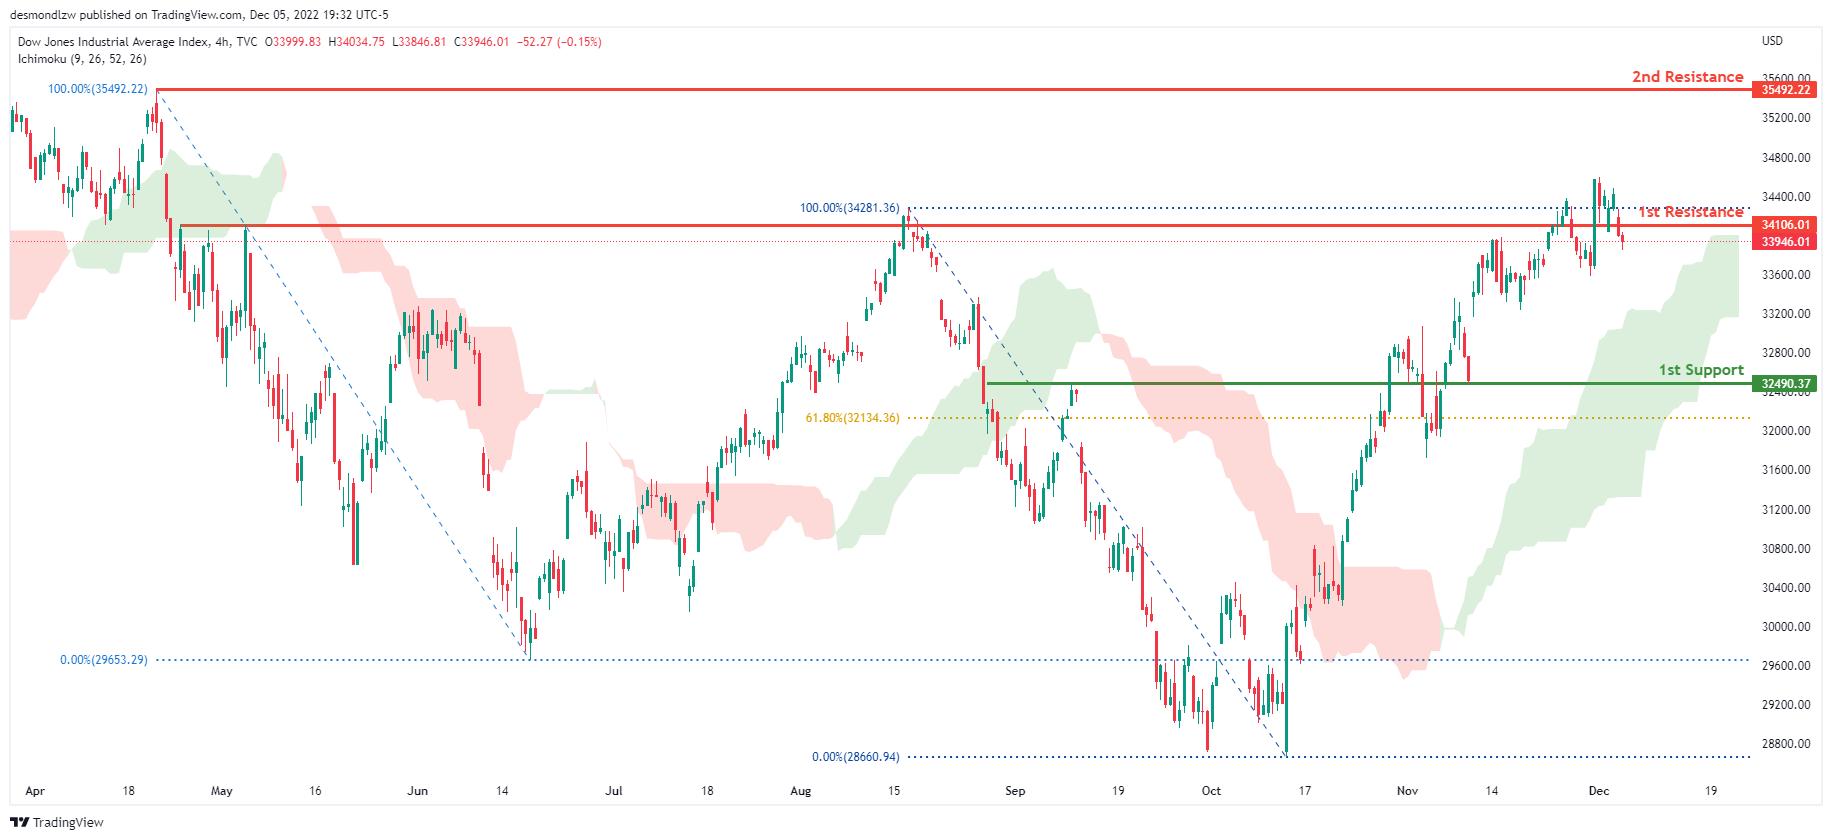
Dow Jones Industrial Average:
On the H4 chart, the overall bias for DJI is bullish. To add confluence to this, the price is above the Ichimoku cloud which indicates a bullish market. If this bullish momentum continues, expect the price to continue heading towards the 1st resistance line at 34106.01, where the previous swing high is. In an alternative scenario, price could head back down towards the 1st support at 32490.37, where the 61.8% Fibonacci line is.
Areas of consideration:
- H4 time frame, 1st support at 32490.37
- H4 time frame, 1st Resistance at 34106.01
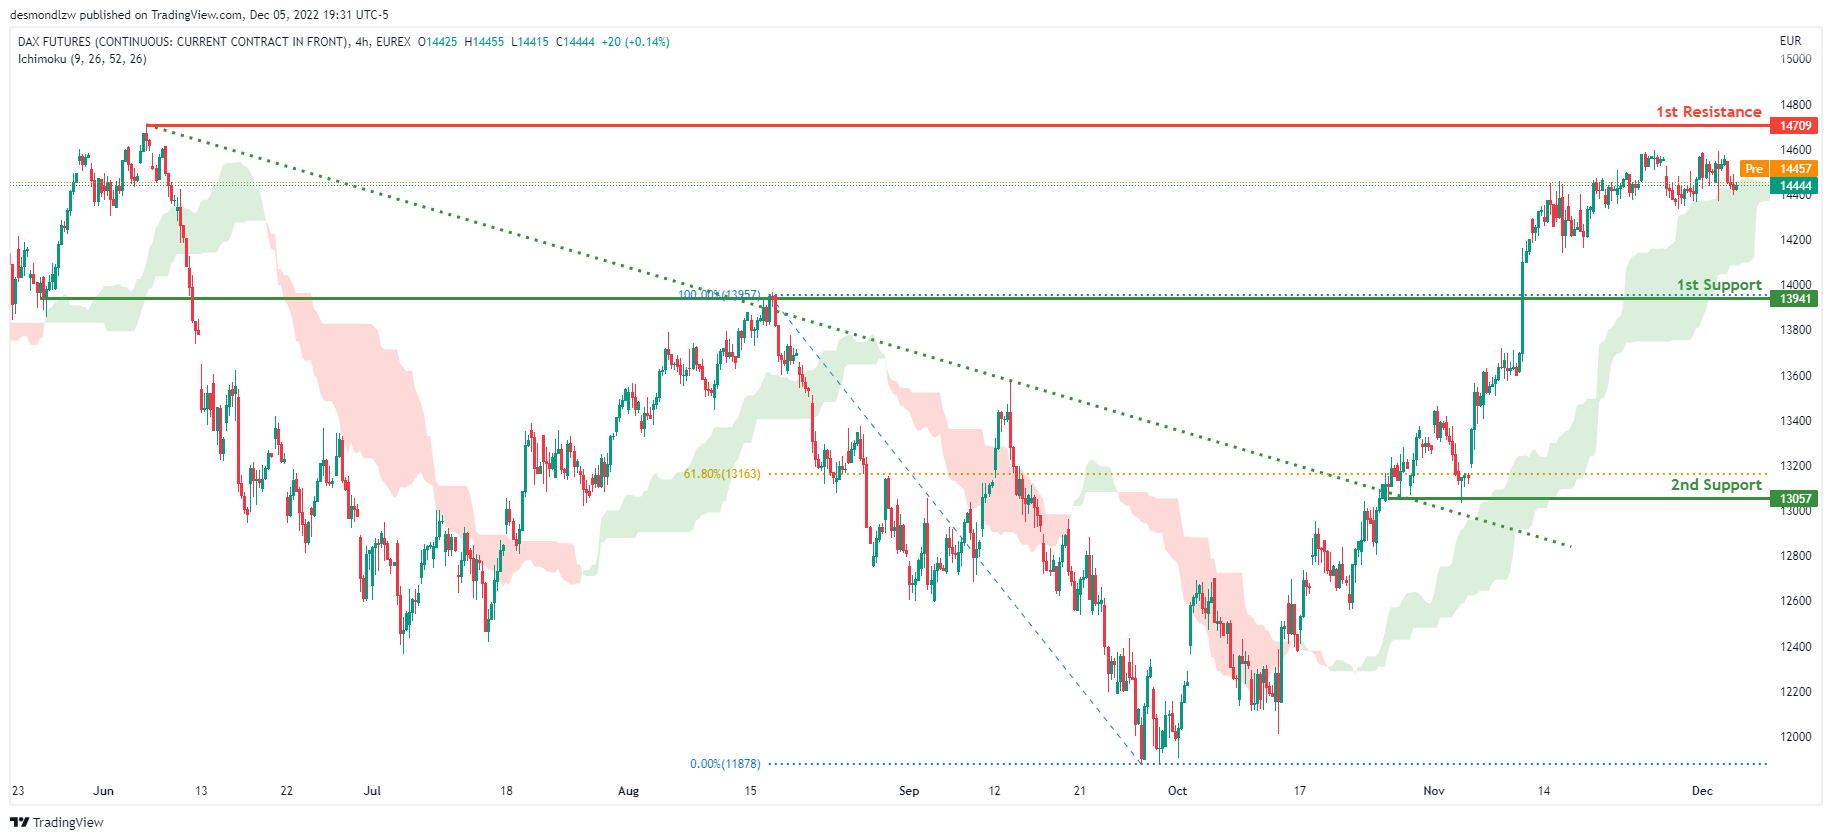
DAX:
The H4 chart shows a bullish bias, with price breaking through the descending trendline and rising above the Ichimoku cloud. Price is expected to maintain its bullish momentum and rise to the first resistance level at 14709, where the previous swing high is located. Alternatively, the price could fall to the first support level at 13941, where the previous swing high was.
Areas of consideration:
- H4 time frame, 1st resistance is at 14709
- H4 time frame, 1st support is at 13941
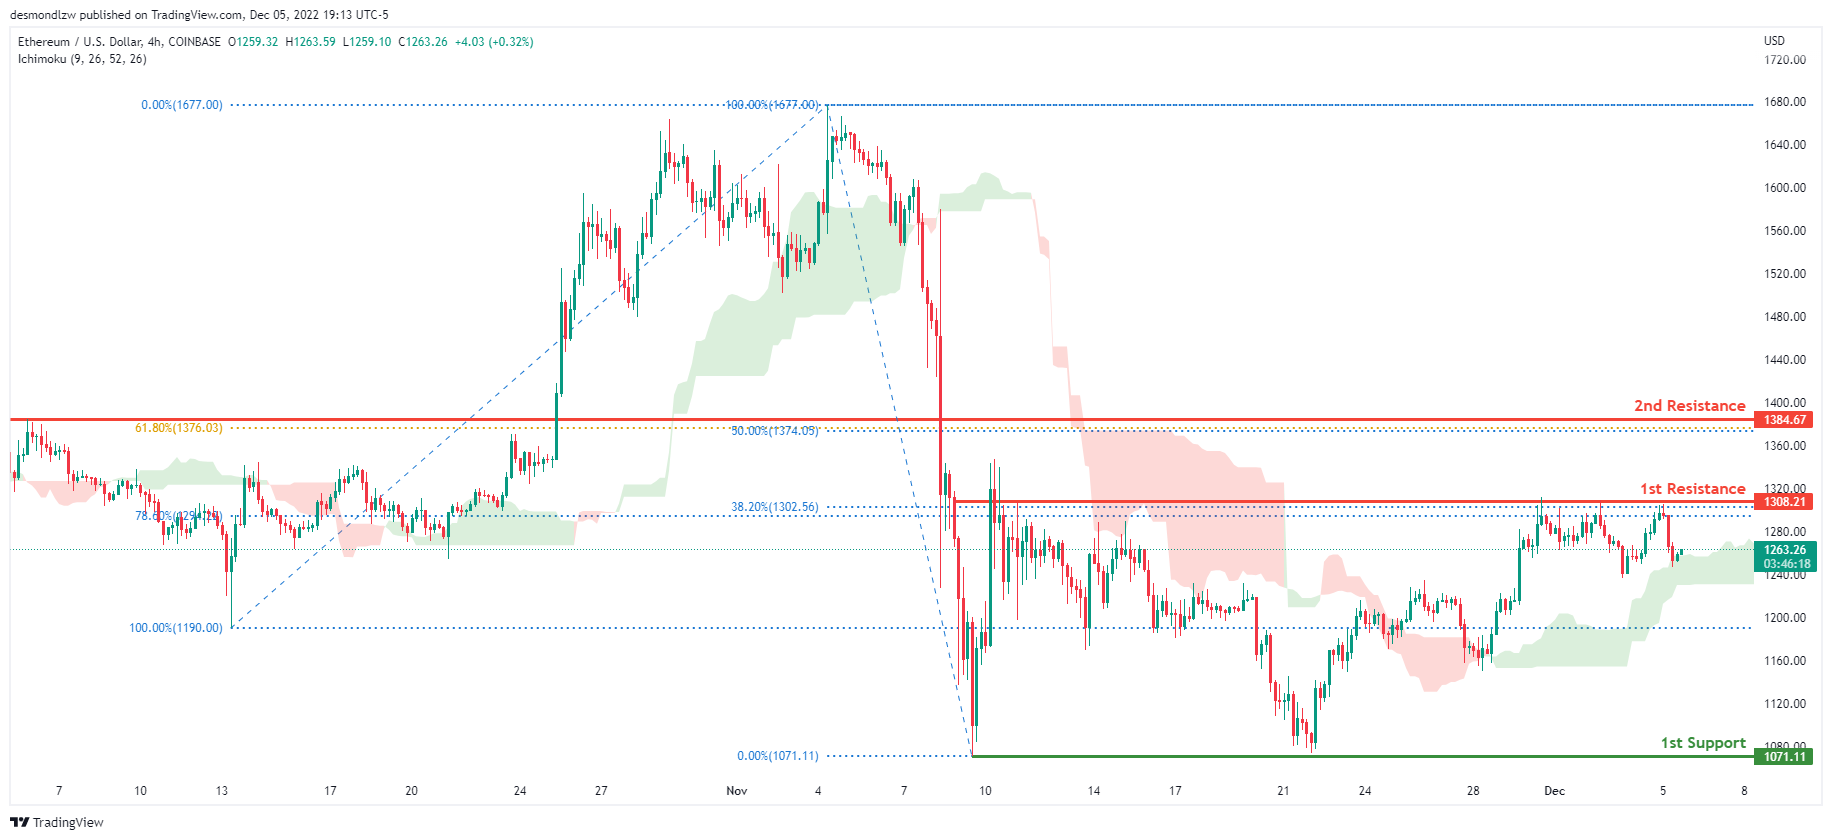
ETHUSD:
On the H4 chart, the overall bias for ETHUSD is bearish. However, the price is now above the Ichimoku cloud which might indicate a short-term shift to a bullish market. Expecting price to possibly break the 1st resistance at 1308.21, where the 38.2% and 78.6% Fibonacci lines are before heading towards the 2nd resistance line at 1384.67, where the 50% and 61.8% Fibonacci lines are. In an alternative scenario, price could possibly head back down towards the 1st support at 1071.11, where the previous swing low is.
Areas of consideration:
- H4 time frame, 1st resistance of 1308.21
- H4 time frame, 2nd resistance of 1384.67
- H4 time frame, 1st support at 1071.11
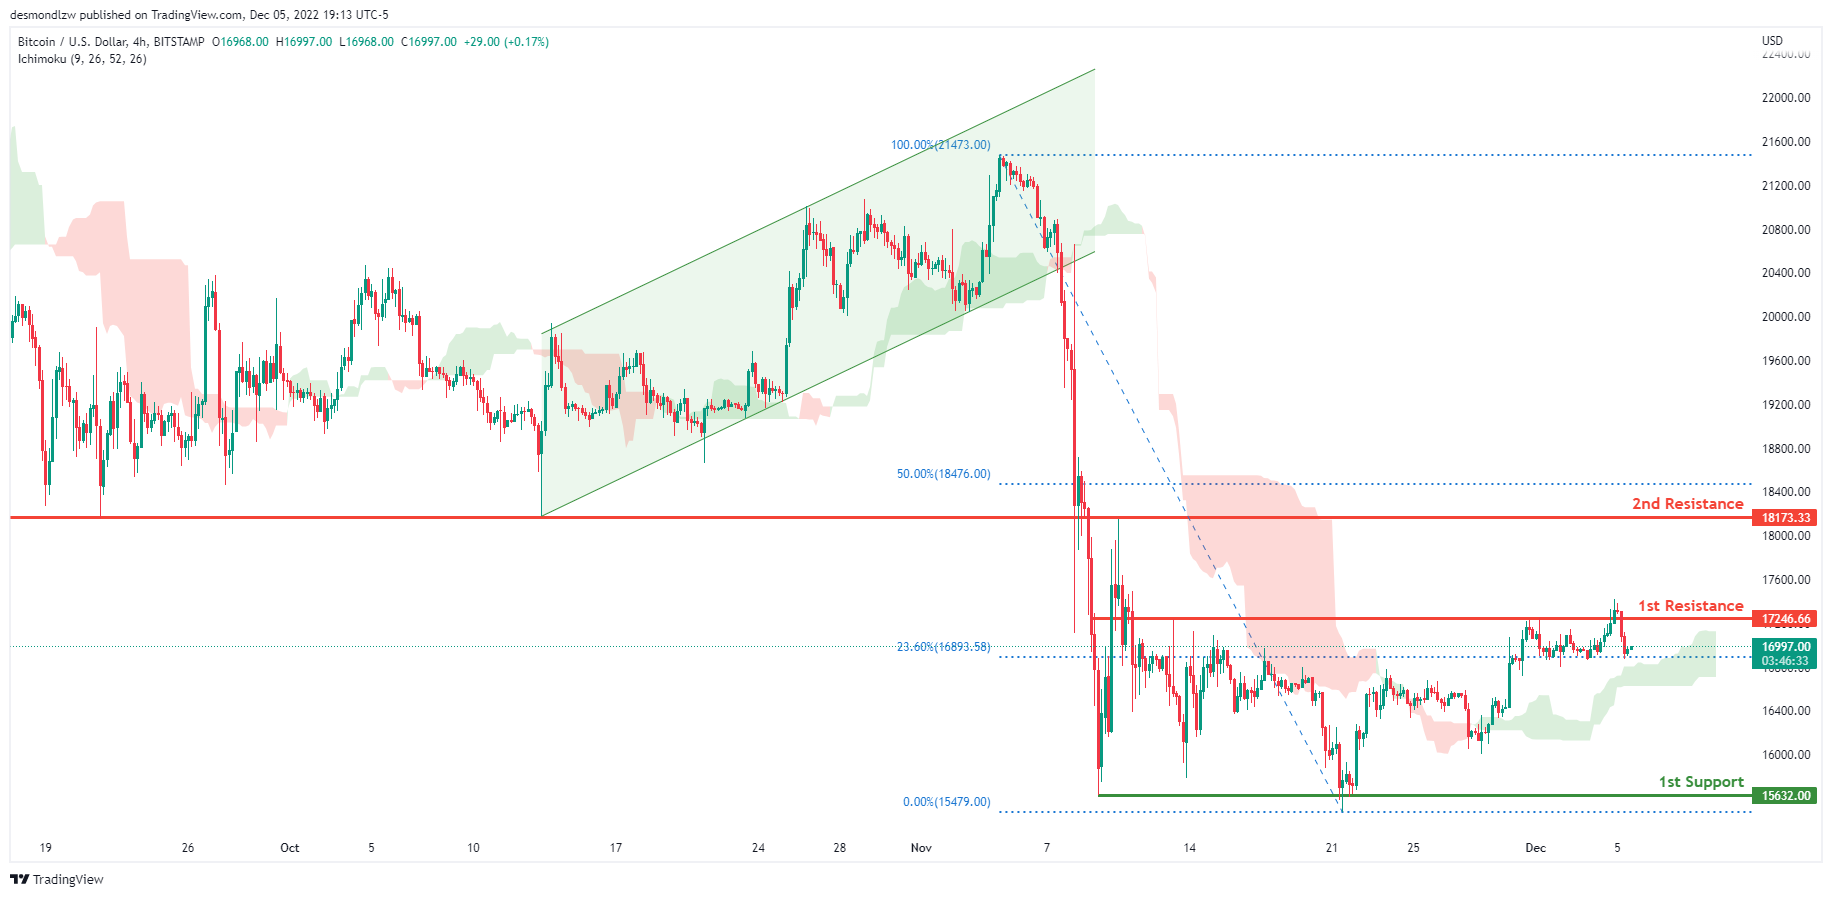
BTCUSD:
On the H4 chart, the overall bias for BTCUSD is bearish. However, the price is now above the Ichimoku cloud which might indicate a short-term shift to a bullish market. Expecting price to possibly break the 1st resistance at 17246.66, where the 23.6% Fibonacci line is before heading towards the 2nd resistance line at 18173.33, where the previous swing low is and 50% Fibonacci line are. In an alternative scenario, price could possibly head back down towards the 1st support at 15632.00, where the previous swing low is.
Areas of consideration:
- H4 time frame, 1st resistance 17246.66
- H4 time frame, 2nd resistance 18173.33
- H4 time frame, 1st support at 15632.00
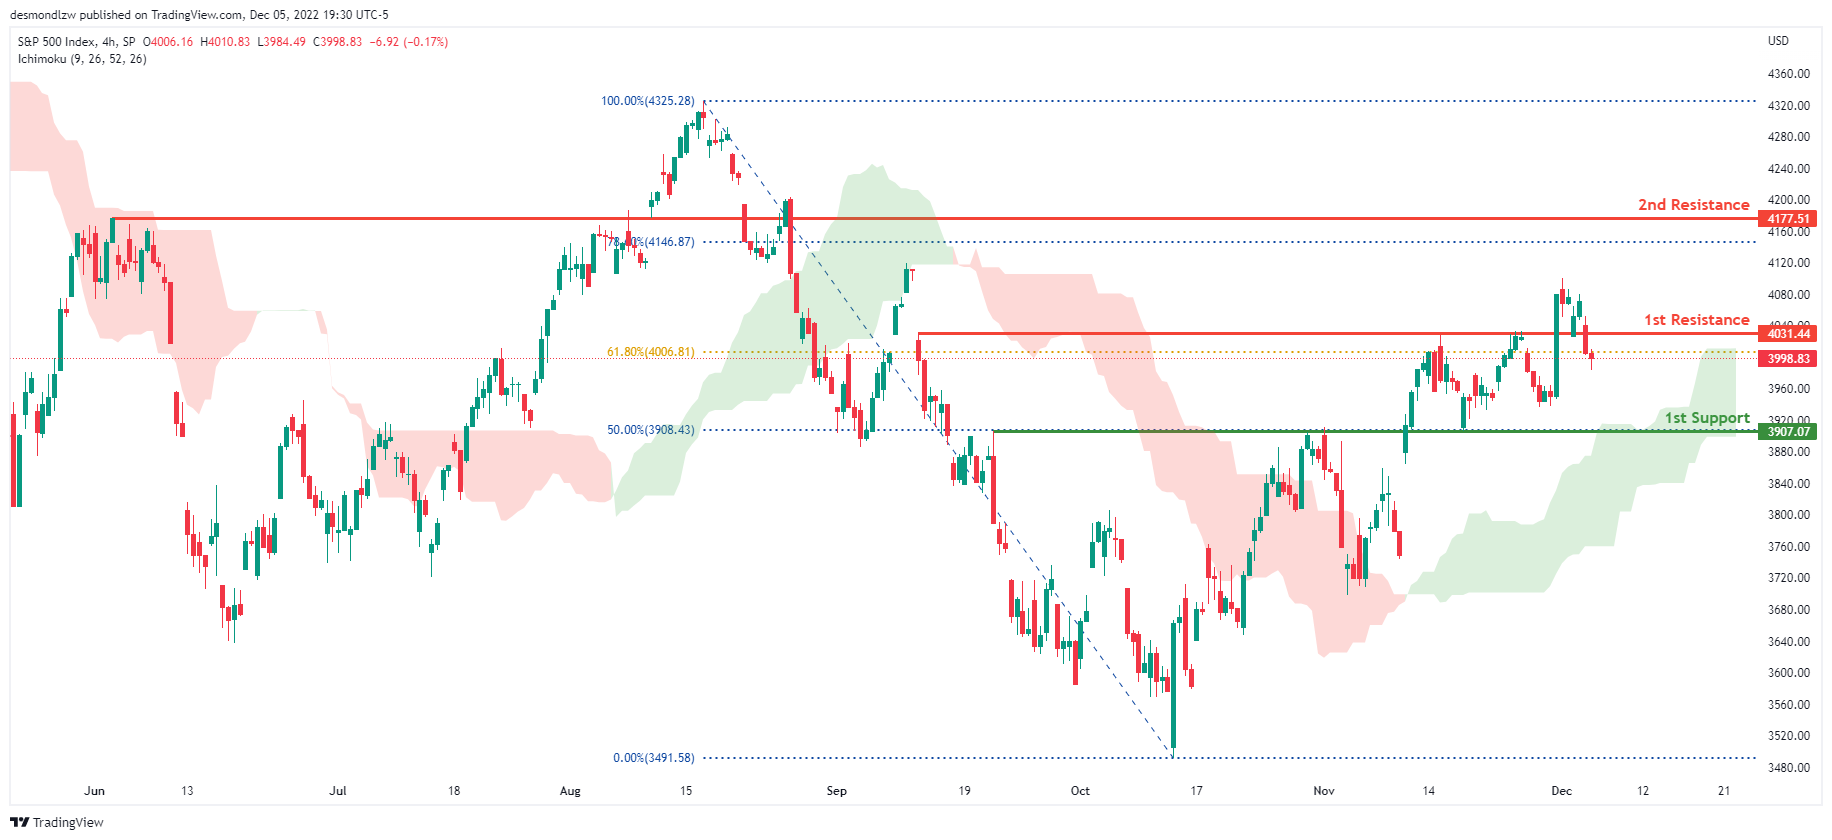
S&P 500:
The overall bias for the S&500 on the H4 chart is bullish, with prices above the Ichimoku cloud. If the bullish momentum continues, the expected price to head towards the 1st resistance line is at 4031.44, where the 61.8% Fibonacci line is located. In an alternate scenario, price could return to the 1st support line at 3907.07, where the 50% Fibonacci line is located.
Areas of consideration:
- H4 time frame, 1st support at 3907.07
- H4 time frame, 1st resistance at 4031.44


