
The WTI oil remains at the back foot for the third consecutive day and extends weakness in early European trading on Thursday.
The latest reports showed fresh surge in Covid cases in China, just days after the government eased its strict policies that darkened the outlook and optimism about faster demand recovery.
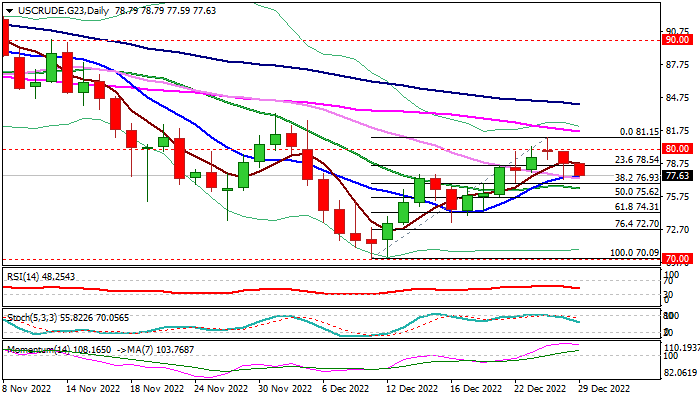
The two-legged recovery from Dec 9 $70.09 low (the lowest in one year) failed to sustain break through pivotal barriers at $80.00/$80.20 (psychological / Fibo 76.4% of $83.32/$70.09 bear-leg), leaving a bull-trap pattern and generating an initial signal of reversal.
Subsequent acceleration lower completed Doji evening star reversal pattern on daily chart, which added to negative signals.
Technical studies on daily chart contribute to weakening near-term structure as bullish momentum is fading and stochastic is heading south after forming a bearish divergence and emerging from overbought territory.
Fresh bears face pivotal supports at: $77.25 (daily Tenkan-sen); $76.93 (Fibo 38.2% of $70.09/$81.15) and $76.70 (daily Kijun-sen) where headwinds could be anticipated, but firm break would open way for deeper fall.
On the other hand, failure to break these supports would point to a healthy correction of recovery from $70.09 and keep larger bulls in play for renewed attack at $80.00/$80.20 pivots.
Res: 78.54; 78.79; 80.00; 81.15
Sup: 77.25; 76.93; 76.70; 75.62


