
Hello fellow traders. In this technical blog we’re going to take a quick look at the Elliott Wave charts of OIL Futures ( $CL_F). As our members know, OIL has already reached the extremes from the March 2022 peak at 86.29-63.36 area. The commodity made reaction from there. However shortly after we got break of Sep 26 low, which makes cycle from the June peak incomplete and calling for potential extension within bonus time. Recently OIL made short term recovery that unfolded as Wave Zig Zag Pattern. In the further text we are going to explain the Elliott Wave Pattern and the Forecast.
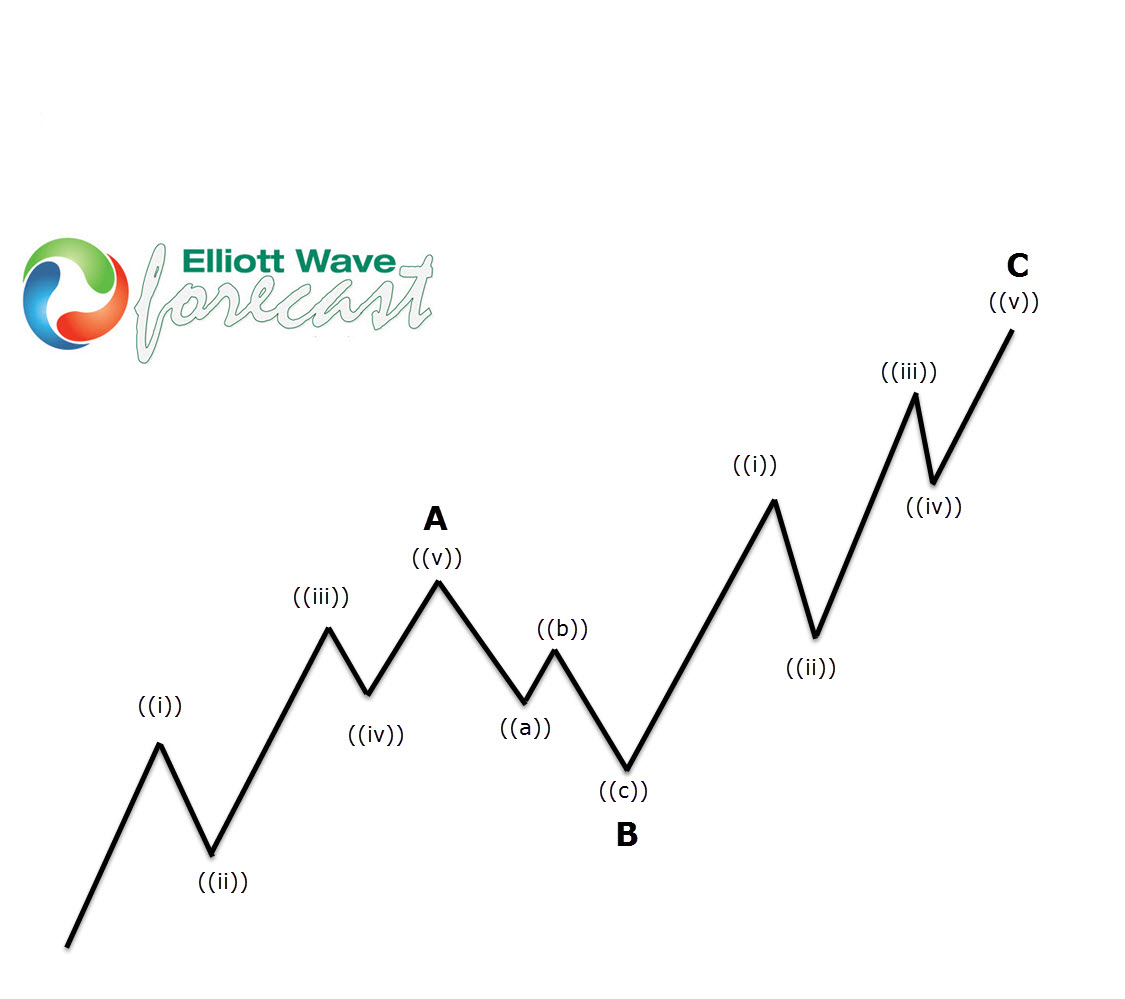
Before we take a look at the real market example, let’s explain Elliott Wave Zigzag pattern.
Elliott Wave Zigzag is the most popular corrective pattern in Elliott Wave theory . It’s made of 3 swings which have 5-3-5 inner structure. Inner swings are labeled as A,B,C where A =5 waves, B=3 waves and C=5 waves. That means A and C can be either impulsive waves or diagonals. (Leading Diagonal in case of wave A or Ending in case of wave C) . Waves A and C must meet all conditions of being 5 wave structure, such as: having RSI divergency between wave subdivisions, ideal Fibonacci extensions and ideal retracements.
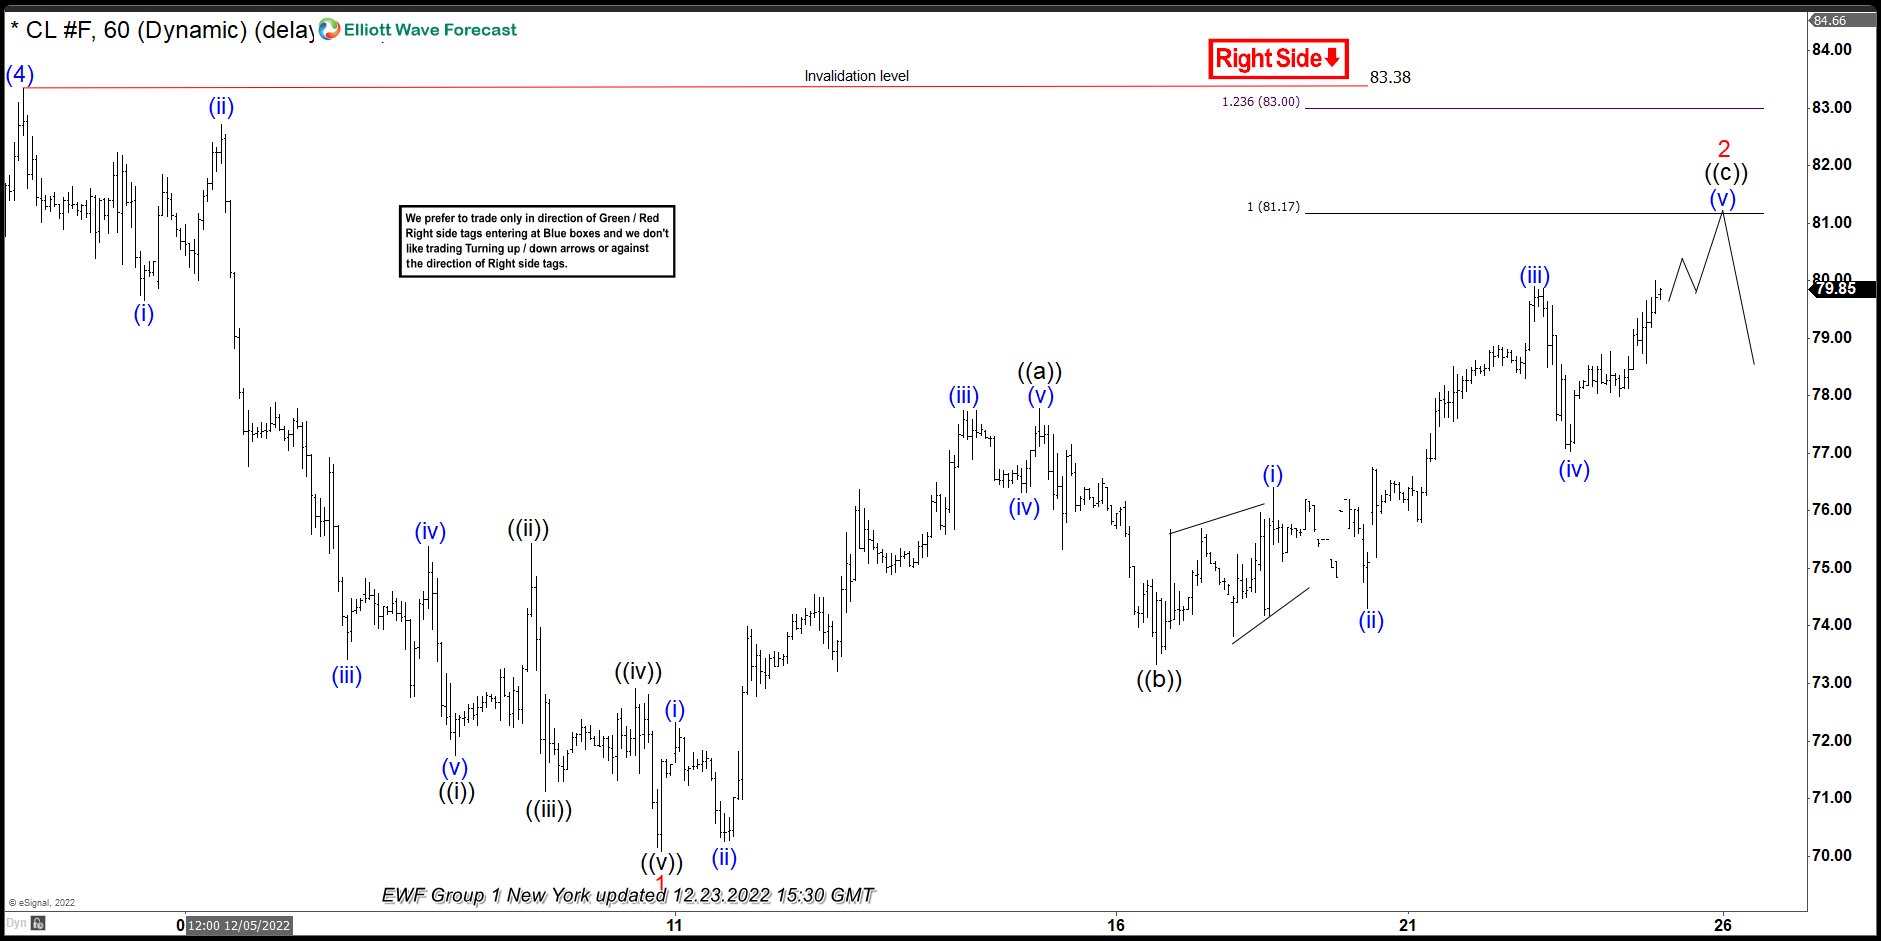
OIL H1 Elliott Wave Analysis 12.23.2022
OIL is doing correction against the 83.38 peak. As the first leg of correction has 5 waves structure, we assume recovery is having form of Elliott Wave Zig Zag. The price showing higher high sequences from 12.09. low, calling for more upside in short term. Besides that ((c)) leg looks incomplete, missing another leg up to have 5 waves. Consequently we expect to get more short term strength toward 81.17-83.0 area ( sellers zone). At that zone we expect sellers to appear for further decline or for a 3 waves pull back at least.
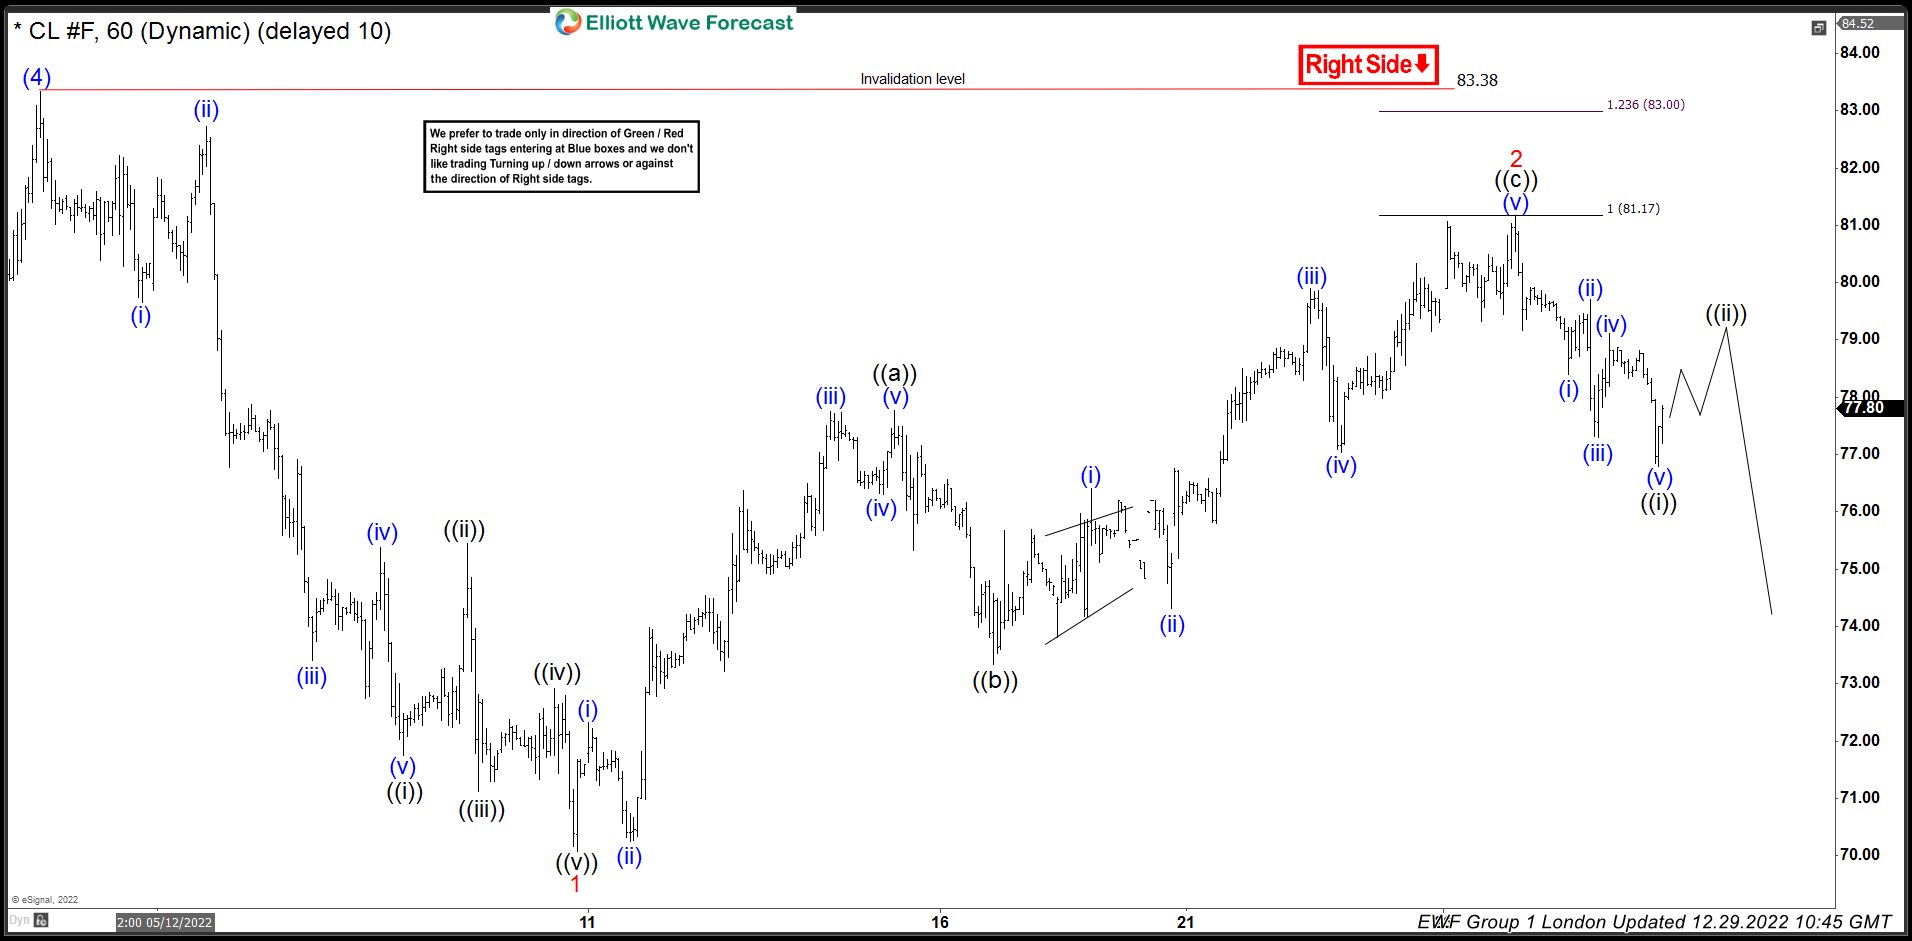
OIL H1 Elliott Wave Analysis 12.29.2022
OIL made another leg up as we expected and reached sellers area at 81.17-83.0. The commodity made decent reaction from the marked zone, which reached and exceeded 50 fibs against the ((b)) connector. As a result any short trades from the marked zone should be risk free+ partial profit taken. While below 81.17 peak we see 2 red completed. Otherwise break of that high would make 83.38 pivot more vulnerable.
Keep in mind market is dynamic and presented view could have changed in the mean time. You can check most recent charts in the membership area of the site. Best instruments to trade are those having incomplete bullish or bearish swings sequences.We put them in Sequence Report and best among them are shown in the Live Trading Room.


