
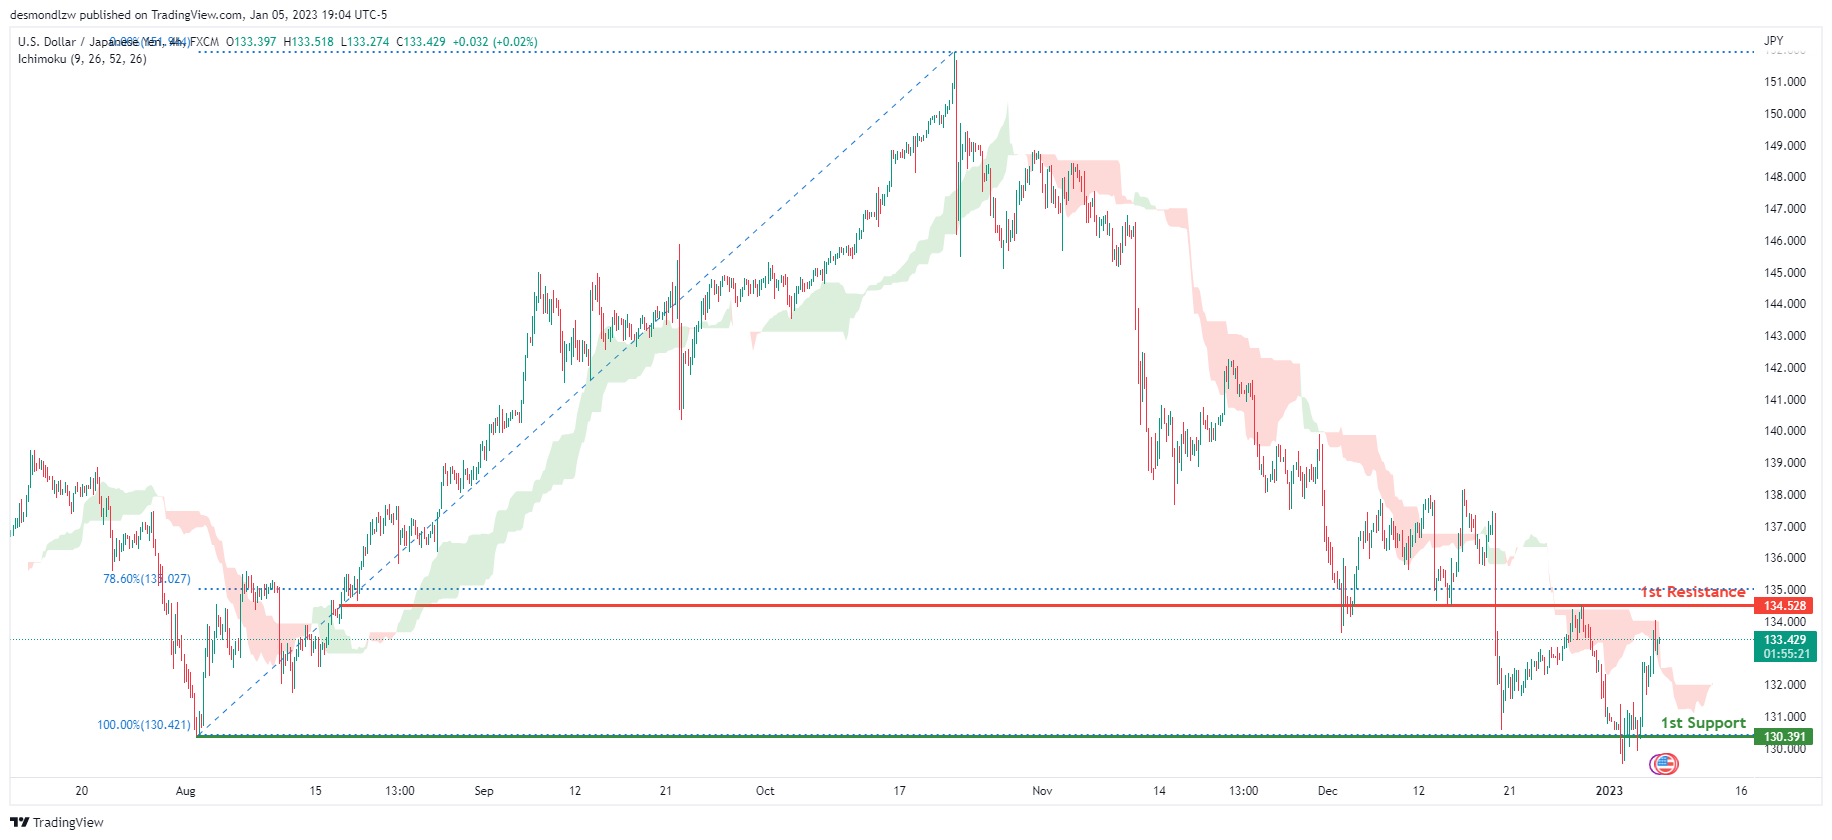
USD/JPY:
Looking at the H4 chart, my overall bias for USDJPY is bearish due to the current price being below the Ichimoku cloud, indicating a bearish market. If this bearish momentum continues, expect price to possibly continue heading towards the 1st support at 130.391, where the previous swing low is. In an alternate scenario, price could possibly head back up towards the 1st resistance level at 134.528, where the 78.6% Fibonacci line is.
Areas of consideration:
- H4 time frame, 1st resistance at 134.528
- H4 time frame, 1st support at 130.391
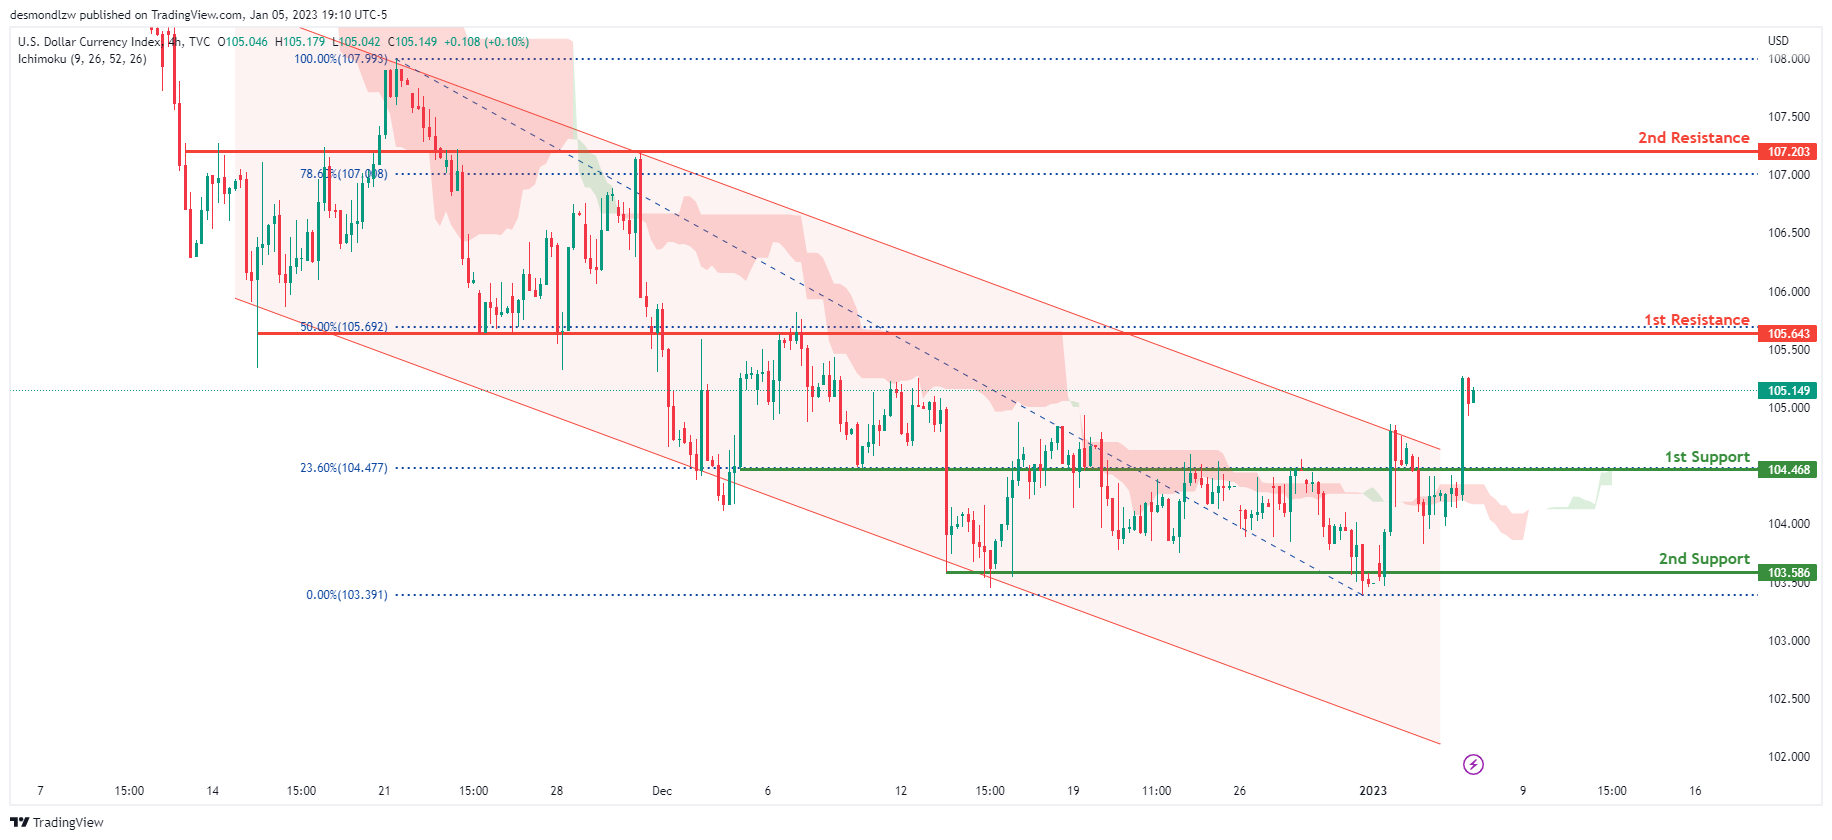
DXY:
On the H4 chart, the overall bias for DXY is bullish. To add confluence to this, price is above the ichimoku cloud with the price breaking out of the descending channel which indicates a bullish market. If this bullish momentum continues, expect the price to possibly continue heading towards the 1st resistance at 105.643, where the 50% Fibonacci line is. In an alternative scenario, price could head back down to retest the 1st support at 104.468, where the 23.6% Fibonacci line is.
Areas of consideration:
- H4 time frame, 1st resistance at 105.643
- H4 time frame, 1st support at 104.468
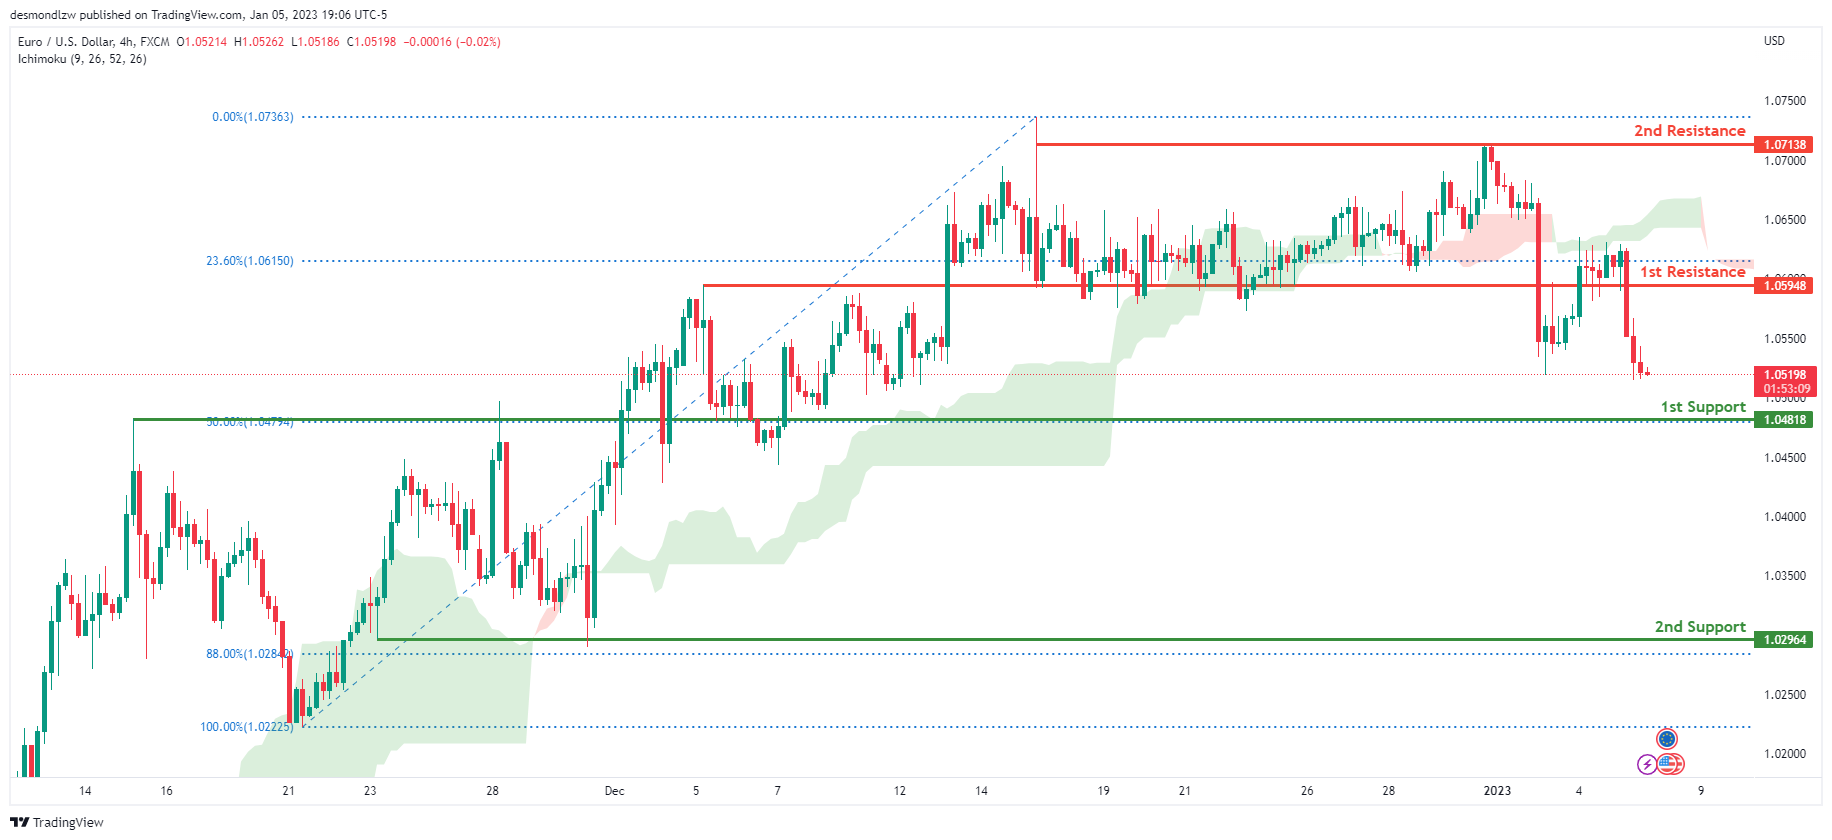
EUR/USD:
Looking at the H4 chart, my overall bias for EURUSD is bearish due to the current price being below the Ichimoku cloud, indicating a bearish market. If this bearish momentum continues, expect the price to possibly head towards the 1st support at 1.04818, where the 50% Fibonacci line is. In an alternate scenario, price could possibly head back up towards the 1st resistance level at 1.05948, where the 23.6% Fibonacci line is.
Areas of consideration :
- H4 1st resistance at 1.05948
- H4 1st support at 1.04818
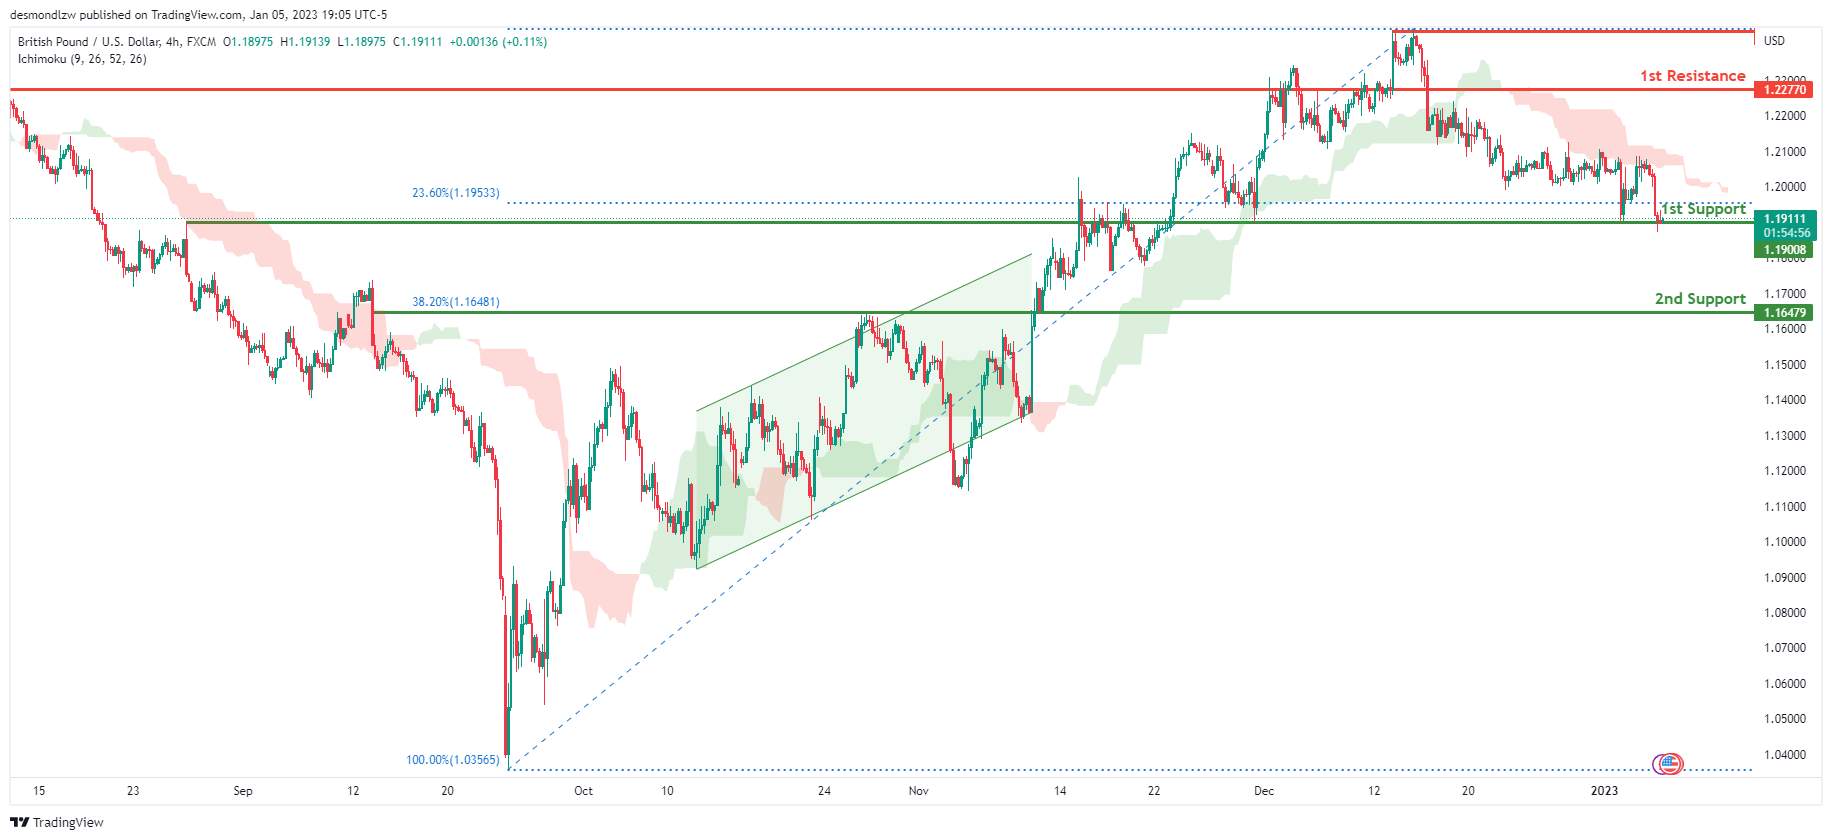
GBP/USD:
Looking at the H4 chart, my overall bias for GBPUSD is bearish due to the current price being below the Ichimoku cloud, indicating a bearish market. If this bearish momentum continues, expect price to possibly break the 1st support at 1.19008, where the 23.6% Fibonacci line is, before heading towards the 2nd support at 1.16479, where the 38.2% Fibonacci line is. In an alternate scenario, price could possibly head back up to break the 1st resistance level at 1.22770, where the previous swing high is before heading towards the 2nd support at 1.16479, where the 38.2% Fibonacci line is.
Areas of consideration:
- H4 1st resistance at 1.22770
- H4 1st support at 1.19008
- H4 2nd support at 1.16479
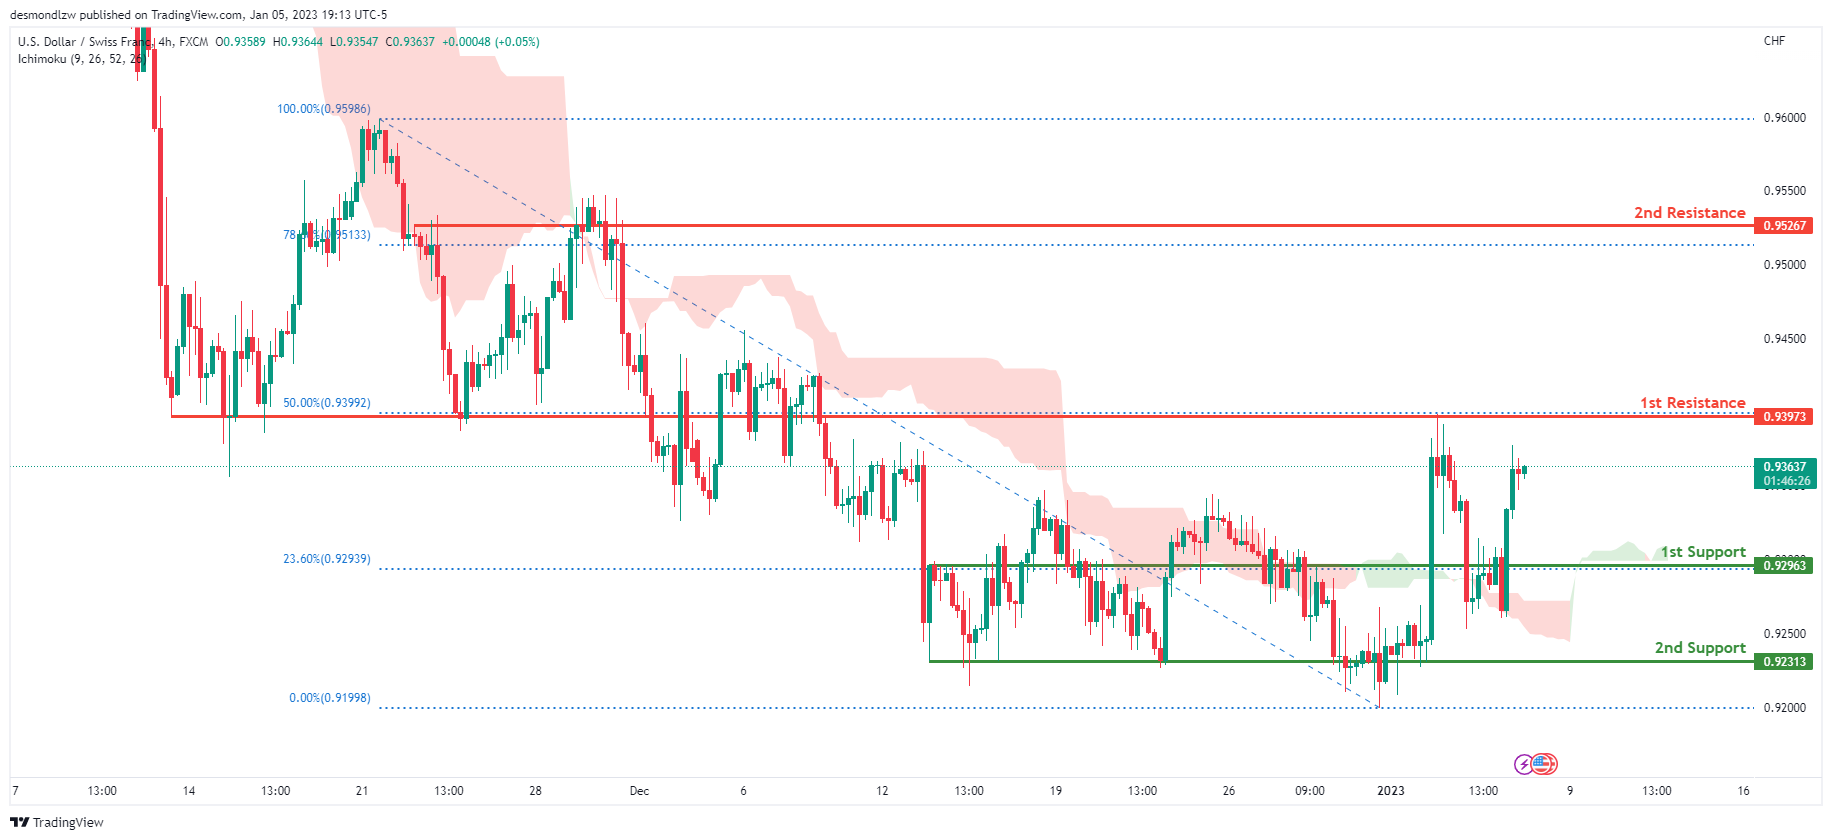
USD/CHF:
Looking at the H4 chart, my overall bias for USDCHF is bullish due to the current price being above the Ichimoku cloud, indicating a bullish market. If the current bullish trend continues, expect the price to head back up towards the 1st resistance line at 0.93973, where the 50% Fibonacci line is. In an alternative scenario, price could possibly head back down to retest the 1st support at 0.92963, where the 23.6% Fibonacci line is.
Areas of consideration
- H4 1st support at 0.92963
- H4 1st resistance at 0.93973
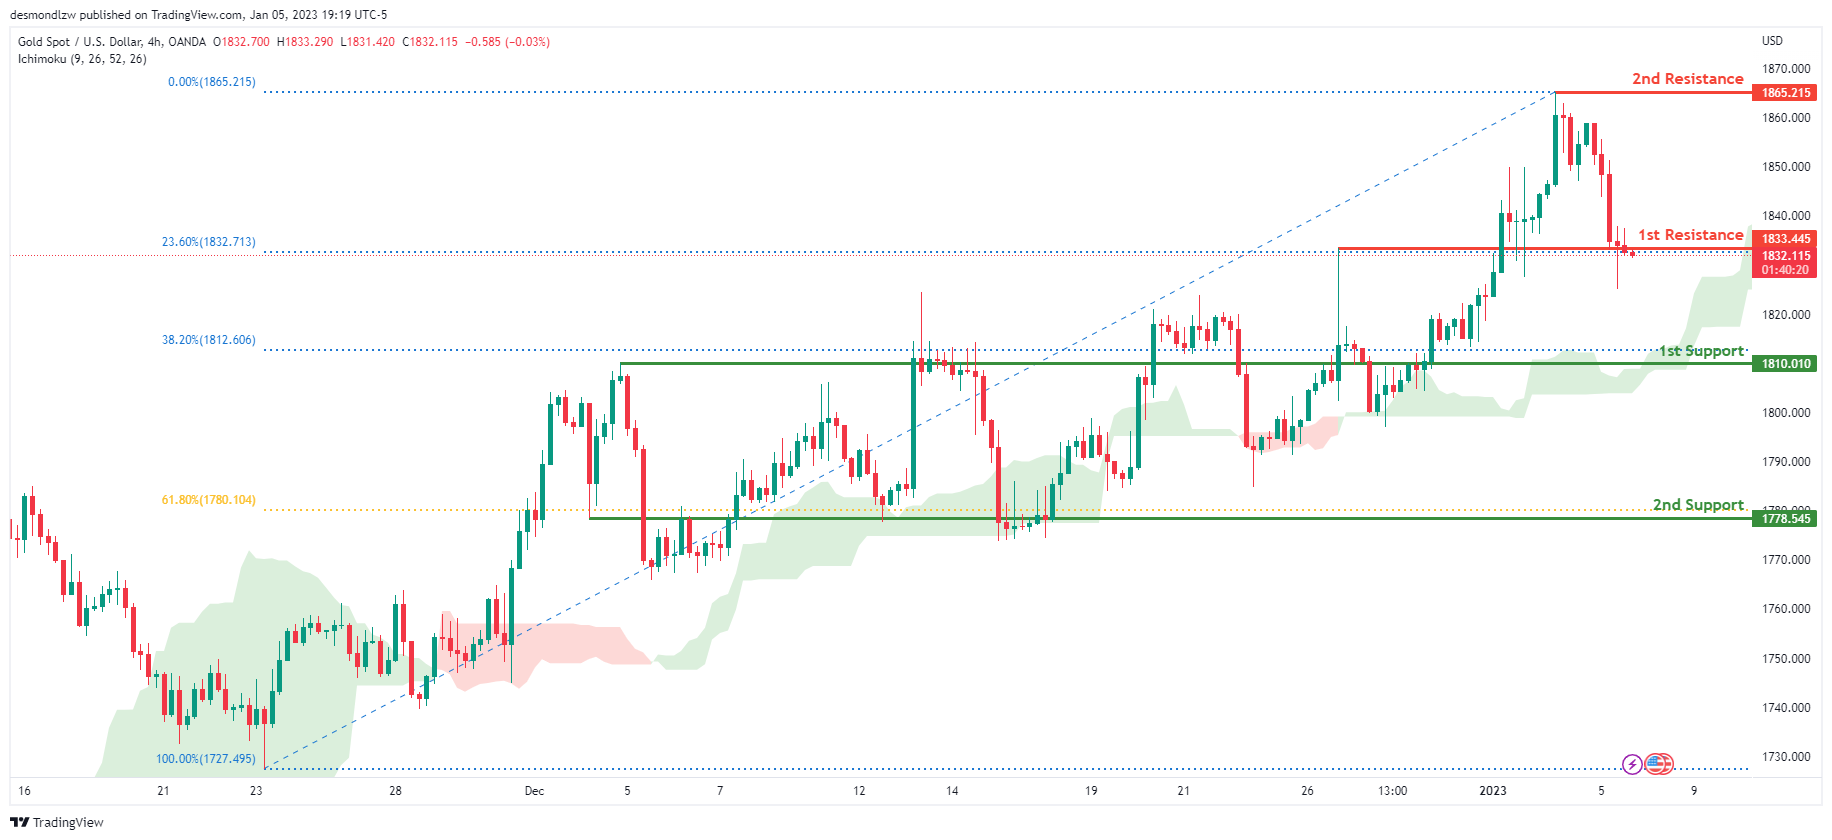
XAU/USD (GOLD):
Looking at the H4 chart, my overall bias for XAUUSD is bullish due to the current price crossing above the Ichimoku cloud, indicating a bullish market. If this bullish momentum continues, expect the price to possibly break the 1st resistance at 1833.445, where the 23.6% Fibonacci line is, before heading towards the 2nd resistance at 1865.215 where the recent high is. In an alternative scenario, price could possibly head back down towards the 1st support at 1810.010, where the 38.2% Fibonacci line is.
Areas of consideration:
- H4 time frame, 1st resistance at 1833.445
- H4 time frame, 2nd resistance at 1865.215
- H4 time frame, 1st support at 1810.010
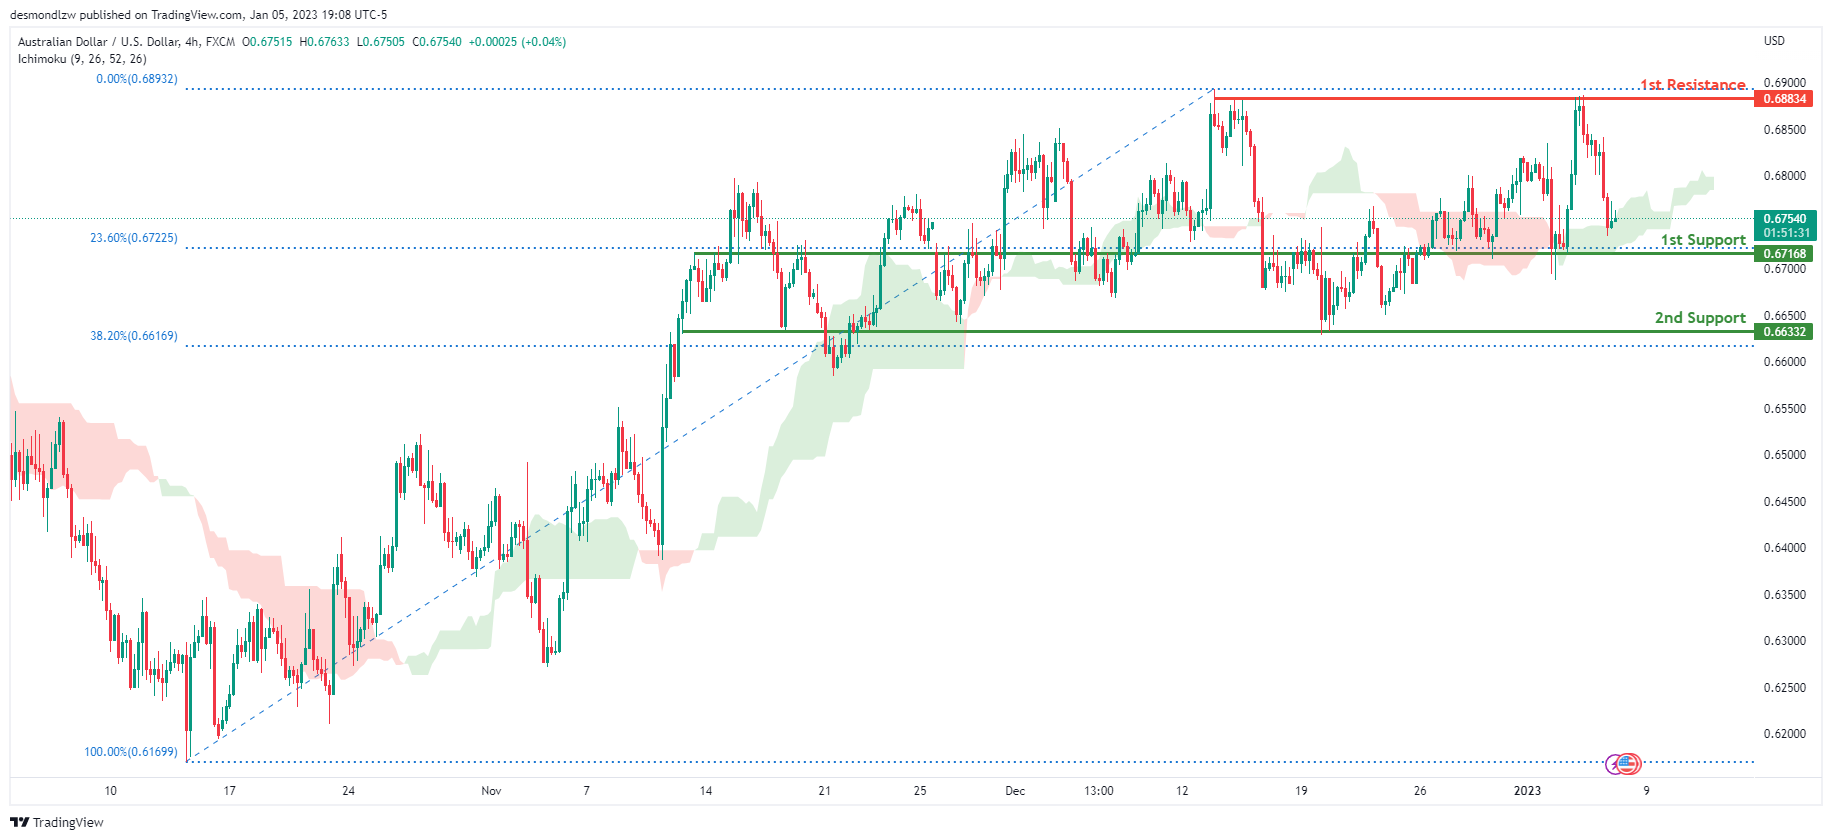
AUD/USD:
Looking at the H4 chart, my overall bias for AUDUSD is bullish due to the current price being above the Ichimoku cloud, indicating a bullish market. If this bullish momentum continues, expect the price to possibly head back up towards the 1st resistance at 0.68834, where the recent swing high is. In an alternative scenario, price could possibly head back down breaking the 1st support at 0.67168, where the 23.6% Fibonacci line is, before heading towards the 2nd support at 0.66332, where the 38.2% Fibonacci line is.
Areas of consideration
- H4, 1st resistance at 0.68932
- H4, 1st support at 0.67168
- H4, 2nd support at 0.66332
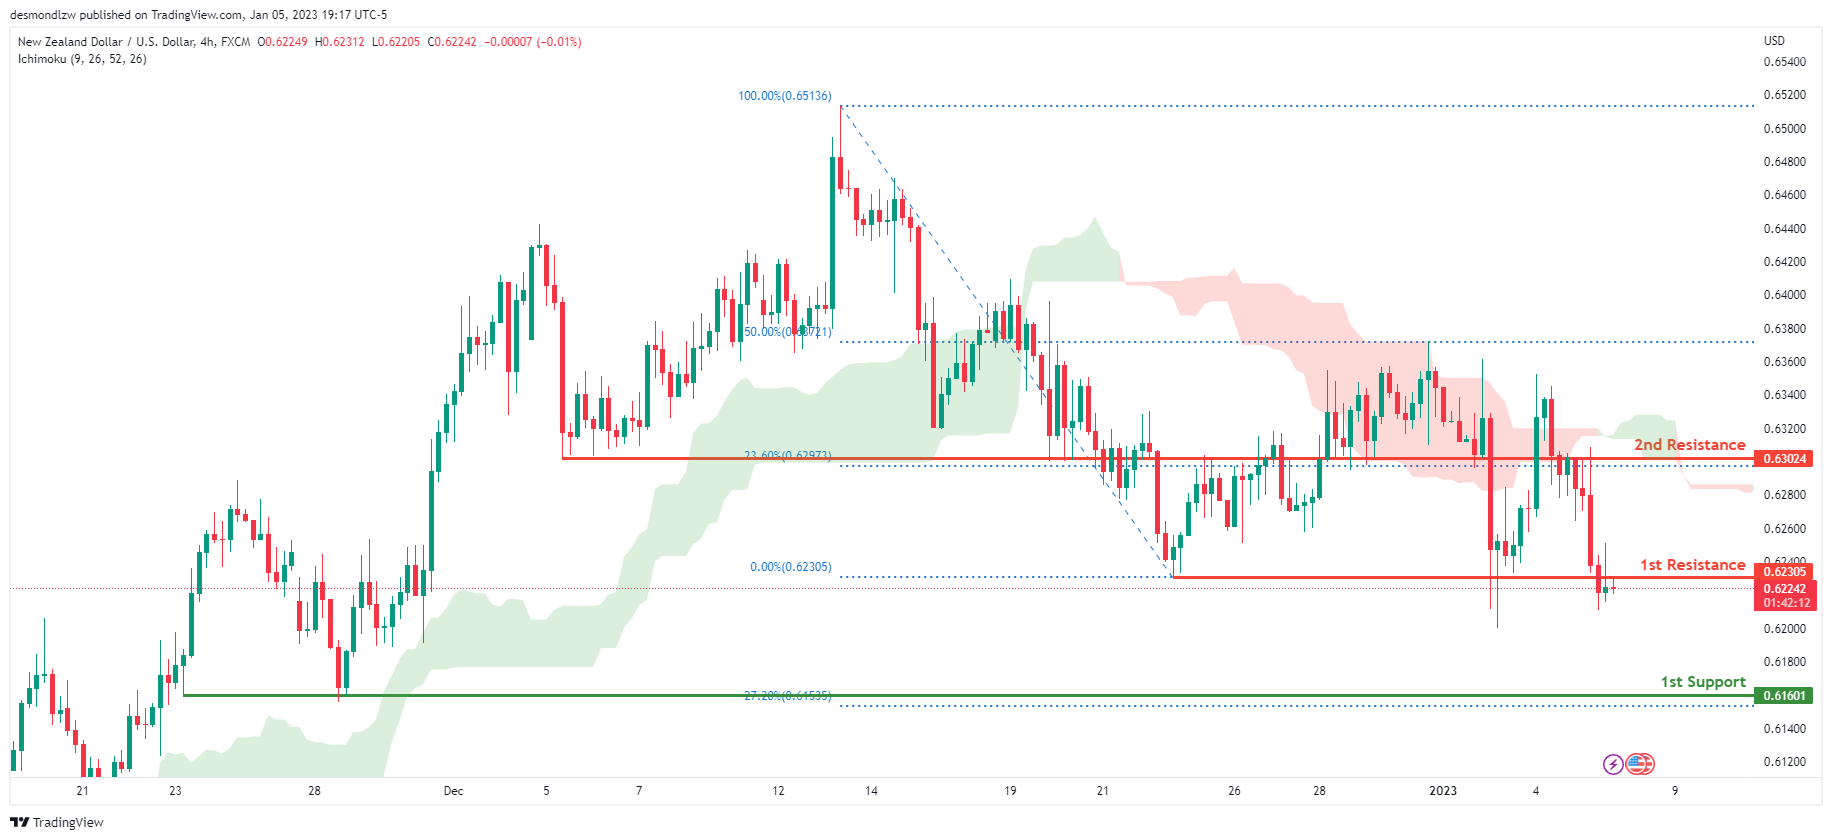
NZD/USD:
Looking at the H4 chart, my overall bias for NZDUSD is bearish due to the current price crossing below the Ichimoku cloud, indicating a bearish market. If this bearish momentum continues, expect price to possibly continue heading towards the 1st support at 0.61601, where the -27.2% Fibonacci line is. In an alternate scenario, price could possibly head back up breaking the 1st resistance level at 0.62305, where the previous swing low is, before heading towards the 2nd resistance at 0.63024, where the 23.6% Fibonacci line is
Areas of consideration:
- H4 time frame, 1st resistance at 0.62305
- H4 time frame, 2nd resistance at 0.63024
- H4 time frame, 1st support at 0.61601
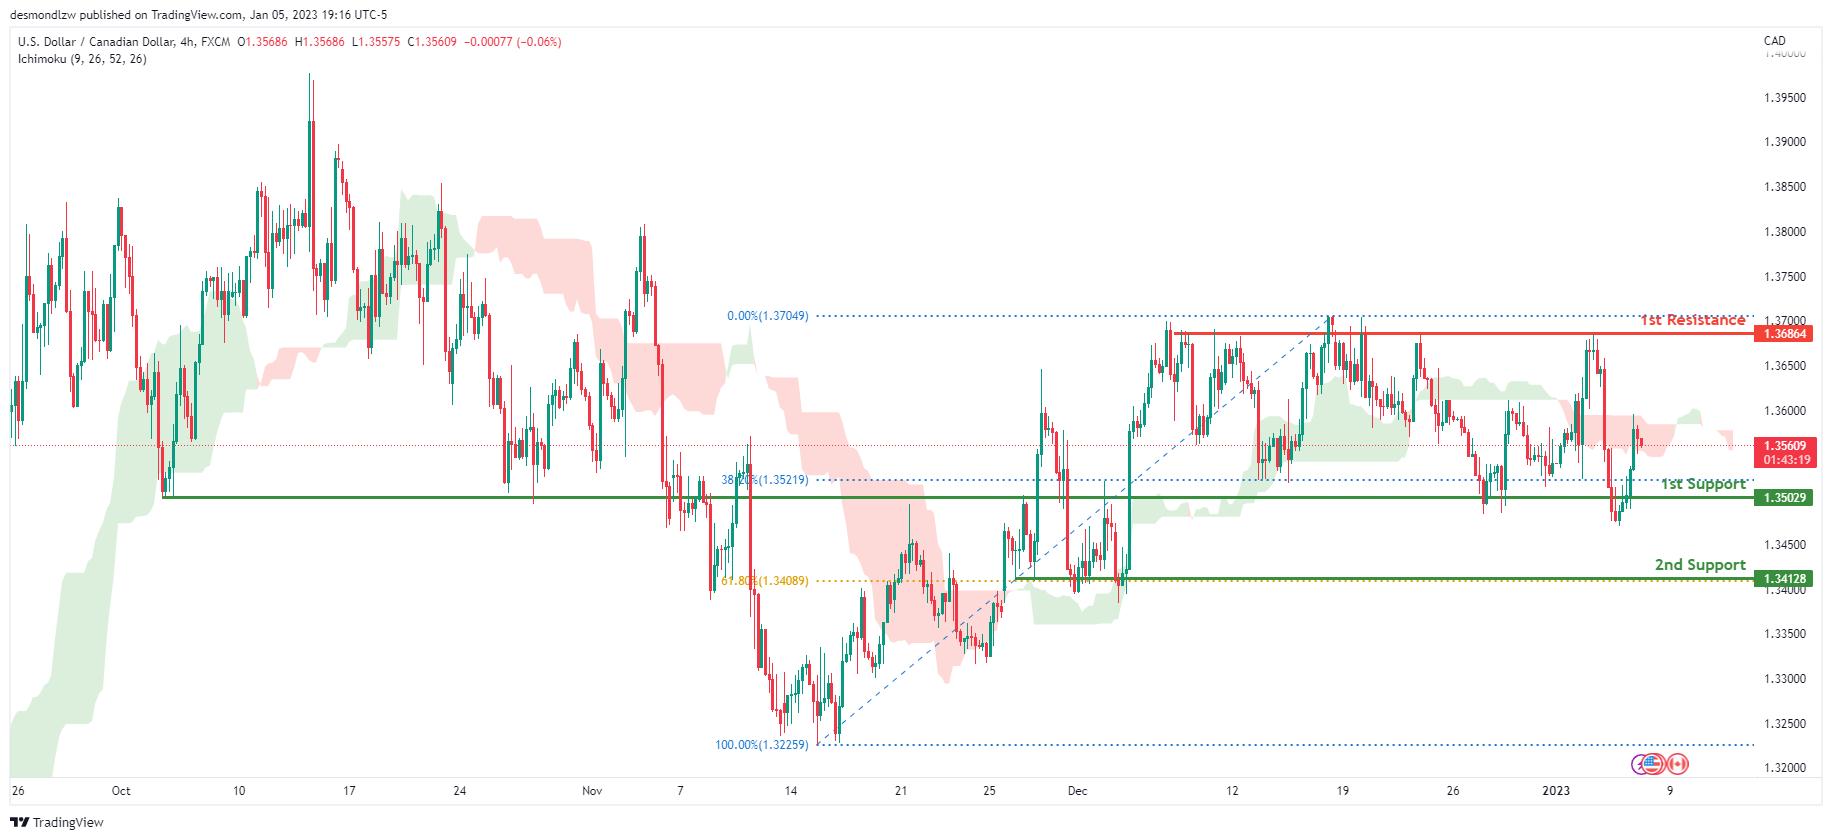
USD/CAD:
On the H4 chart, the overall bias for USDCAD is bearish . To add confluence to this, the price is crossing below the Ichimoku cloud which indicates a bearish market. If this bearish momentum continues, expect the price to possibly head towards the 1st support at 1.35029, where the 38.2% Fibonacci line is. In an alternative scenario, price could head back up towards the 1st resistance at 1.36864, where the previous highs are.
Areas of consideration:
- H4 time frame, 1st resistance at 1.36864
- H4 time frame, 1st support at 1.35029
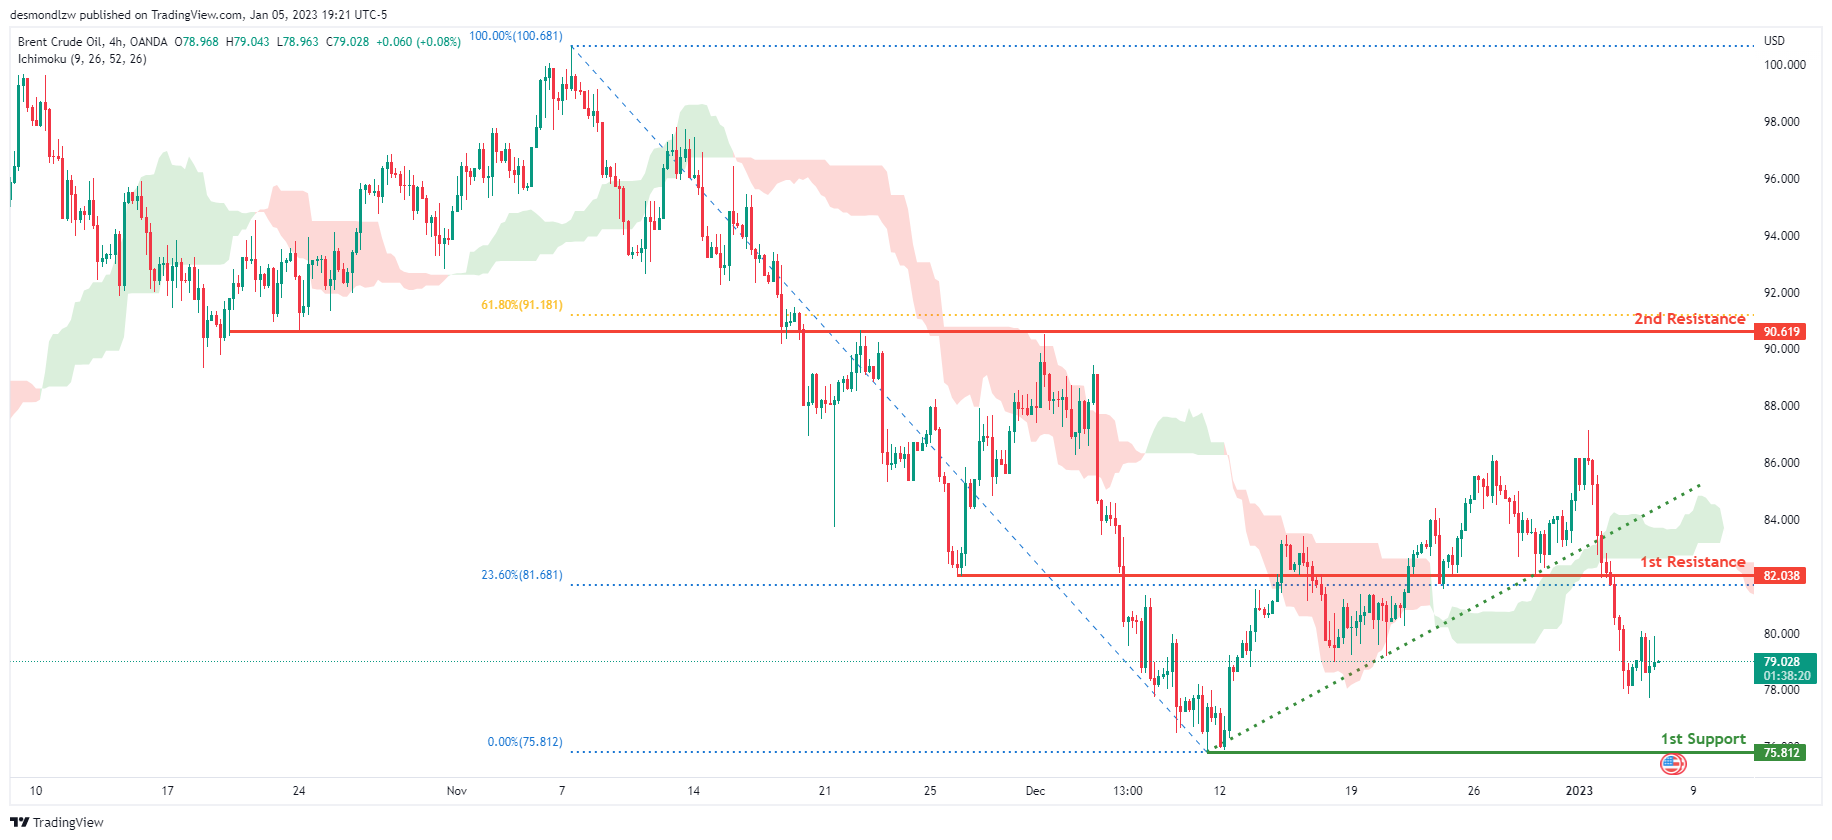
OIL:
Looking at the H4 chart, my overall bias for BCOUSD is bearish due to the current price crossing below the Ichimoku cloud, indicating a bearish market. Adding more confluence to this bias, price has also broken the ascending trend line. If this bearish momentum continues, expect the price to possibly head towards the 1st support level at 75.812, where the previous swing low is. In an alternate scenario, price could possibly head back up towards the 1st resistance at 82.038, where the 23.6% Fibonacci line is
Areas of consideration:
- H4 time frame, 1st resistance at 82.038
- H4 time frame, 1st support at 75.812
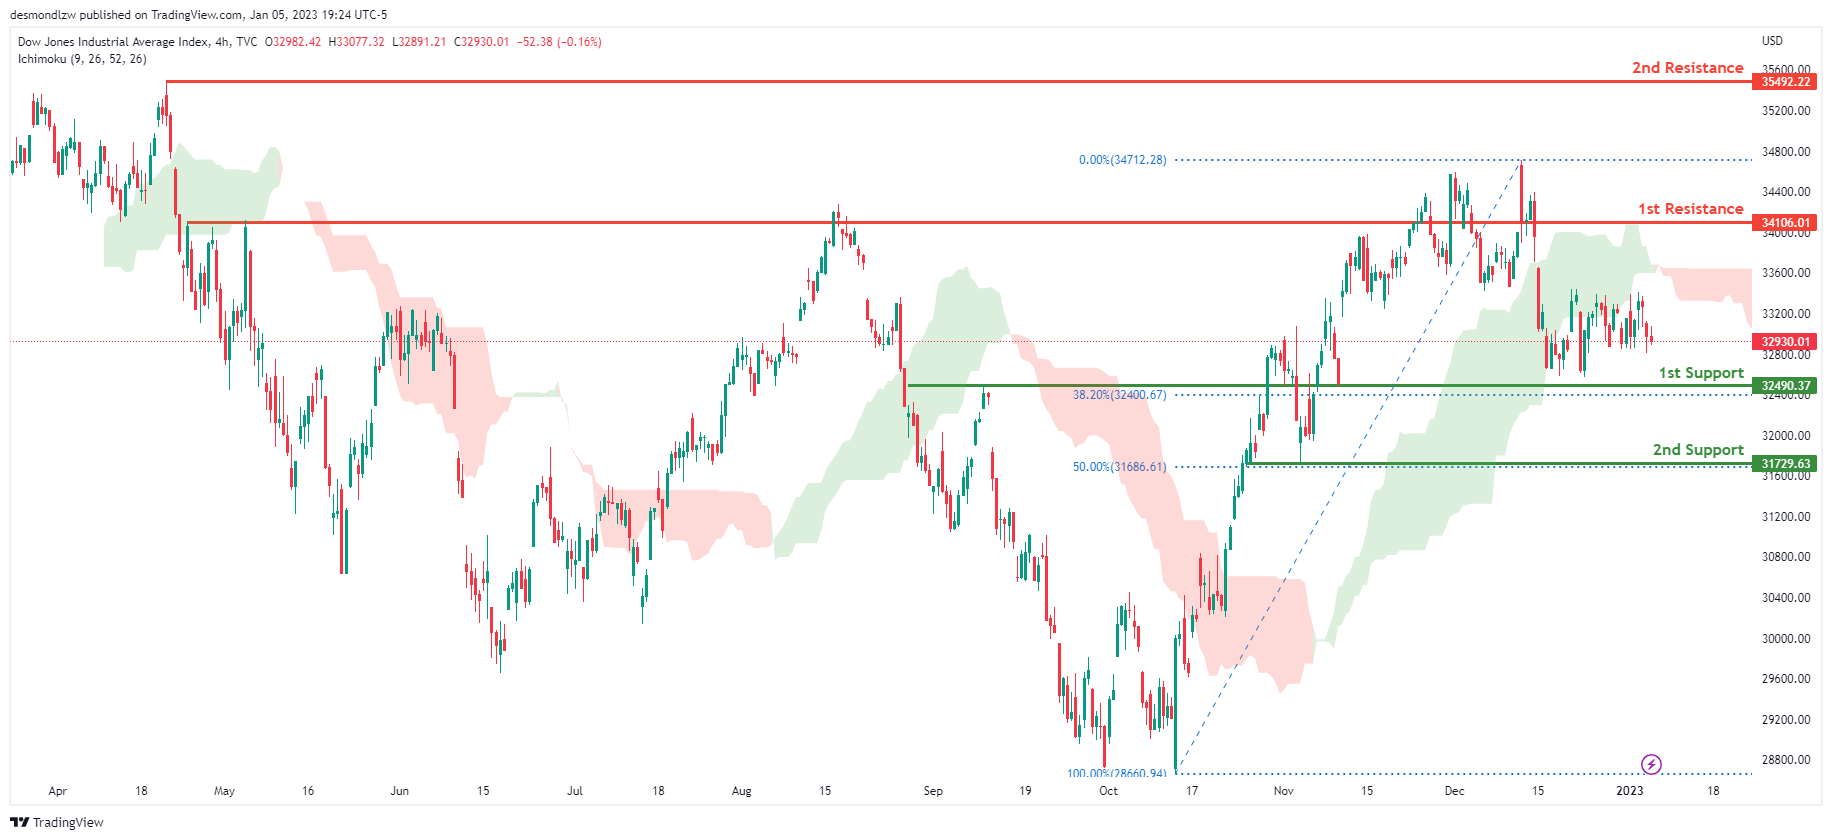
Dow Jones Industrial Average:
On the H4 chart, the overall bias for DJI is bearish. To add confluence to this, the price is below the Ichimoku cloud which indicates a bearish market. If this bearish momentum continues, expect the price to head back down towards the 1st support at 32490.37, where the 61.8% Fibonacci line is. In an alternative scenario, price could possibly break the 1st resistance line at 34106.01, where the previous swing high is before heading towards the 2nd resistance line at 35492.22, where the previous swing high is.
Areas of consideration:
- H4 time frame, 1st support at 32490.37
- H4 time frame, 1st Resistance at 34106.01
- H4 time frame, 2nd Resistance at 35492.22
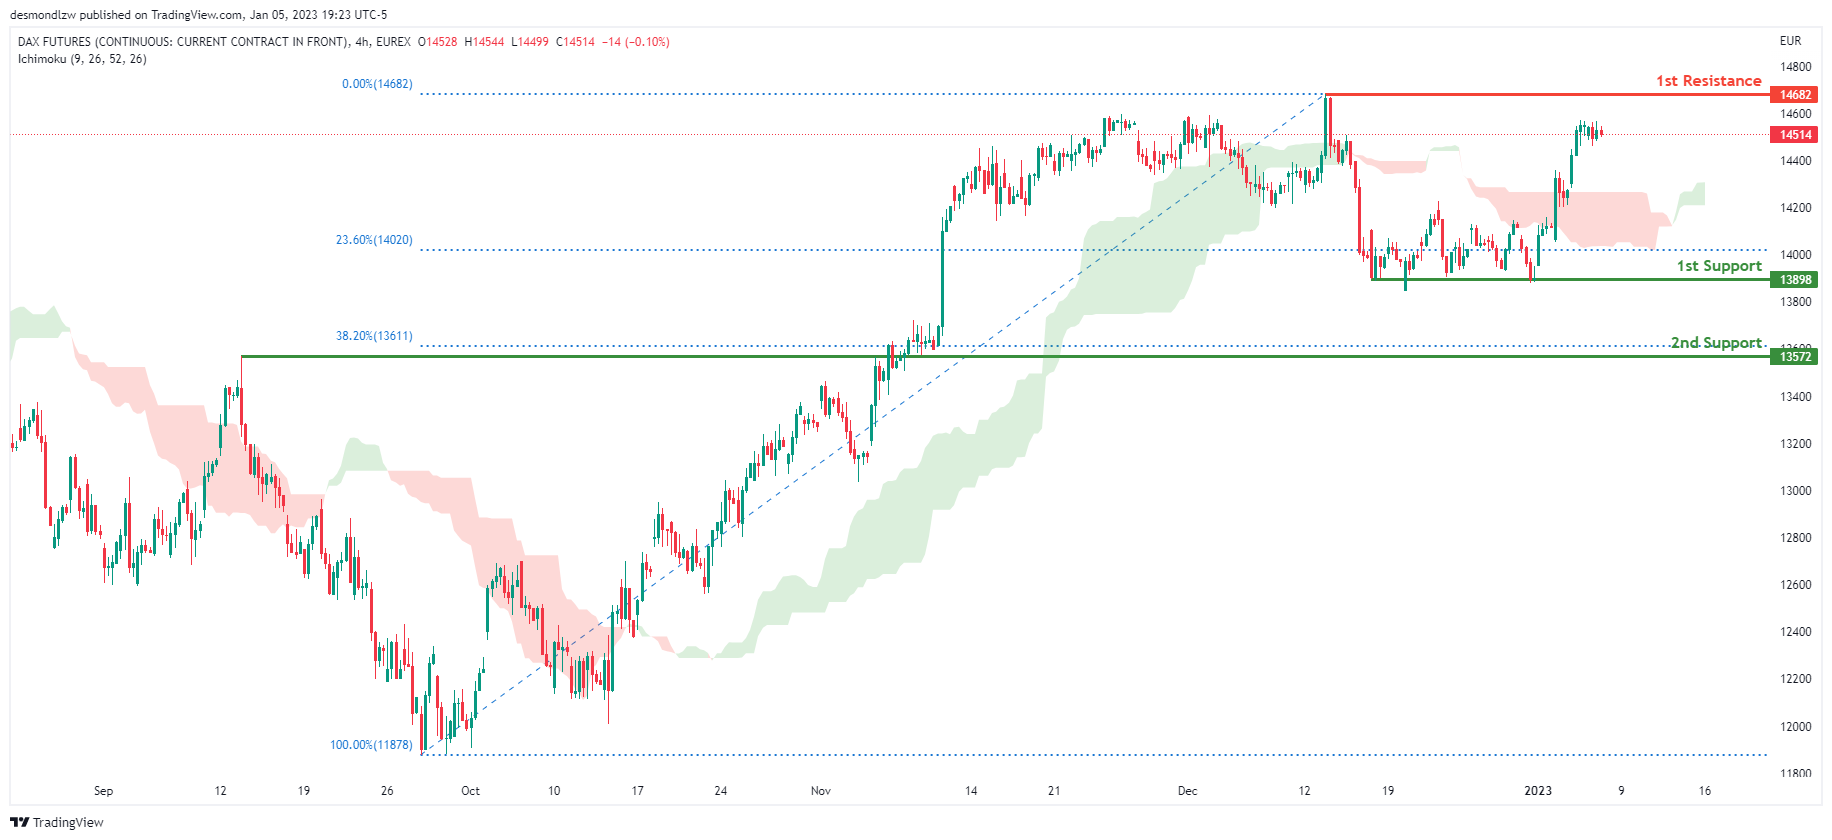
DAX:
Looking at the H4 chart, my overall bias for DAX is bullish due to the current price crossing above the Ichimoku cloud, indicating a bullish market. If this bullish momentum continues, expect the price to possibly head towards the 1st resistance line at 14682, where the previous swing high is. In an alternative scenario, price could possibly head down to retest the 1st support at 13898, where the 23.6% Fibonacci line is.
Areas of consideration:
- H4 time frame, 1st resistance is at 14682
- H4 time frame, 1st support is at 13898
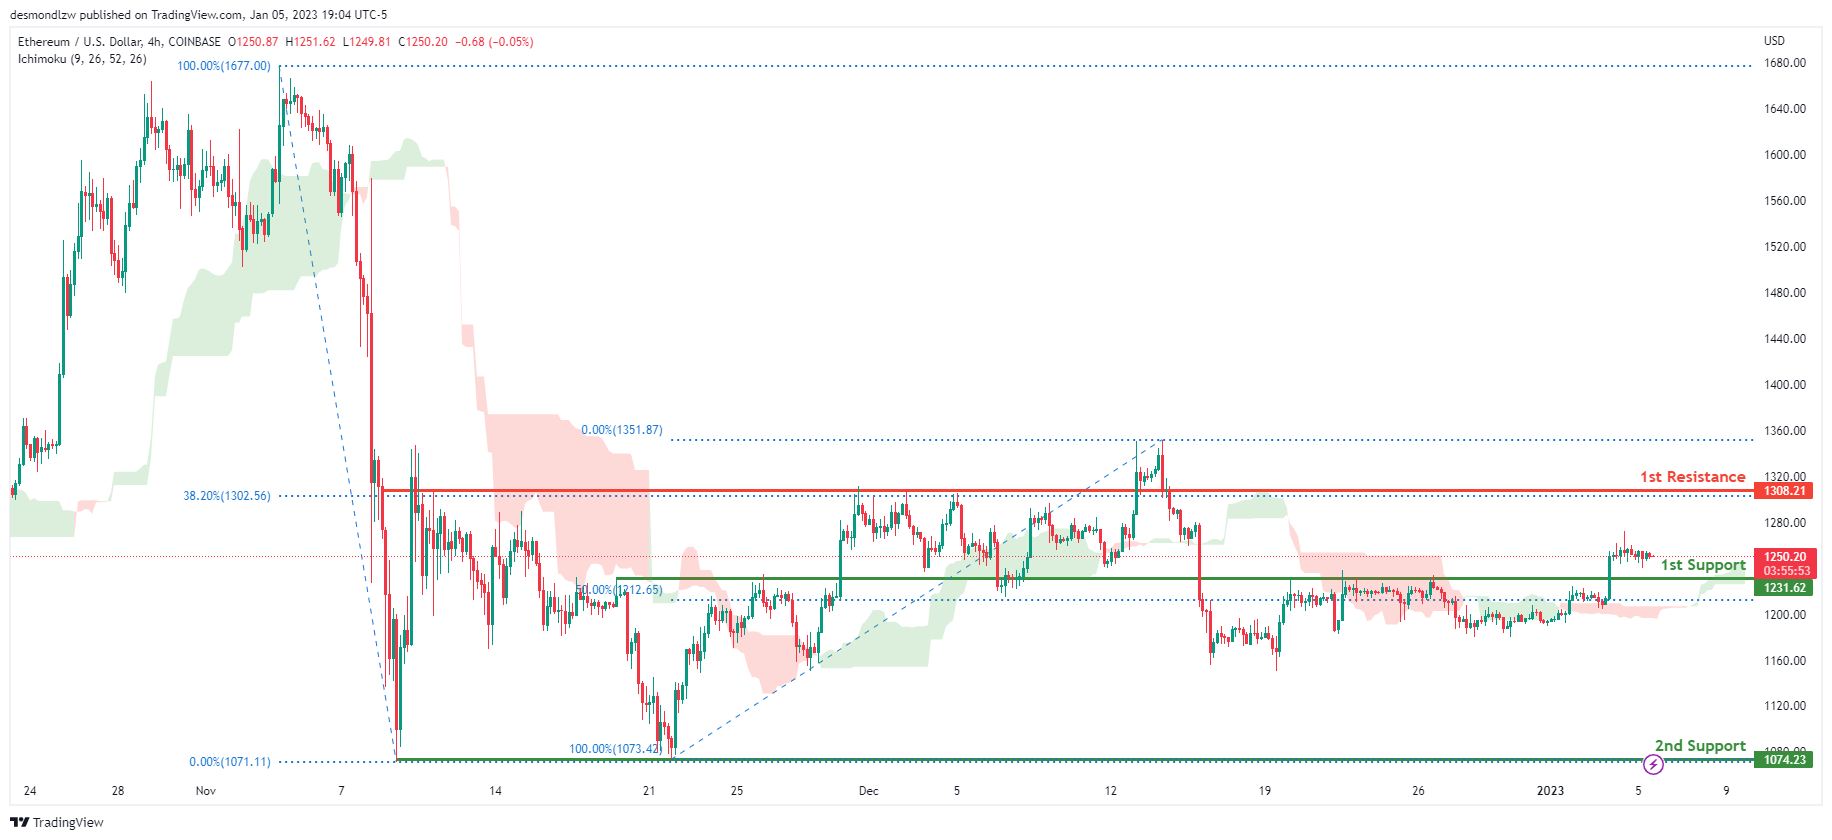
ETHUSD:
Looking at the H4 chart, my overall bias for ETHUSD is bullish due to the current price crossing above the Ichimoku cloud, indicating a bullish market. If this bullish momentum continues, expect the price to head towards the 1st resistance at 1308.21, where the 38.2% Fibonacci line is. In an alternative scenario, price could head back down towards the 1st support at 1231.62, where the 50% Fibonacci line is.
Areas of consideration:
- H4 time frame, 1st resistance of 1308.21
- H4 time frame, 1st support at 1231.62
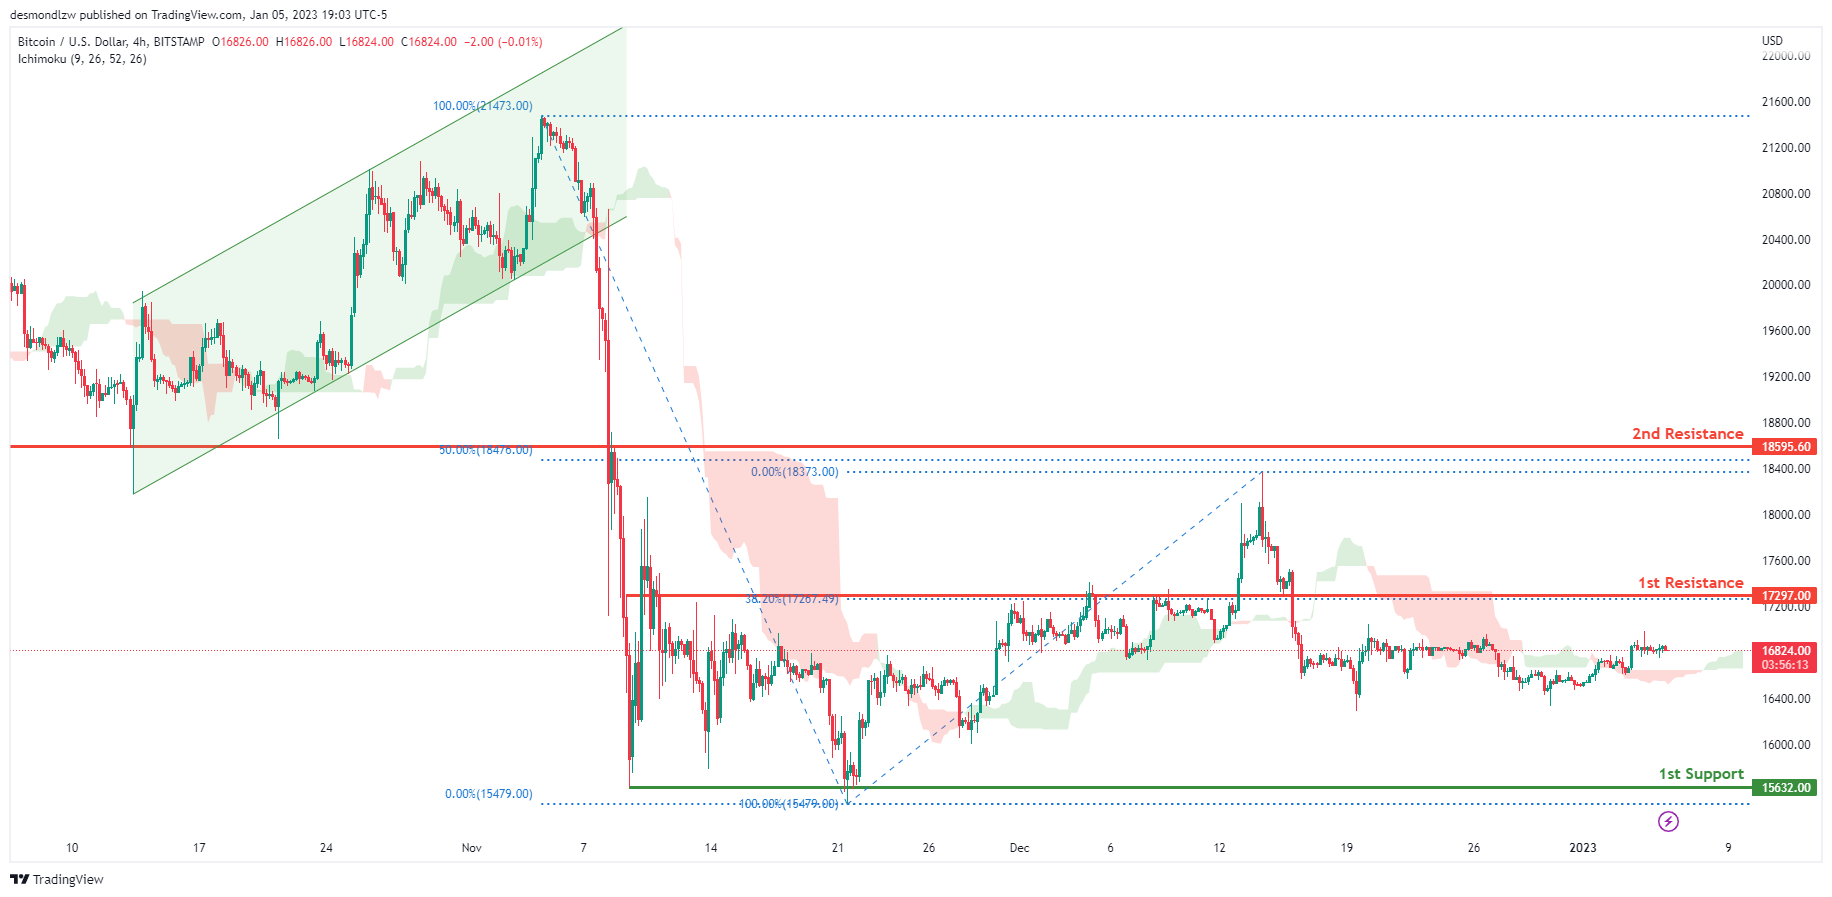
BTCUSD:
Looking at the H4 chart, my overall bias for BTCUSD is bearish due to the current price crossing below the Ichimoku cloud, indicating a bearish market. To add support to this bias, price has also broken down through the bullish ascending channel. If this bearish momentum continues, expect price to possibly continue heading towards the 1st support at 15632.00, where the previous swing low is. In an alternative scenario, price could possibly head up towards the 1st resistance at 17297.00, where the 38.2% Fibonacci line is.
Areas of consideration:
- H4 time frame, 1st resistance 17297.00
- H4 time frame, 1st support at 15632.00
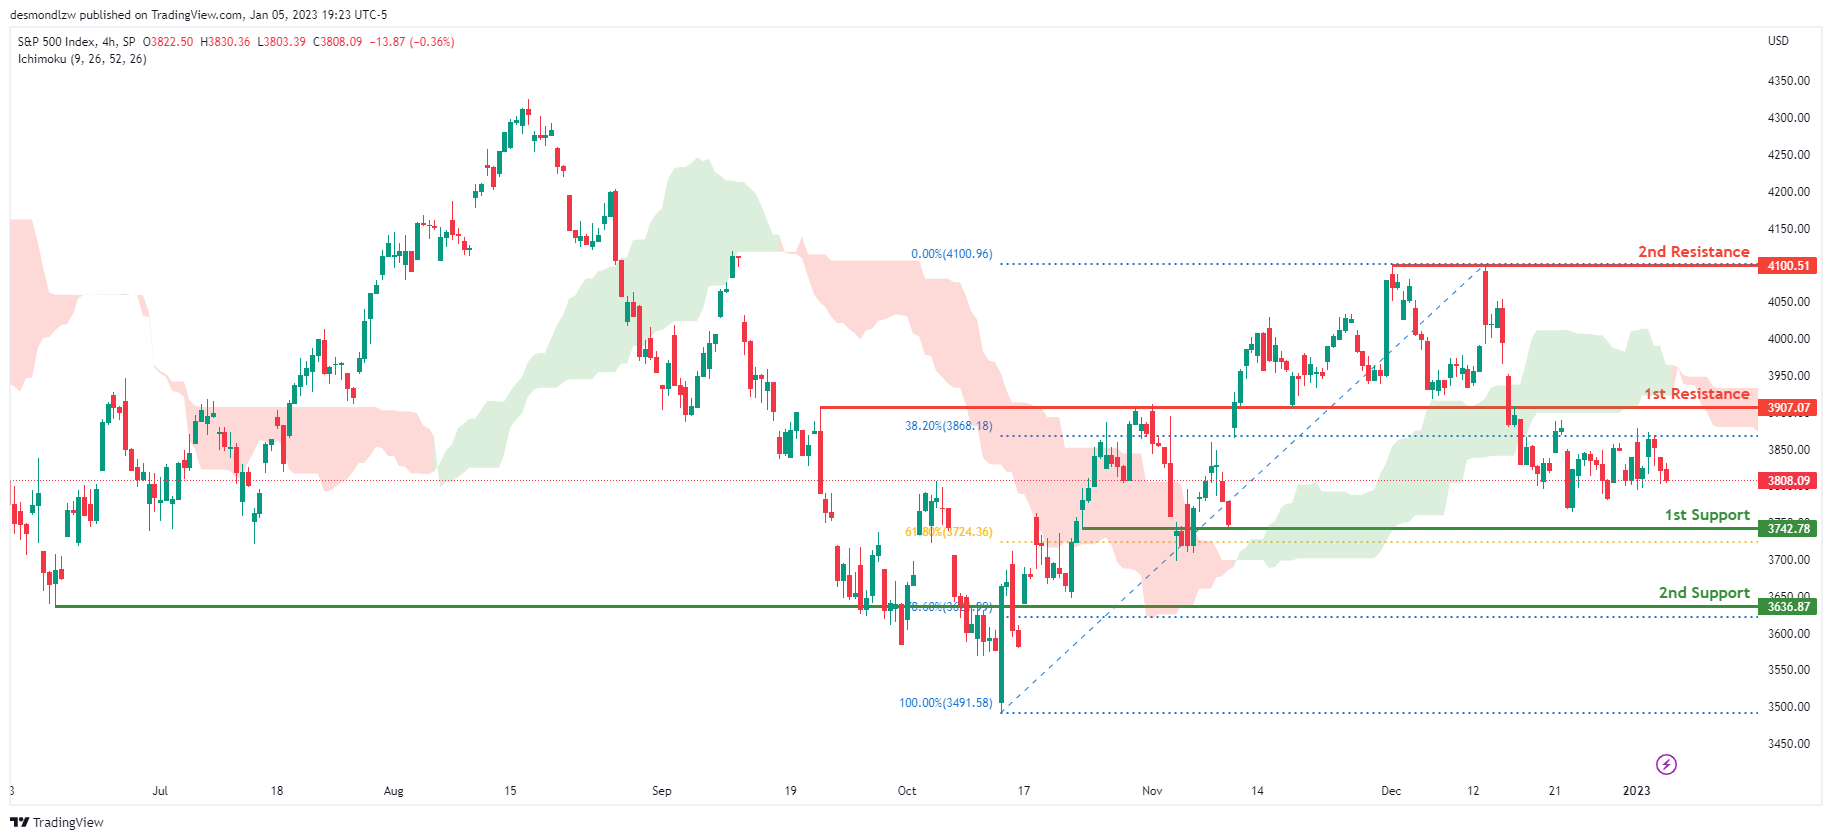
S&P 500:
Looking at the H4 chart, my overall bias for S&P500 is bearish due to the current price being below the Ichimoku cloud, indicating a bearish market. If this bearish momentum continues, expect the price to continue heading towards the 1st support at 3742.78, where the 61.8% Fibonacci line is. In an alternative scenario, price could possibly head back up to retest the 1st resistance at 3907.07, where the 38.2% Fibonacci line is.
Areas of consideration:
- H4 time frame, 1st support at 3742.78
- H4 time frame, 1st resistance at 3907.07


