
Later today, Tiff Macklem, the governor of the BoC (Bank of Canada), is expected to speak at the Riksbank’s International Symposium as part of a discussion panel on ‘Central Bank Independence.’ This speech, however, is speculated to deliver helpful insights into the governor’s perception of the Canadian economy through the BoC policies on the interest rate.On the technical side of things, we will take a cross-sectional look at CAD pairs to see how they are looking ahead of the news release.
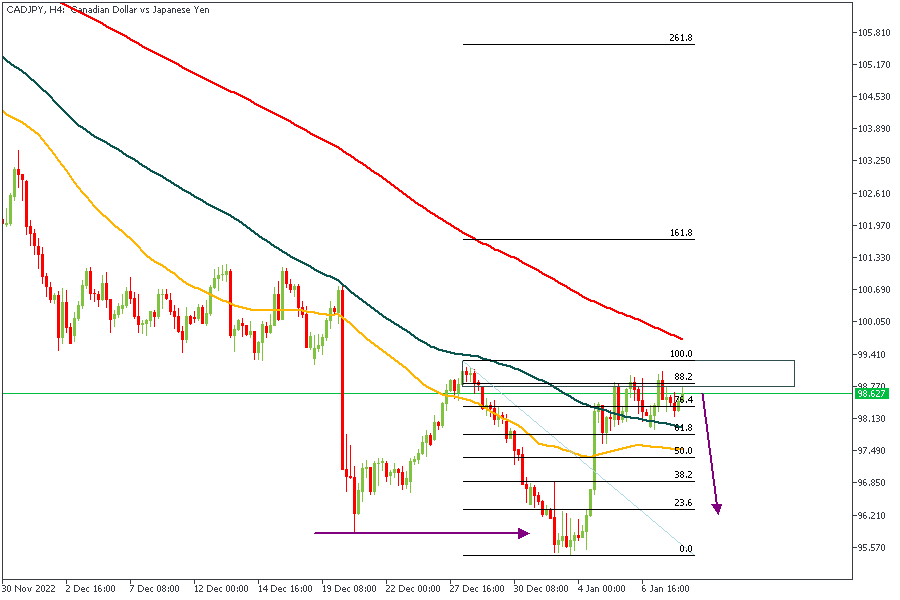
CADJPY
After the bearish break of the structure marked by the horizontal arrow, the price retests the supply order block heading into the 200-SMA. The 88.2% Fibonacci level is also crucial to consider alongside the current accumulation around that area.
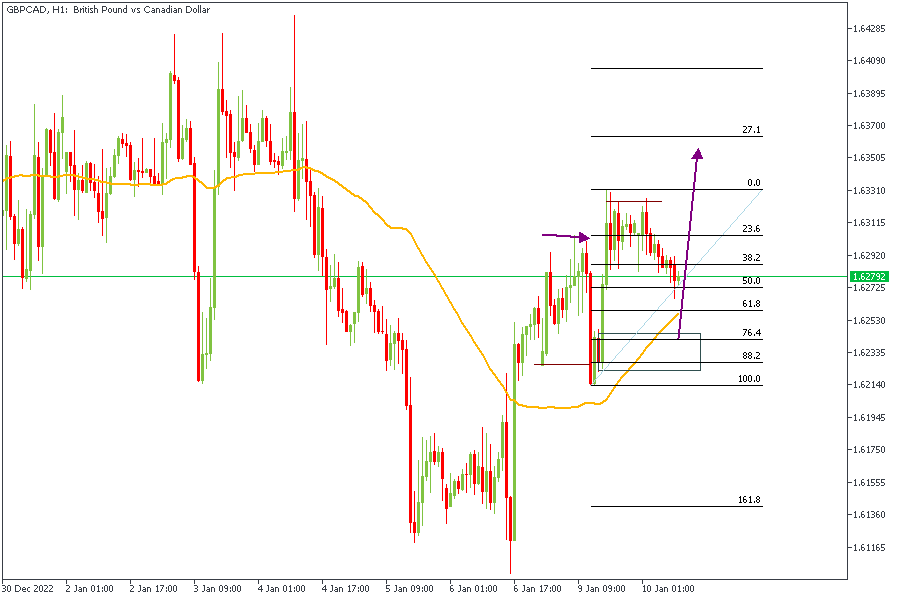
GBPCAD
GBPCAD’s downward trend may be temporarily interrupted as the price heads into the 100-SMA. The marked rectangle highlights a demand zone coupled with the Fibonacci level, the Moving Average, and the QML (Quasimodo) pattern, presenting a bullish argument for price action.
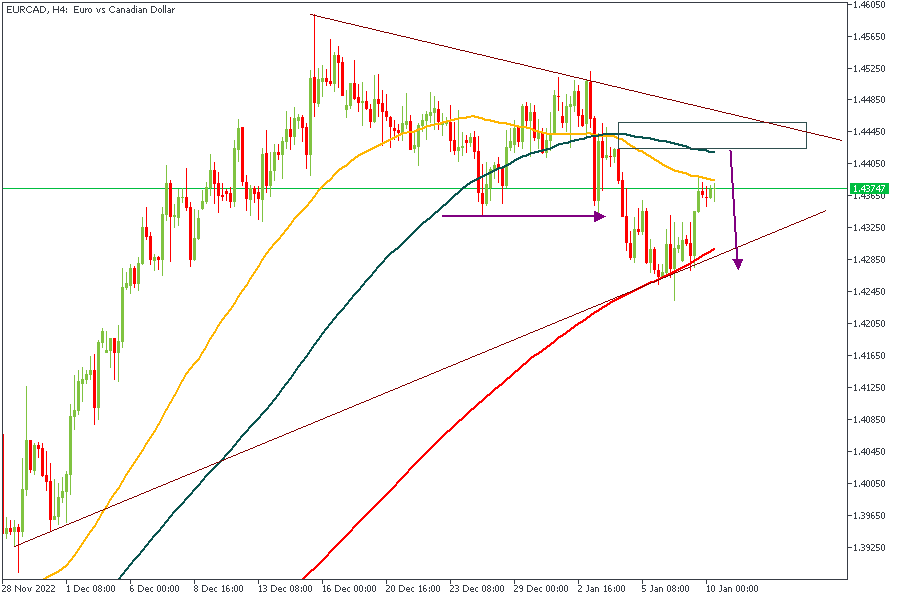
EURCAD
EURCAD is currently trading inside a wedge pattern. Notable, however, is the crossing of the 100 and 50 Moving Averages, which could serve as an early signal for bearish movement. The marked box is also a rally-base-drop supply zone situated at the 88.2% Fibonacci level, further strengthening our bearish bias.
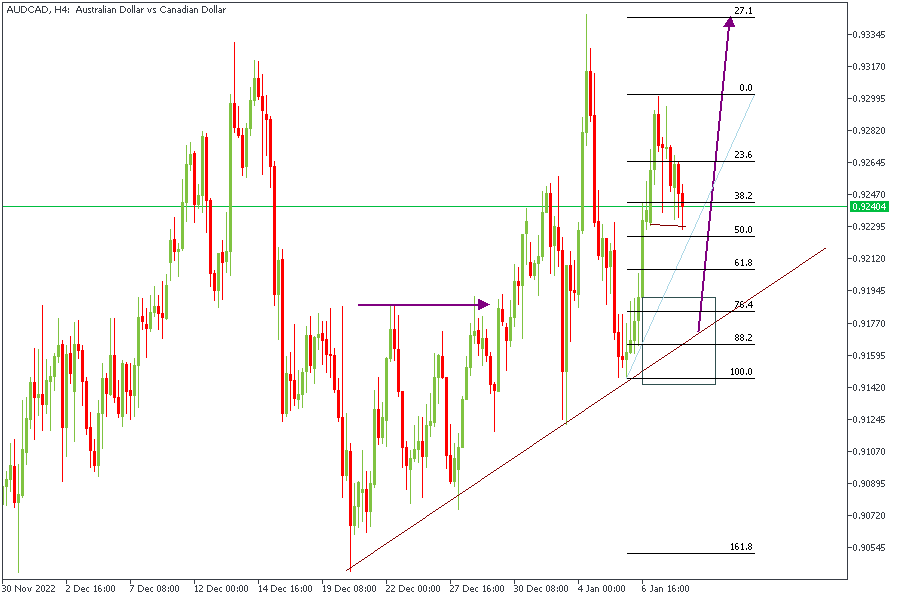
AUDCAD
There’s been a recent bullish break of structure on AUDCAD’s H4 timeframe, which has not yet responded to the demand zone to give a higher high. On this note, the Fibonacci level and the rally-base-rally demand zone marked by the rectangle seem good enough to anticipate some bullish price action in the hours to come.
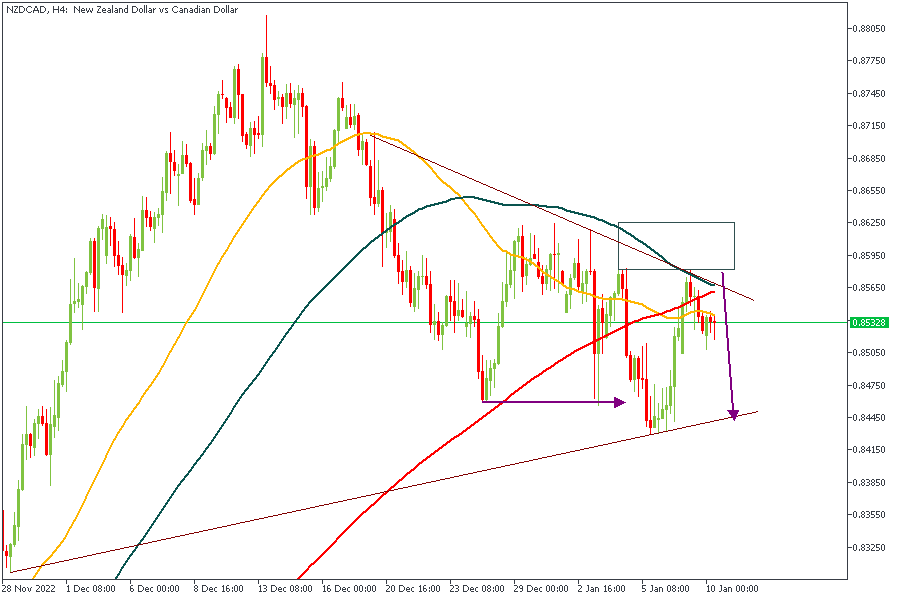
NZDCAD
With the 50-SMA below the 100-SMA and the 200-SMA, we can expect a continuation of the bearish structure that the break of structure at the horizontal arrow has confirmed. However, before that, we may see some initial bullish pulse as the price might try to retest the trendline resistance + 100-SMA + supply zone area once more before heading downwards.
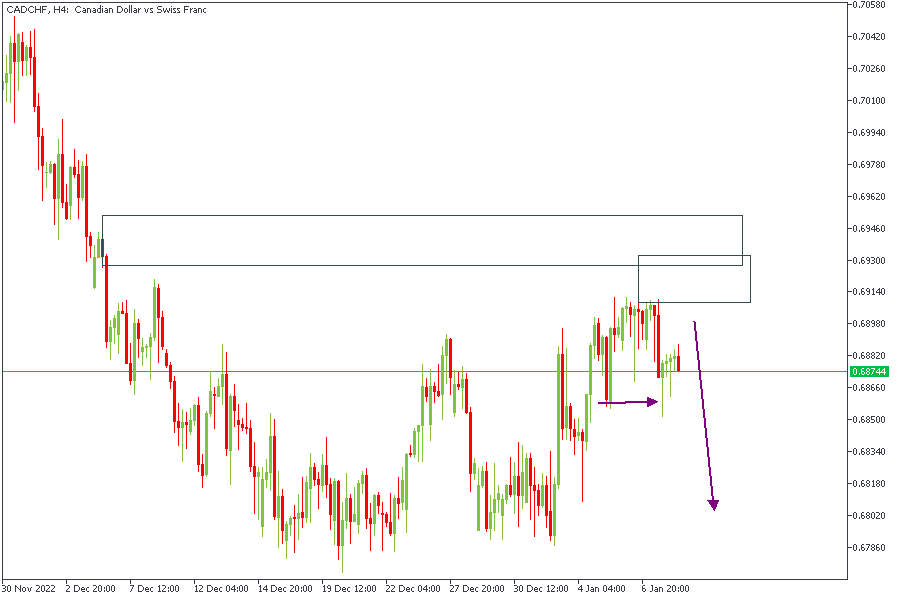
CADCHF
The structure is bearish on this H4 chart. It means we can expect some initial bearish movement from the rally-base-drop supply zone to the 0.68 price area as the price searches for a reliable area of demand to recover its bullish impulse. The release will be expected to bring more clarity to this directional bias.
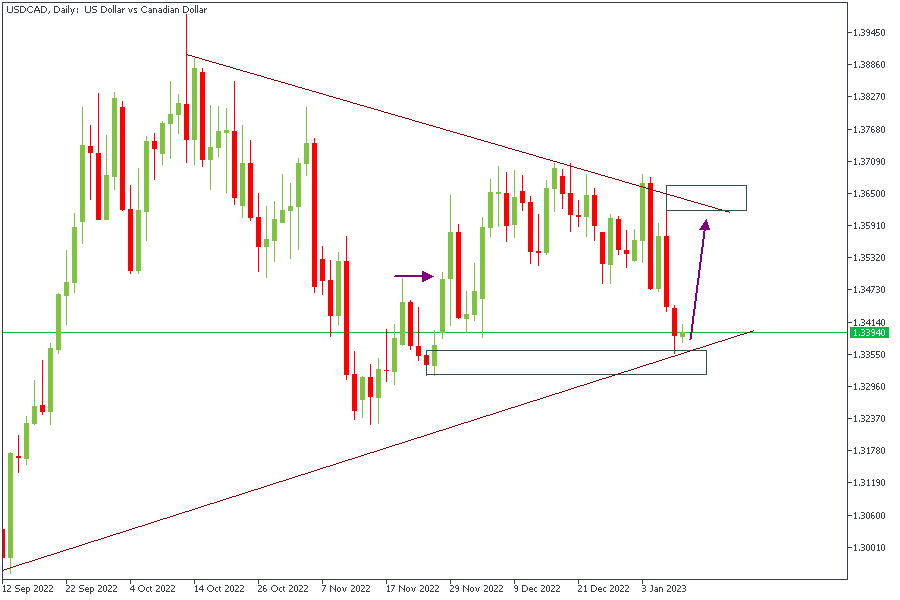
USDCAD
The daily timeframe of USDCAD shows price trading within a wide range, with demand and supply zones marked out. Based on the visible price data, I expect the price to bounce off the demand zone since the trendline support and the 88.2% Fibonacci level agree with me.
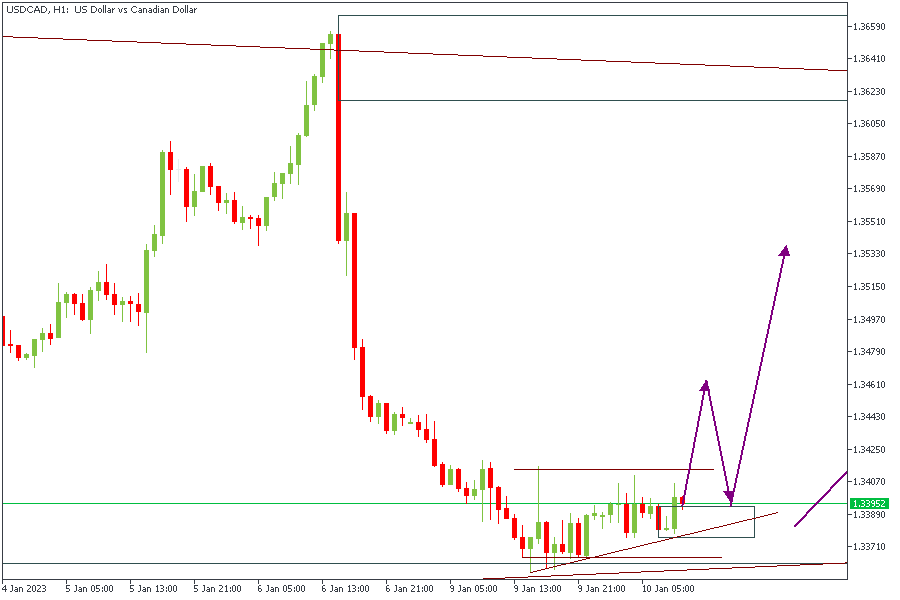
The 1-hour timeframe’s price action should look like the path of the arrows marked above.
CONCLUSION
The views above are solely based on Technical Analysis techniques using my personal Smart Money approach. Hence, it is important to understand that the trading of CFDs comes at a risk; if not properly managed, you may lose all of your trading capital. To avoid costly mistakes while you look to trade these opportunities, be sure to do your own due diligence and manage your risk appropriately. You can access more of such trade ideas as well as prompt market updates on the telegram channel.


