
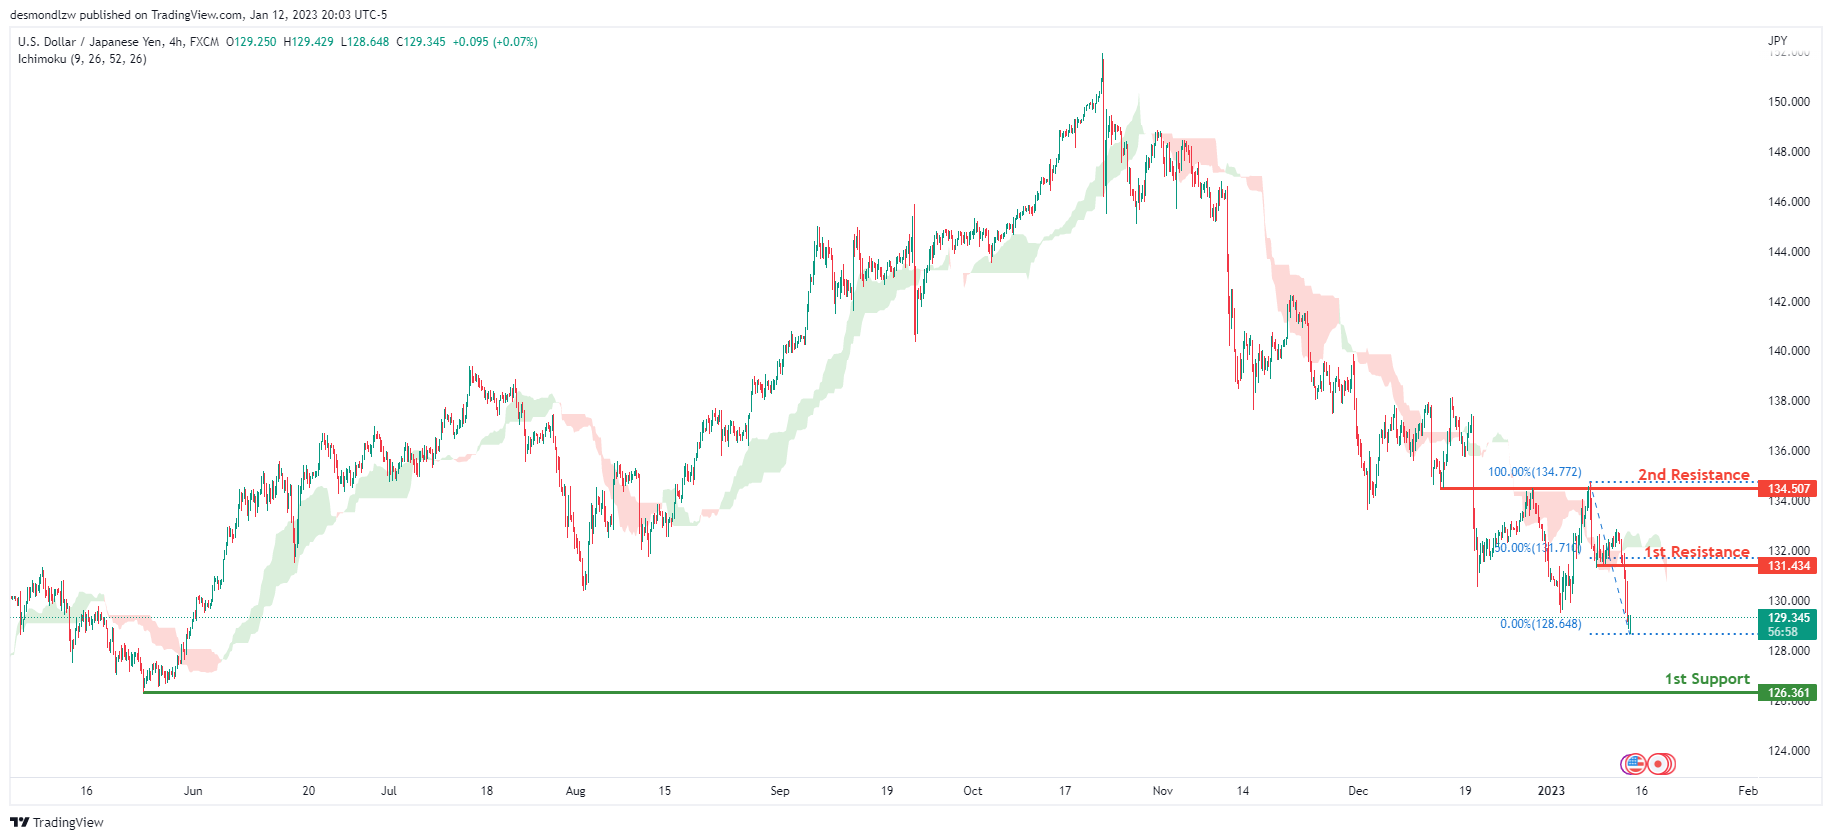
USD/JPY:
Looking at the H4 chart, my overall bias for USDJPY is bearish due to the current price being below the Ichimoku cloud, indicating a bearish market. If this bearish momentum continues, expect the price to possibly continue heading towards the 1st support level at 126.361, where the previous swing low is. In an alternate scenario, price could possibly head back up to retest the 1st resistance at 131.434, where the 50% Fibonacci line is.
Areas of consideration:
- H4 time frame, 1st resistance at 131.434
- H4 time frame, 1st support at 1126.361
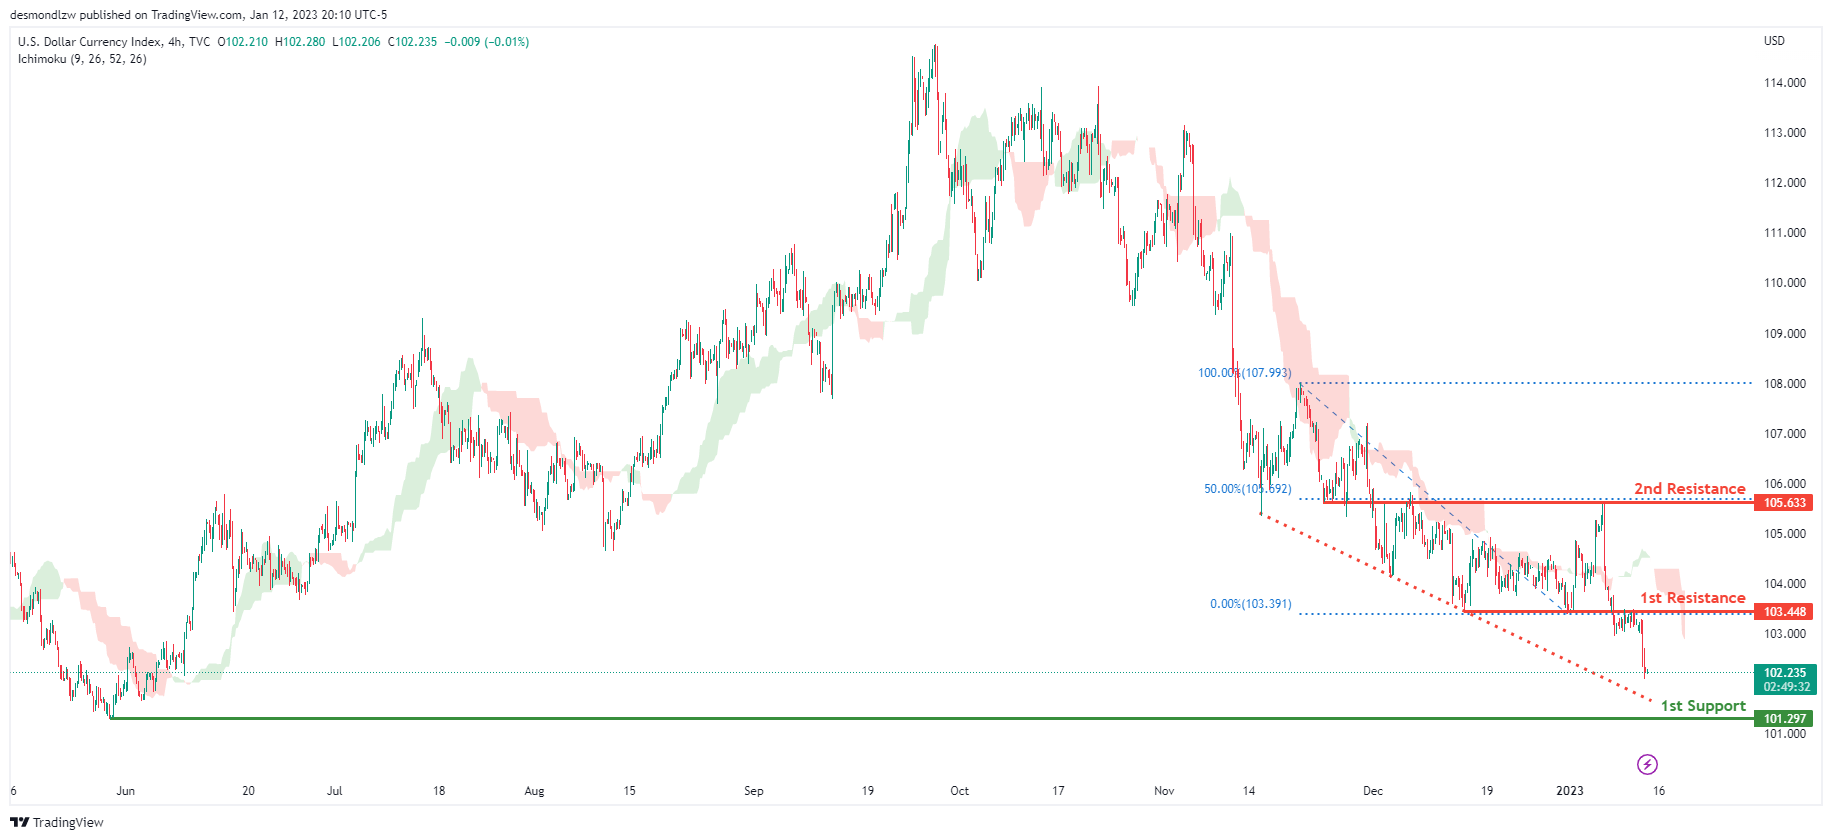
DXY:
Looking at the H4 chart, my overall bias for DXY is bearish due to the current price being below the Ichimoku cloud, indicating a bearish market. To add confluence to this, price is along a descending trend line which indicates a bearish market. If this bearish momentum continues, expect the price to possibly continue heading towards the 1st support at 101.297, where the previous lows and liquidity hotspots are. In an alternative scenario, price could head back up to retest the 1st resistance at 103.448, where the previous low is.
Areas of consideration:
- H4 time frame, 1st resistance at 103.448
- H4 time frame, 1st support at 101.297
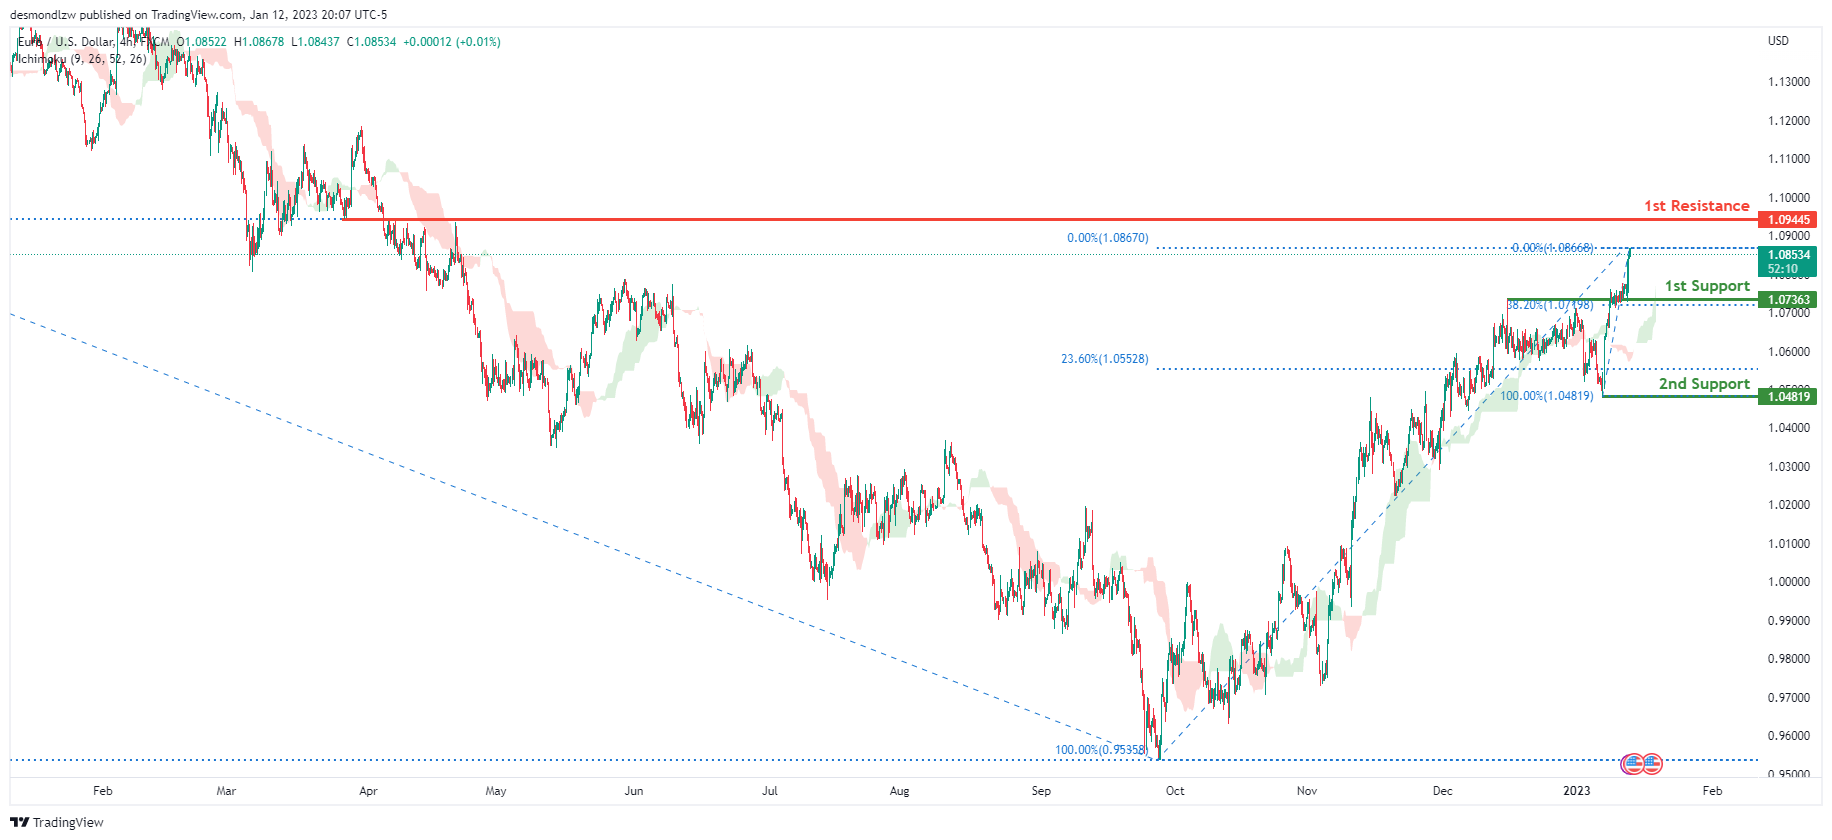
EUR/USD:
Looking at the H4 chart, my overall bias for EURUSD is bullish due to the current price being above the Ichimoku cloud, indicating a bullish market structure. If this bullish momentum continues, expect the price to possibly continue heading towards the 1st resistance at 1.09445, where the 50% Fibonacci line is. In an alternate scenario, price could possibly head back down to retest the 1st support level at 1.07363, where the 38.2% Fibonacci line is.
Areas of consideration :
- H4 1st resistance at 1.09445
- H4 1st support at 1.07363
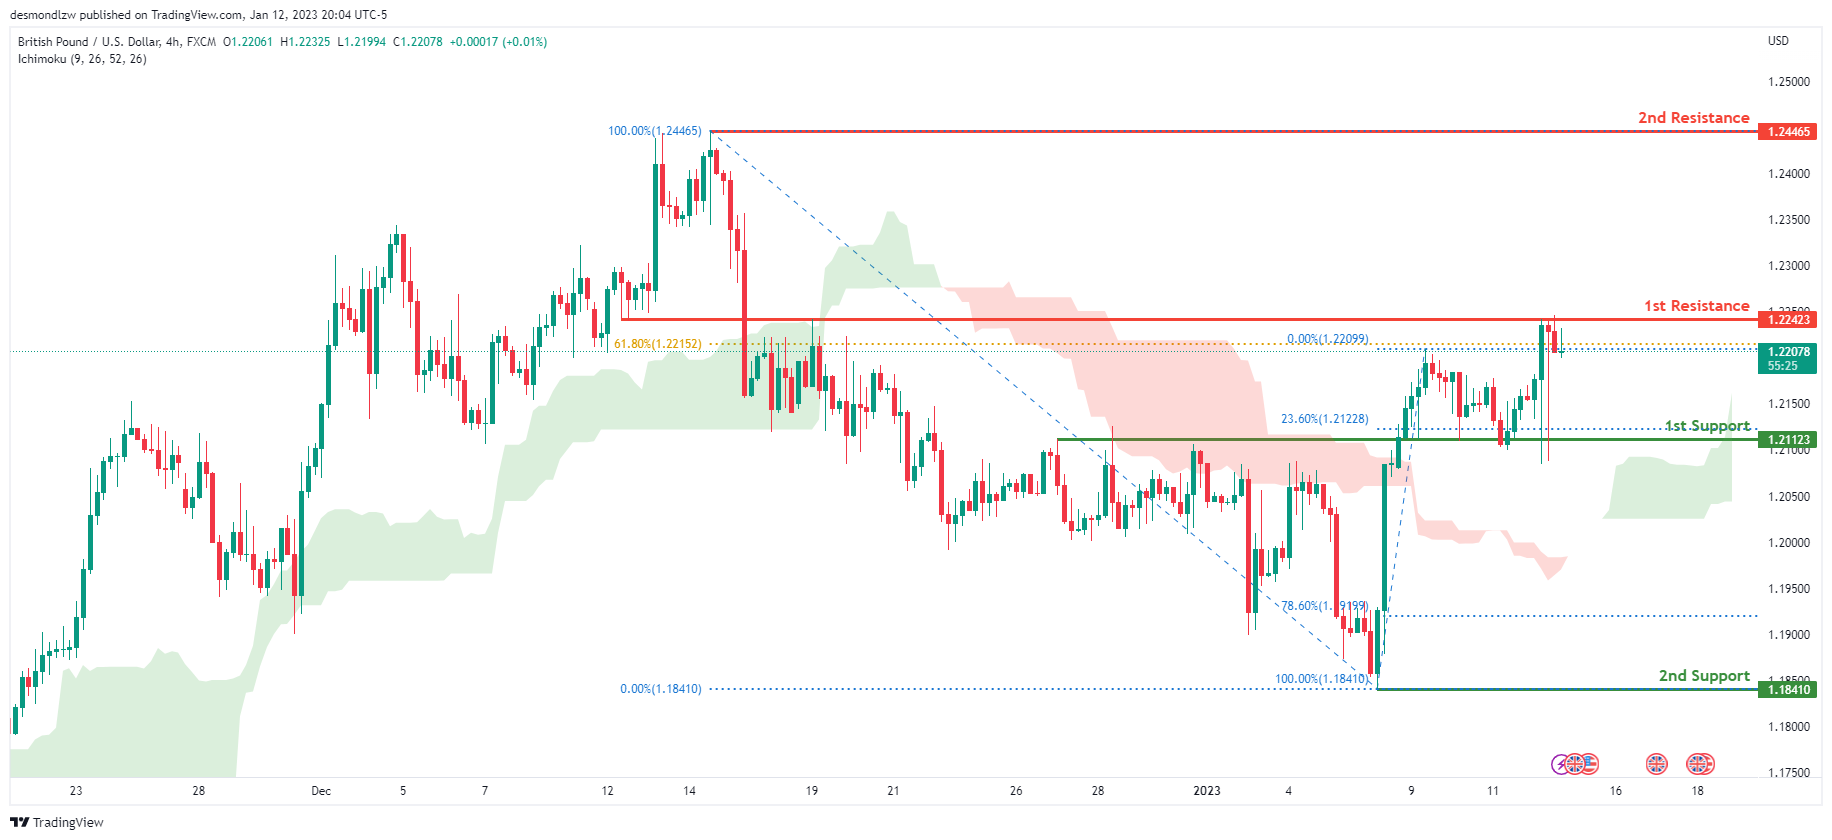
GBP/USD:
Looking at the H4 chart, my overall bias for GBPUSD is bullish due to the current price being above the Ichimoku cloud, indicating a bullish market. If this bullish momentum continues, expect price to possibly continue to break the 1st resistance line at 1.22423, slightly above where the 61.8% Fibonacci line is, before heading towards the 2nd resistance at 1.24465, where the previous swing high is. In an alternate scenario, price could possibly head back down towards the 1st support at 1.21123, where the 23.6% Fibonacci line is
Areas of consideration:
- H4 1st resistance at 1.22423
- H4 2nd resistance at 1.24465
- H4 1st support at 1.21068
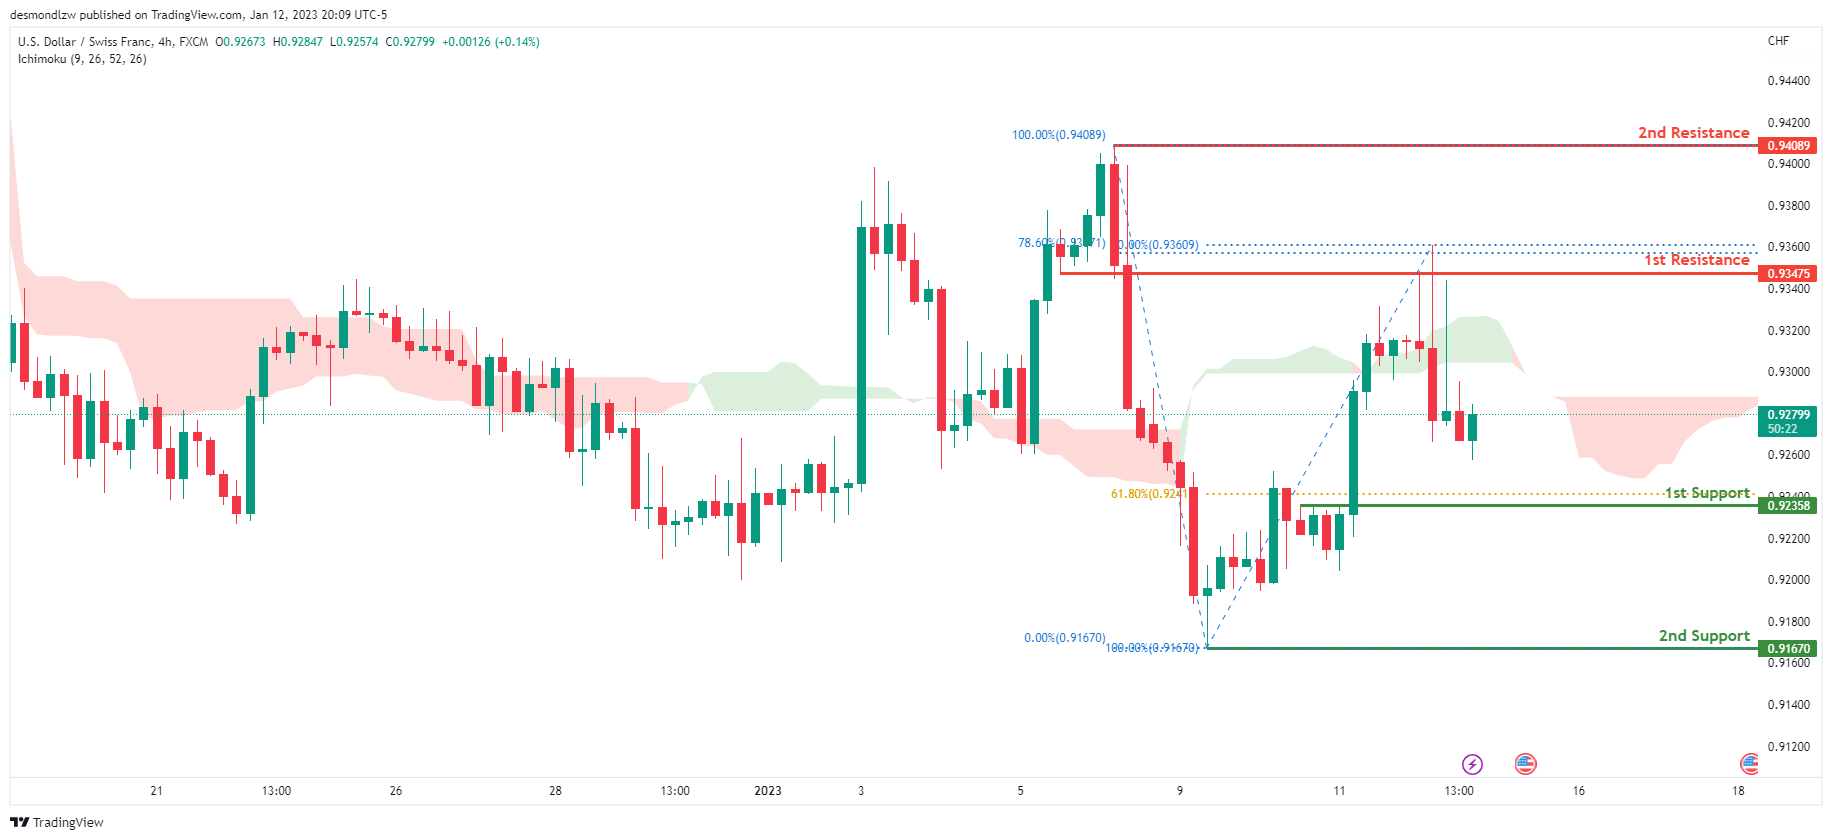
USD/CHF:
Looking at the H4 chart, my overall bias for USDCHF is bearish due to the current price being below the Ichimoku cloud, indicating a bearish market. If the current bearish trend continues, expect the price to possibly head back down to retest the 1st support at 0.92358, where the 61.8% Fibonacci line is. In an alternative scenario, price could possibly head towards the 1st resistance at 0.93475, where the 78.6% Fibonacci line is.
Areas of consideration
- H4 1st support at 0.92358
- H4 1st resistance at 0.93475
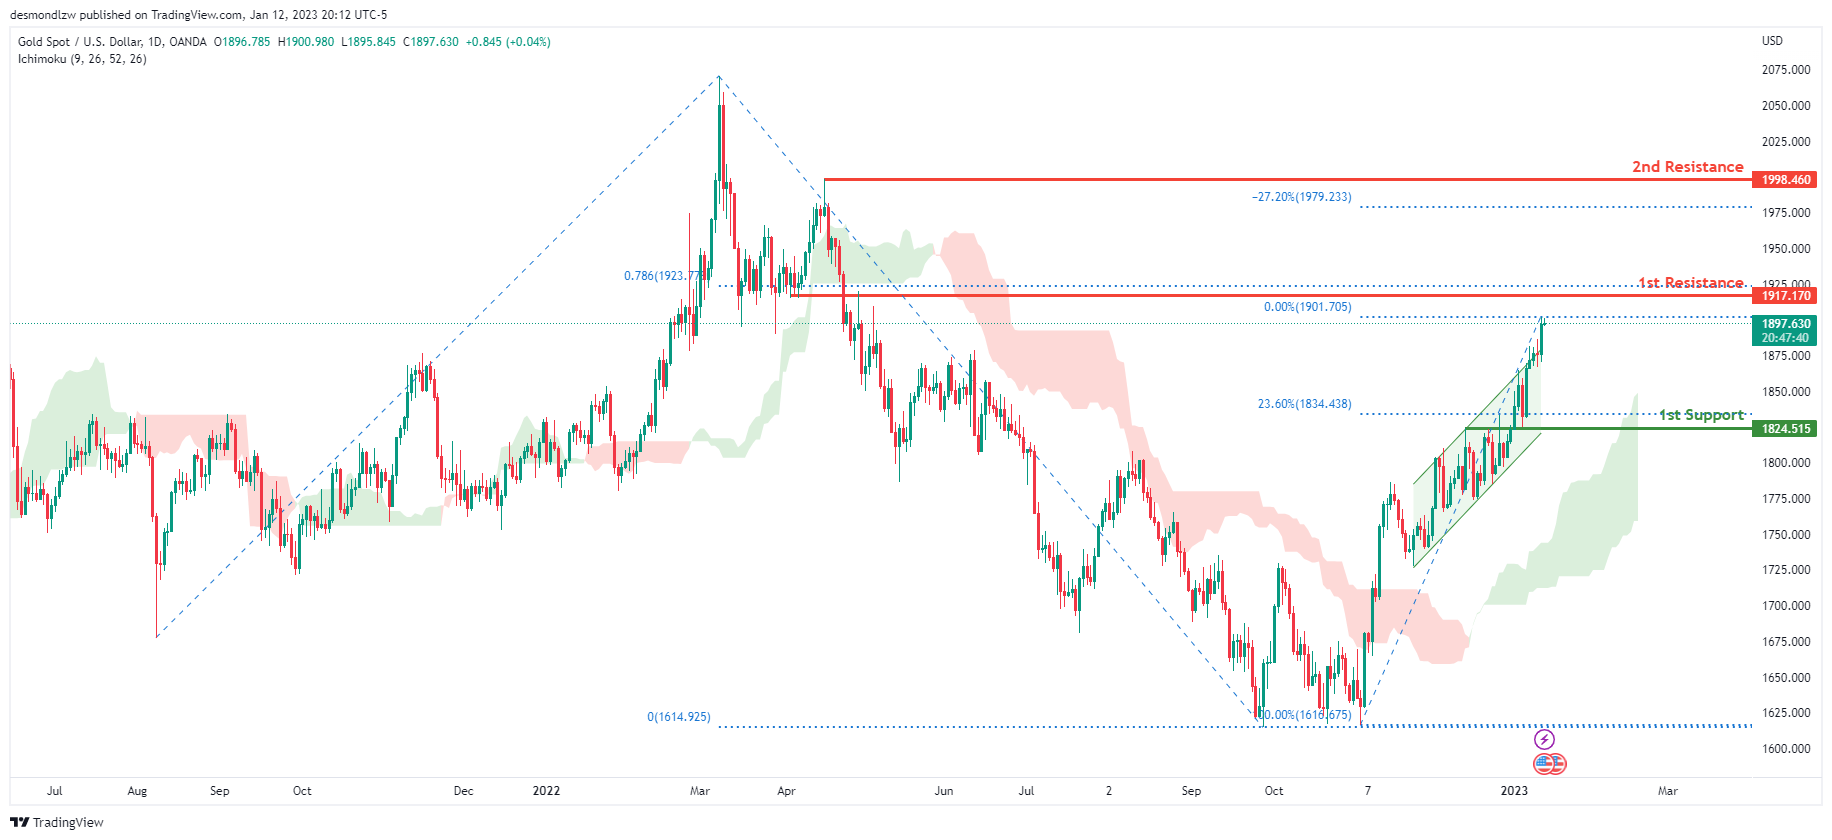
XAU/USD (GOLD):
Looking at the Daily chart, my overall bias for XAUUSD is bullish due to the current price crossing above the Ichimoku cloud, indicating a bullish market. To add support to this bias, price has also broken above the bullish ascending channel. If this bullish momentum continues, expect the price to possibly continue heading towards the 1st resistance at 1917.170 where the 78.6% Fibonacci projection line is. In an alternative scenario, price could possibly head back down towards the 1st support at 1824.515, where the 23.6% Fibonacci line is.
Areas of consideration:
- H4 time frame, 1st resistance at 1917.170
- H4 time frame, 1st support at 1824.515
- H4 time frame, 2nd support at 1833.445
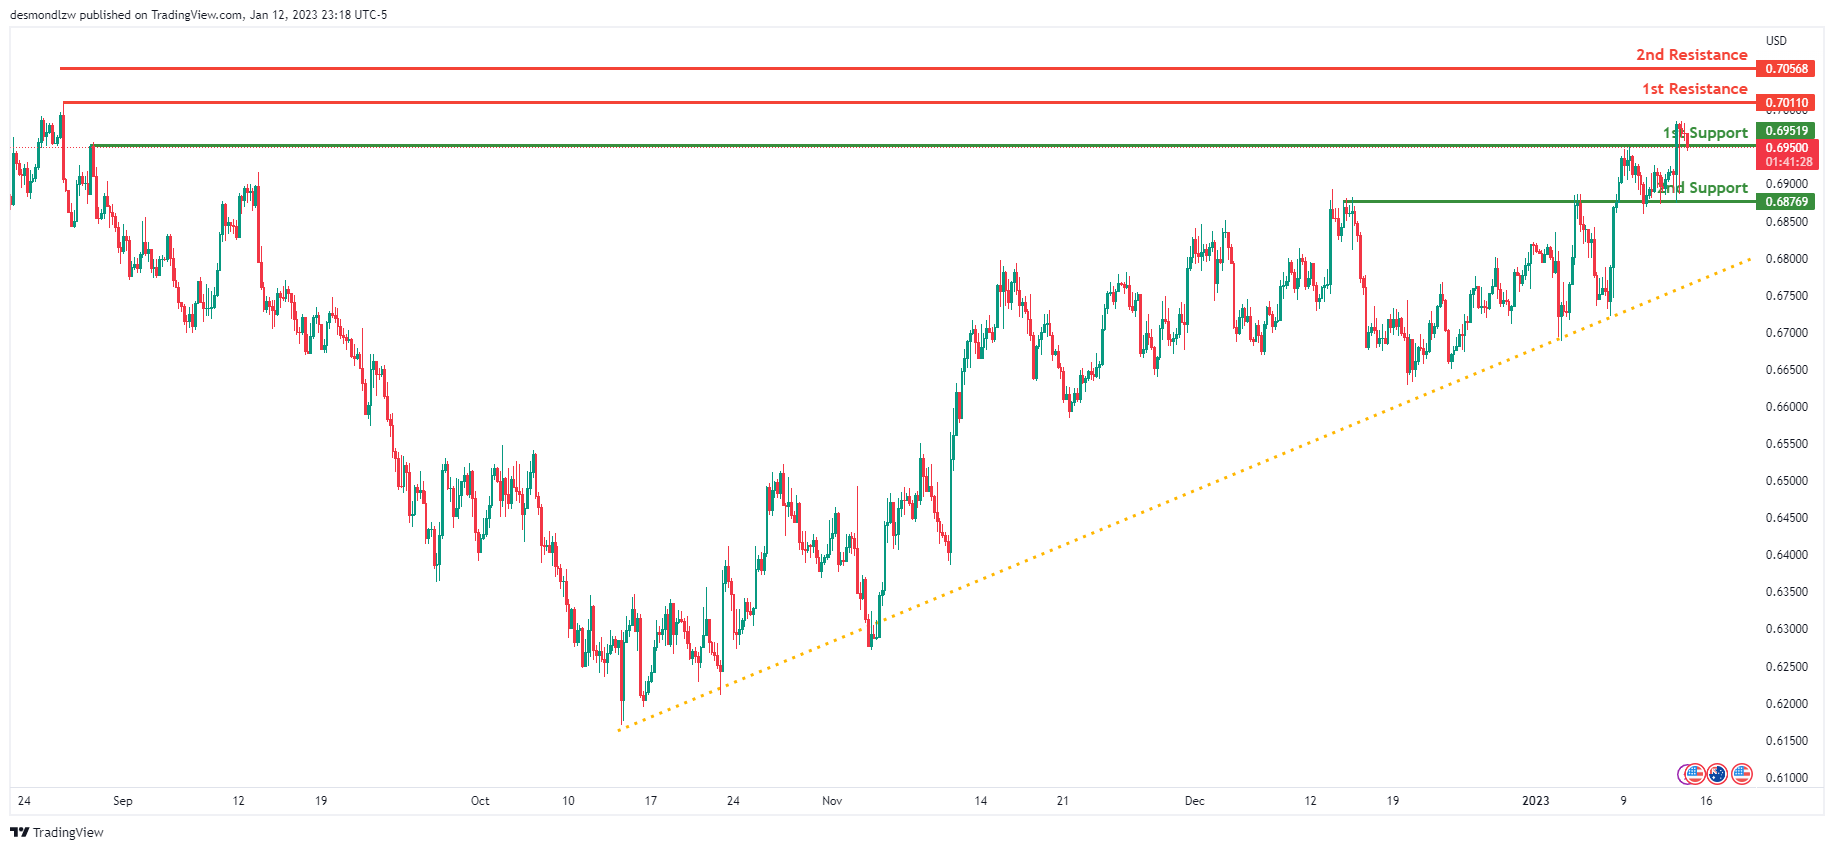
AUD/USD:
Looking at the H4 chart, we can see that the 1st support is at 0.6951 which is an overlap support. The 2nd support is down at 0.6876 which is also an overlap support. There is a long term ascending trend line that starts from 13th October 2022 which suggests that there is bullish momentum. Price is also above our Ichimoku cloud suggesting further bullish momentum.
1st resistance is at 0.7011 which is a swing high resistance from 26th August 2022. 2nd resistance is slightly higher at 0.7056.
Areas of consideration
- H4, 1st resistance at 0.7011
- H4, 2nd resistance at 0.7056
- H4, 1st support at 0.6951
- H4, 2nd support at 0.6876
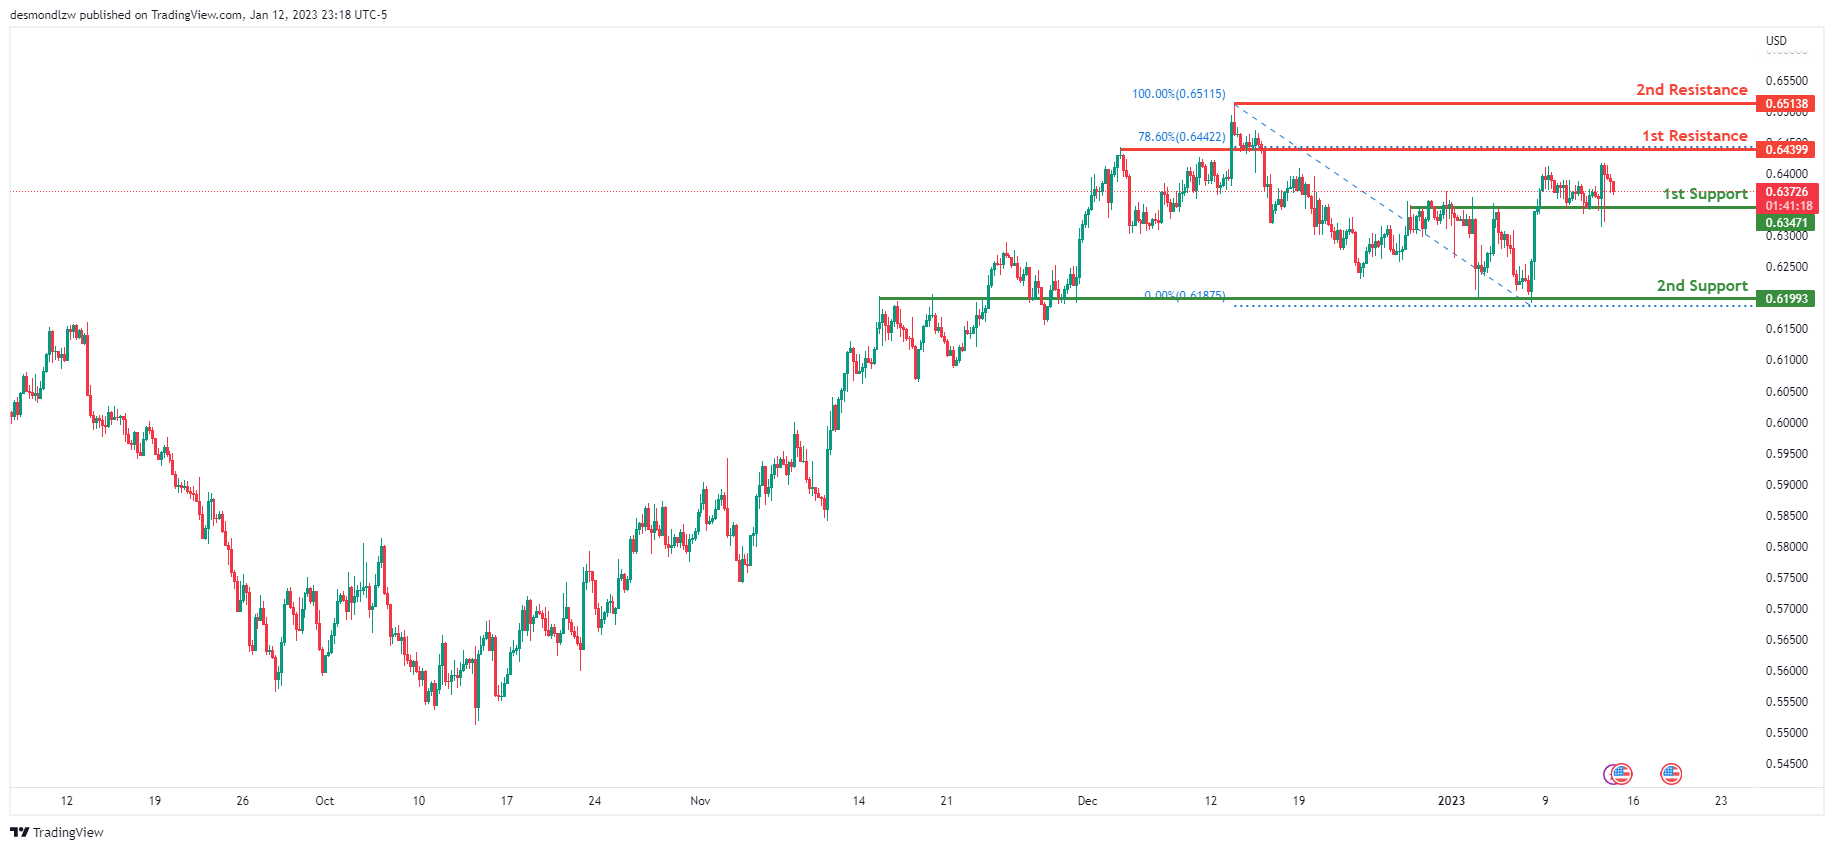
NZD/USD:
Looking at the H4 chart, we can see that the 1st support is at 0.64547 which is an overlap support. If price breaks this level, we could see it drop to 2nd support down at 0.6199.
For the resistance, our 1st resistance is at 0.6439 which is an overlap resistance that happens to line up with 78.6% Fibonacci retracement. If price breaks this level, it could go up to the 2nd resistance at 0.6513 which is a recent swing high resistance.
Areas of consideration:
- H4 time frame, 1st resistance at 0.64399.
- H4 time frame, 2nd resistance at 0.6513
- H4 time frame, 1st support at 0.6347
- H4 time frame, 2nd support at 0.6199.
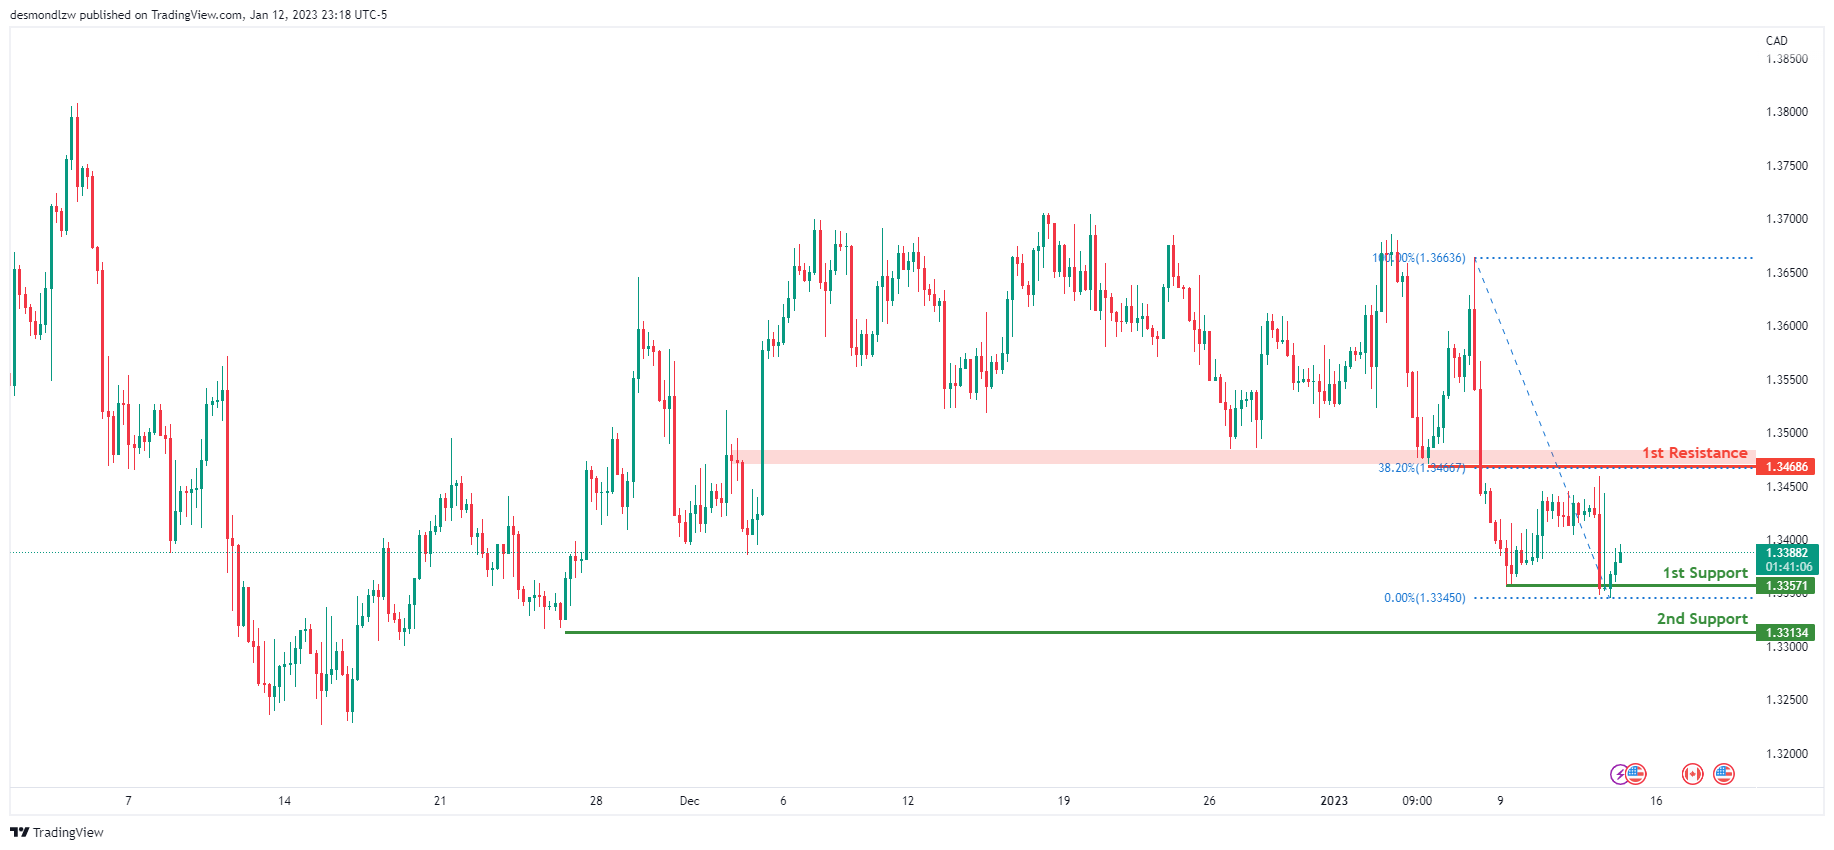
USD/CAD:
On the H4 chart, we can see price currently bouncing off 1st support at 1.3357 which is a swing low support. If price breaks this level, it could drop down to 2nd support at 1.3313 which is a swing low from the 25th November 2022.
In terms of resistance, the 1st resistance we can see is at 1.3468 which is an overlap resistance that happens to coincide with the 38.2% fibonacci retracement.
Areas of consideration:
- H4 time frame, 1st resistance at 1.3468
- H4 time frame, 1st support at 1.3357
- H4 time frame, 2nd support at 1.3313
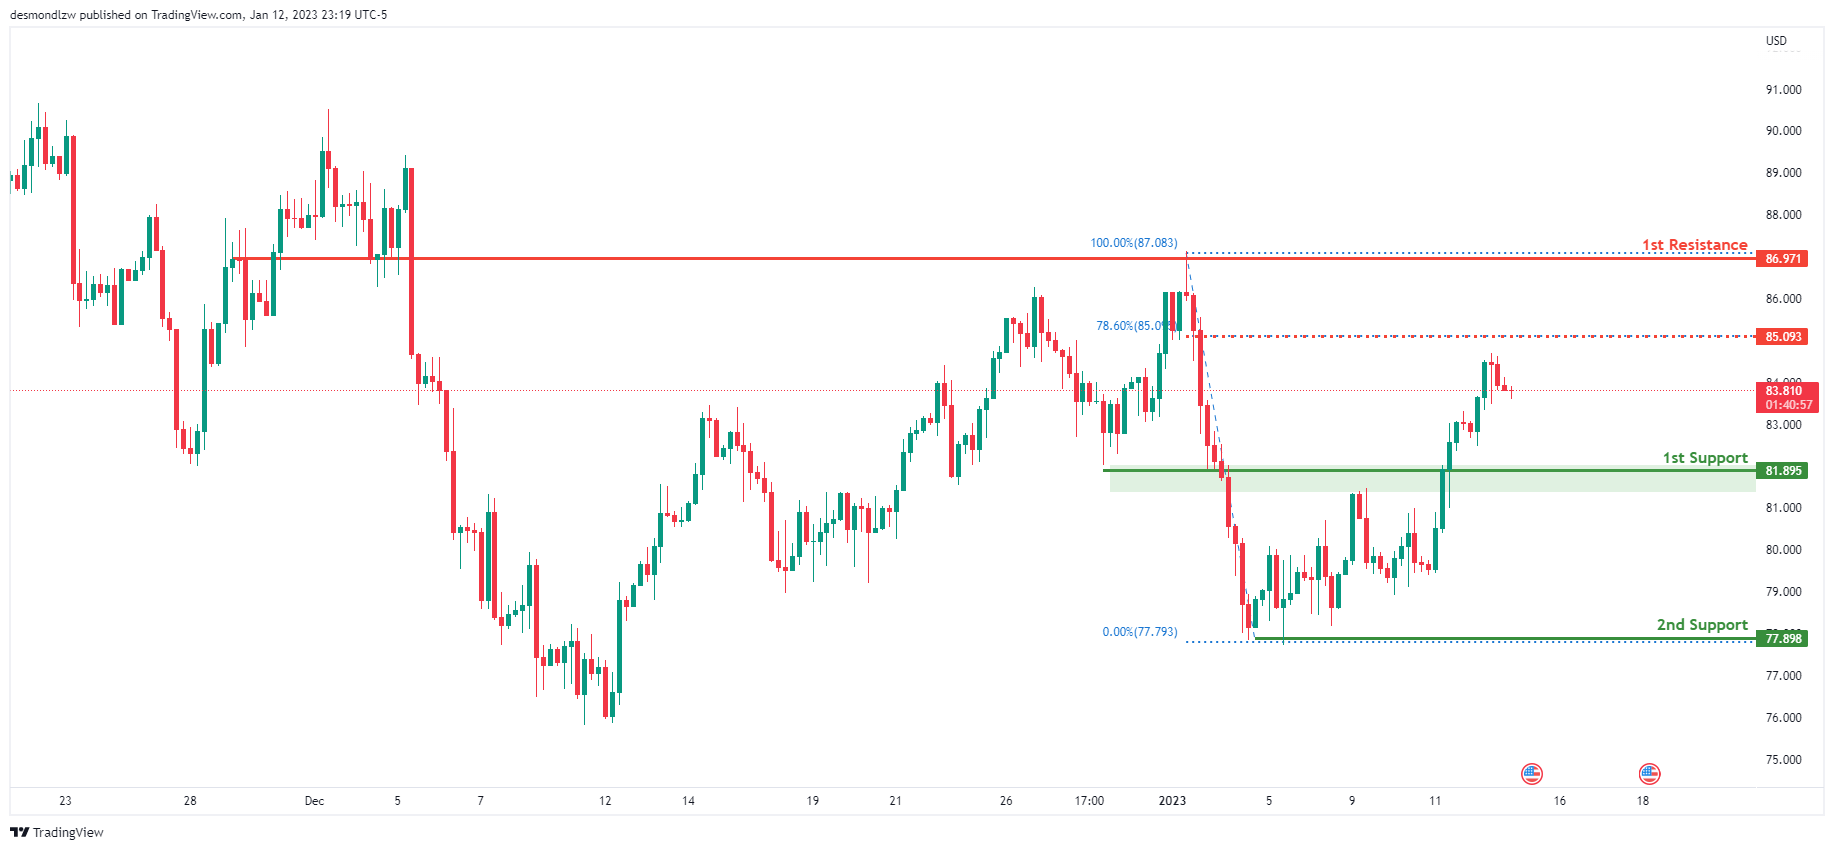
OIL:
Looking at the H4 chart, we can see that there is an intermediate resistance at 85.09 which is a pullback resistance that happens to line up with the 78.6% fibonacci retracement. If price breaks this level, we could see price head up to our 1st resistance level at 86.97 which is an overlap resistance.
In terms of support, we can see our 1st support at 81.89 which is an overlap support. Breaking this level would trigger a further drop to our 2nd support at 77.89.
Areas of consideration:
- H4 time frame, intermediate resistance at 85.09
- H4 time frame, 1st resistance at 86.97
- H4 time frame,1st support at 81.89
- Hr time frame, 2nd support at 77.89
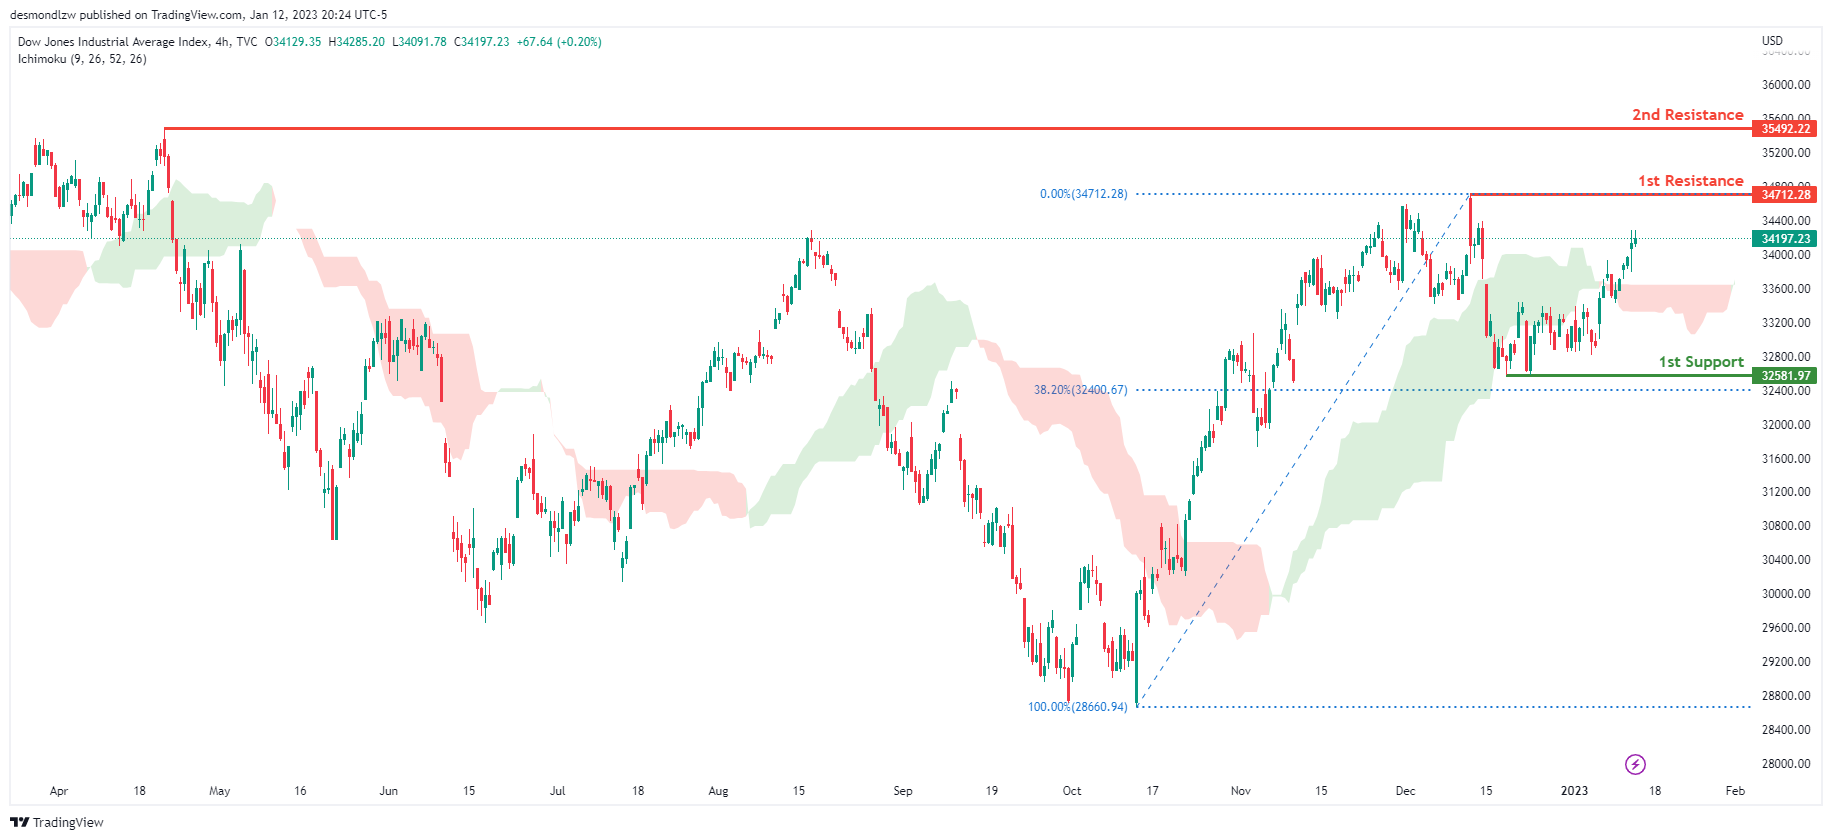
Dow Jones Industrial Average:
On the H4 chart, the overall bias for DJI is bullish. To add confluence to this, the price is crossing above the Ichimoku cloud which indicates a bullish market. If this bullish momentum continues, expect the price to possibly continue heading towards the 1st resistance line at 34712.28, where the recent swing high is. In an alternative scenario, price could possibly head back down towards the 1st support at 32581.97, slightly above where the 38.2% Fibonacci line is.
Areas of consideration:
- H4 time frame, 1st support at 32581.97
- H4 time frame, 1st Resistance at 34712.28
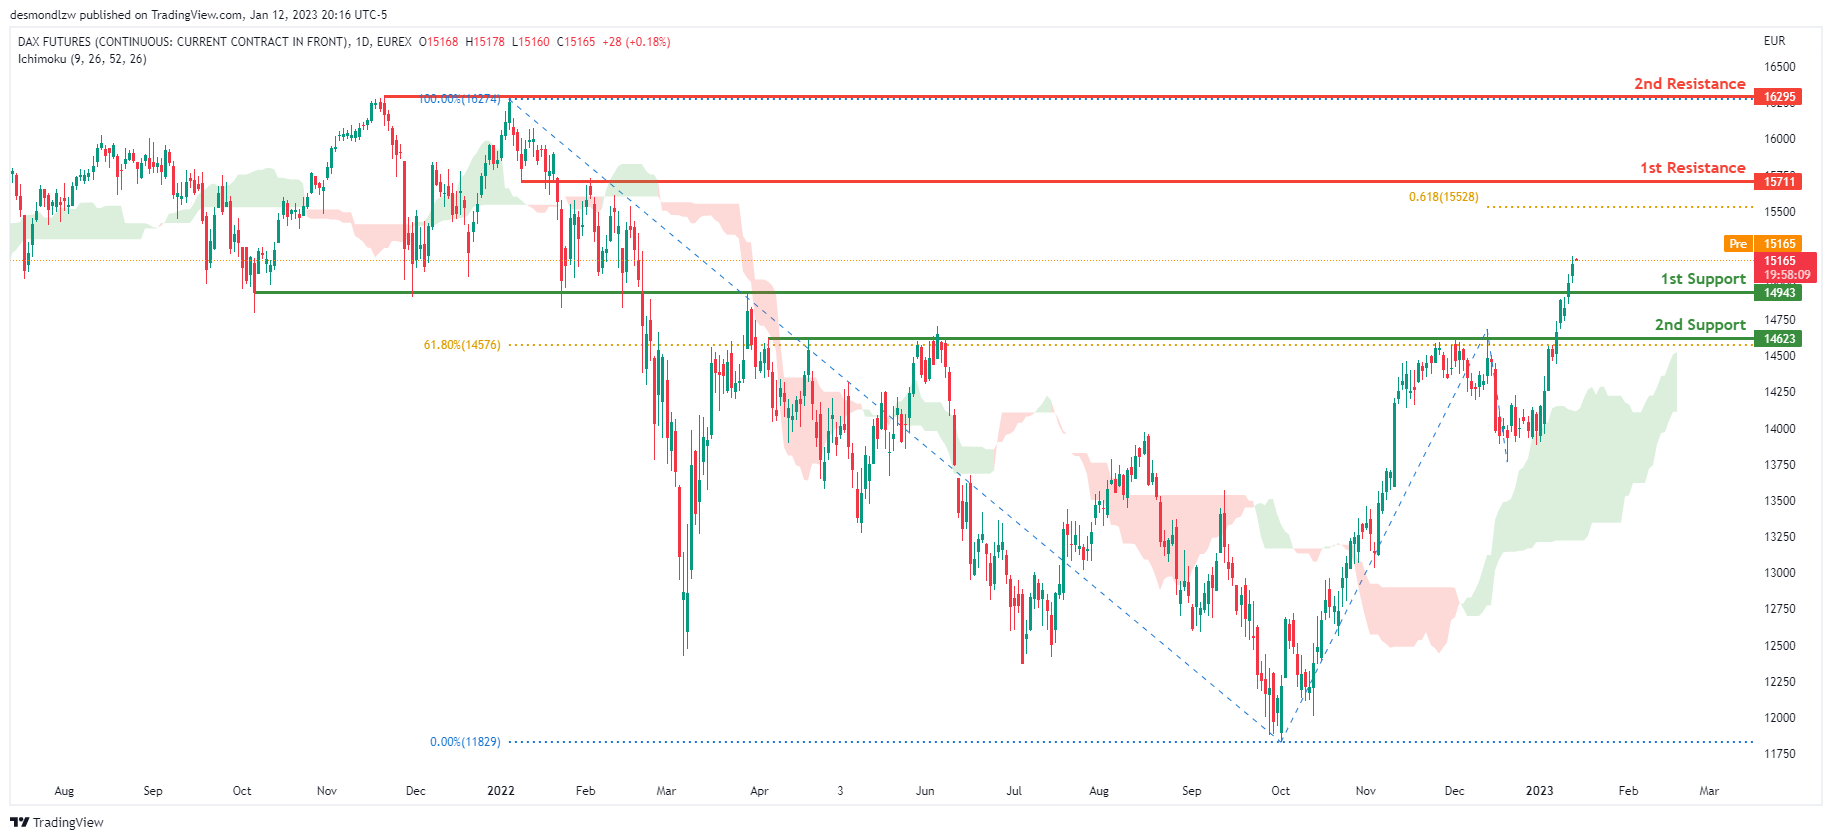
DAX:
Looking at the Daily chart, my overall bias for DAX is bullish due to the current price crossing above the Ichimoku cloud, indicating a bullish market. If this bullish momentum continues, expect the price to possibly head towards the 1st resistance line at 15711, where the 61.8% Fibonacci projection line is. In an alternative scenario, price could possibly head down to retest the 1st support at 14943, where the 61.8% Fibonacci line is.
Areas of consideration:
- H4 time frame, 1st resistance is at 15711
- H4 time frame, 1st support is at 14943
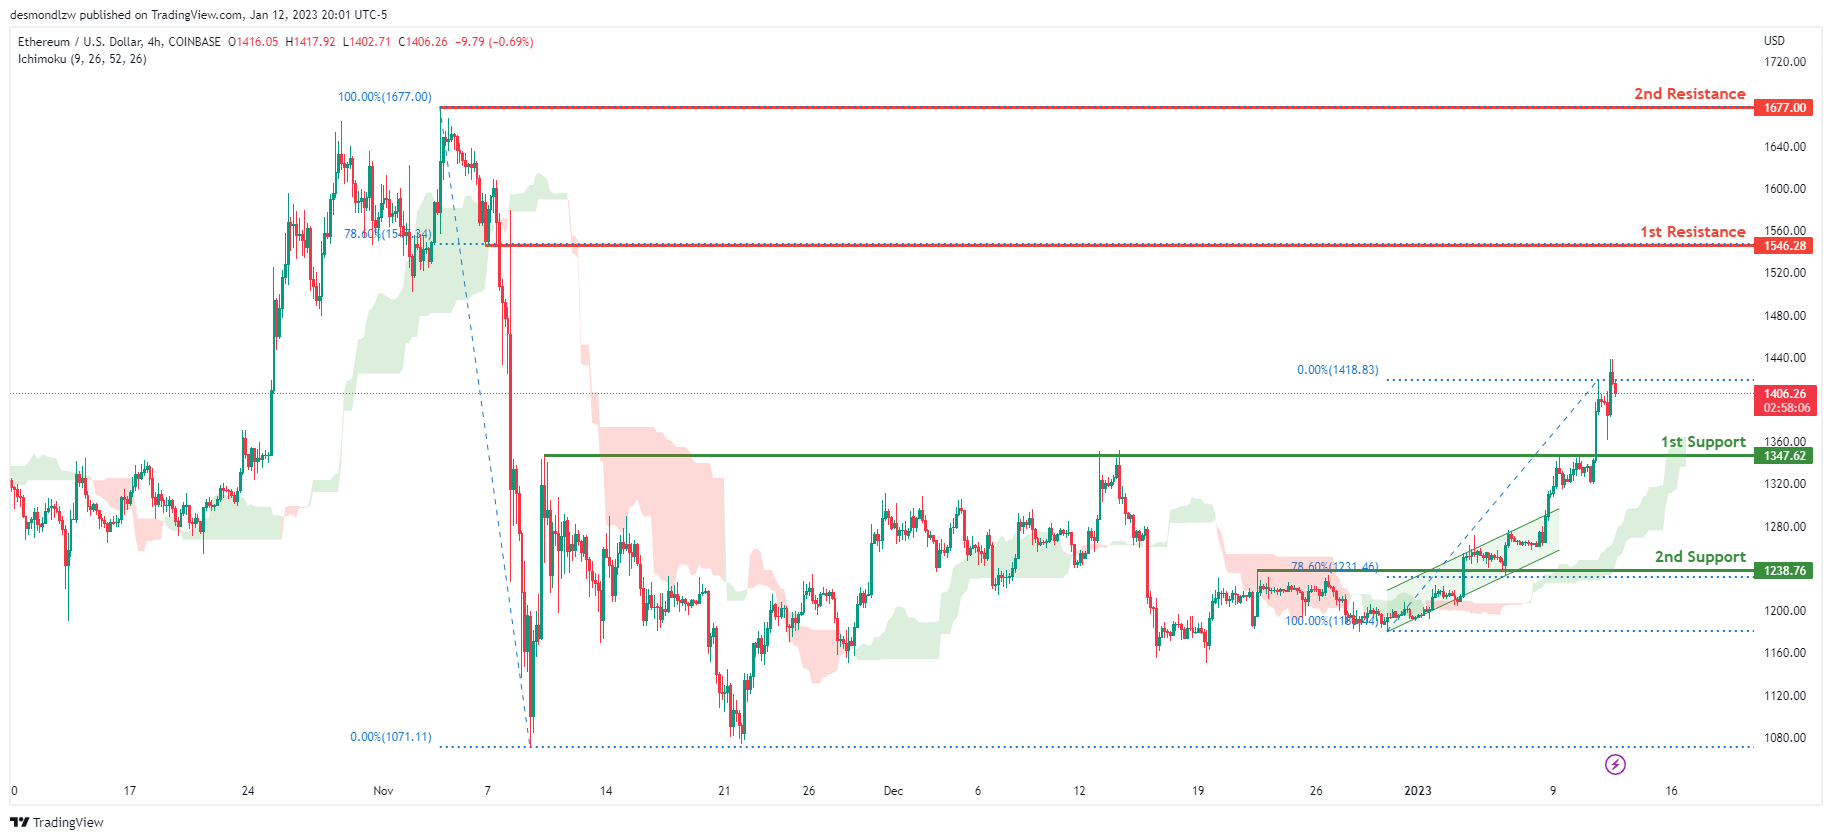
ETHUSD:
Looking at the H4 chart, my overall bias for ETHUSD is bullish due to the current price crossing above the Ichimoku cloud, indicating a bullish market. To add support to this bias, price is also broken upwards from an ascending channel. If this bullish momentum continues, expect the price to head towards the 1st resistance at 1546.28, where the 78.6% Fibonacci line is. In an alternative scenario, price could head back down to retest the 1st support at 1347.62, where the previous high is.
Areas of consideration:
- H4 time frame, 1st resistance of 1546.28
- H4 time frame, 1st support at 1347.62
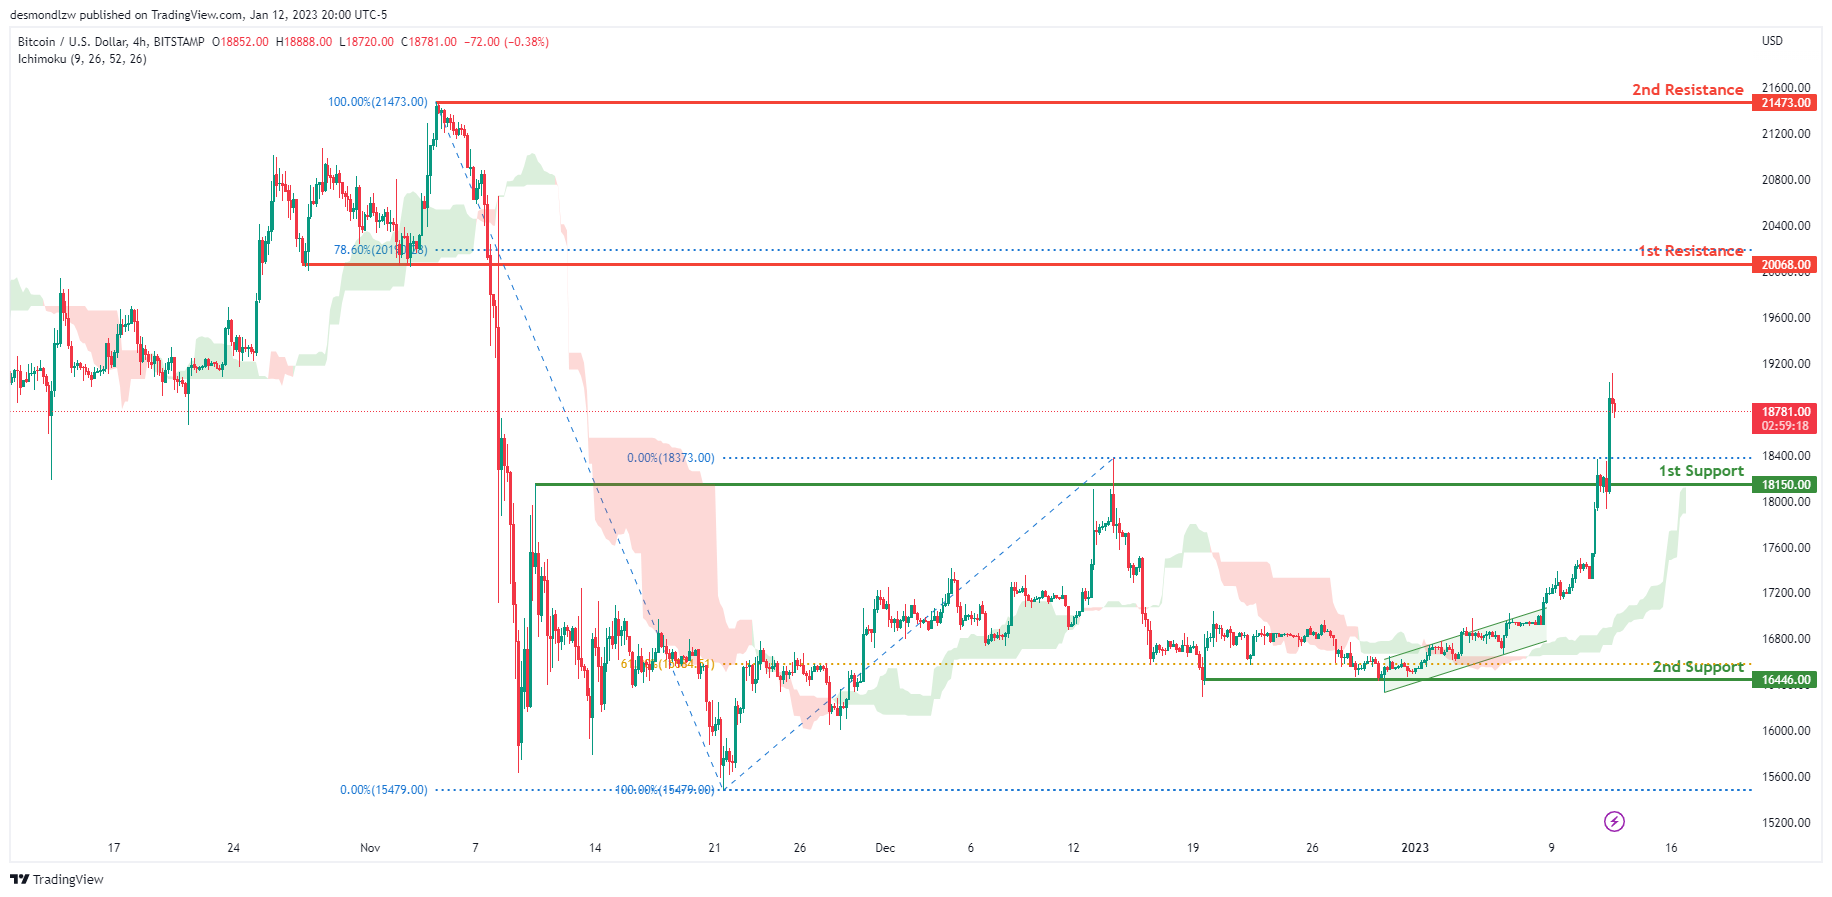
BTCUSD:
Looking at the H4 chart, my overall bias for BTCUSD is bullish due to the current price being above the Ichimoku cloud, indicating a bullish market. To add support to this bias, price has also broken above a bullish ascending channel. If this bullish momentum continues, expect the price to possibly continue heading towards the 1st resistance at 20068.00, where the 78.6% Fibonacci line is. In an alternative scenario, price could possibly head back down to retest the 1st support at 18150.00, where the previous high is..
Areas of consideration:
- H4 time frame, 1st resistance 20068.00
- H4 time frame, 1st support at 18150.00
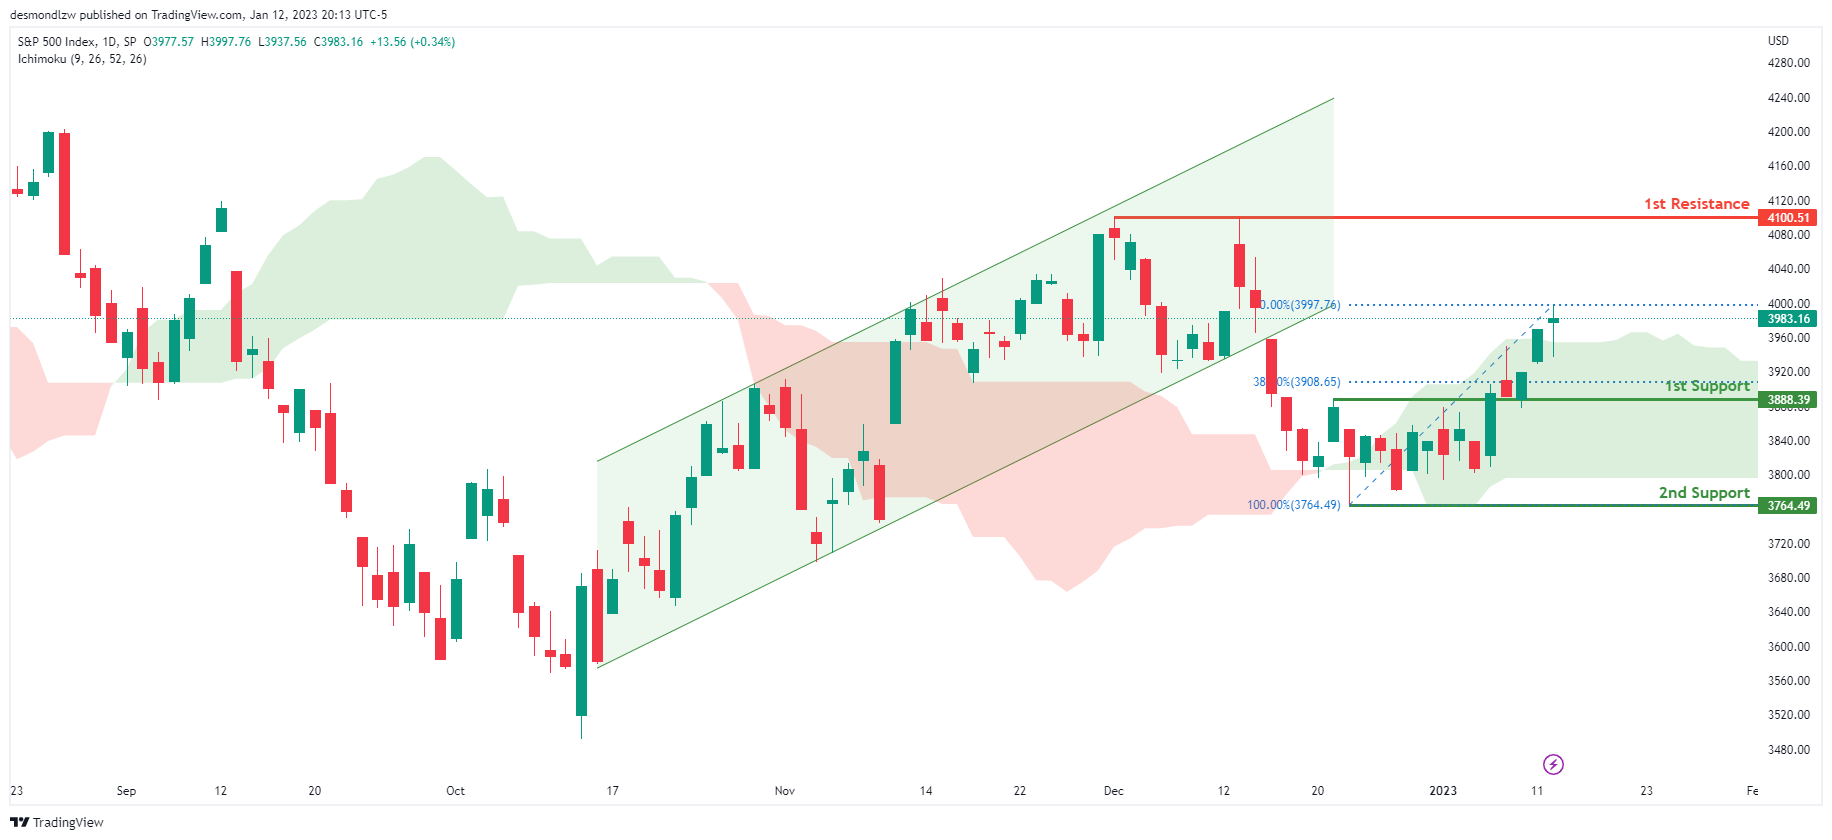
S&P 500:
Looking at the H4 chart, my overall bias for S&P500 is bullish due to the current price being above the Ichimoku cloud, indicating a bullish market. If this bullish momentum continues, expect the price to continue heading towards the 1st resistance at 4100.51, where the previous high is. In an alternative scenario, price could possibly head back down to retest the 1st support at 3888.39, where the 38.2% Fibonacci line is.
Areas of consideration:
- H4 time frame, 1st support at 3888.39
- H4 time frame, 1st resistance at 4100.51


