
- Nasdaq 100 reversed from pivotal resistance level 12200.00
- Likely to fall to support level 11600.00
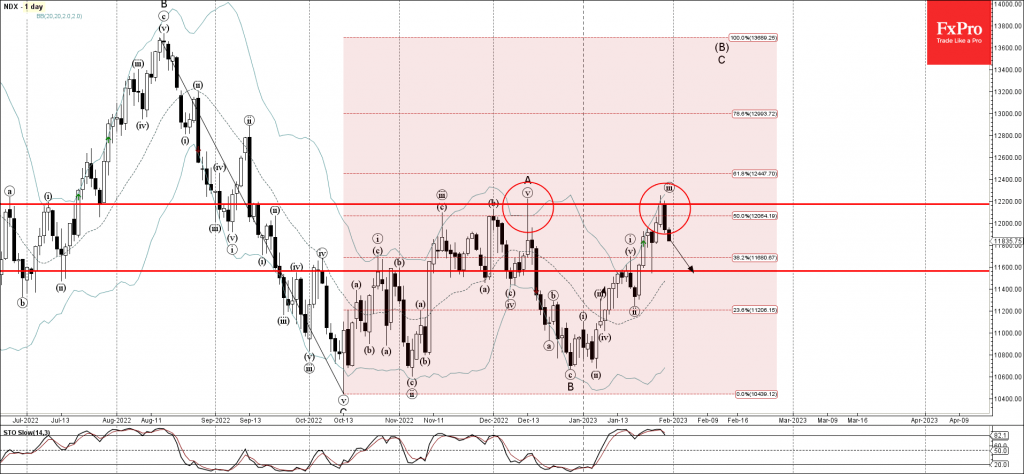
Nasdaq 100 index recently reversed from the pivotal resistance level 12200.00 (previous monthly high from December), intersecting with the upper daily Bollinger Band and the 50% Fibonacci correction of the downward impulse from August.
The downward reversal from the resistance level 12200.00 created the daily Japanese candlesticks reversal pattern Bearish Engulfing.
Nasdaq 100 index can be expected to fall further toward the next support level 11600.00 (low of the previous daily Hammer from last week).


