
In this article we’re going to take a quick look at the Elliott Wave charts of GOLD, published in members area of the website. As our members know, we have been favoring the long side in the commodity since the September of 2022. We recommended members to avoid selling , while keep favoring the long side. Recently we got 3 waves pull back that has reached our buying zone. In the further text we are going to explain the Elliott Wave Forecast and trading strategy.
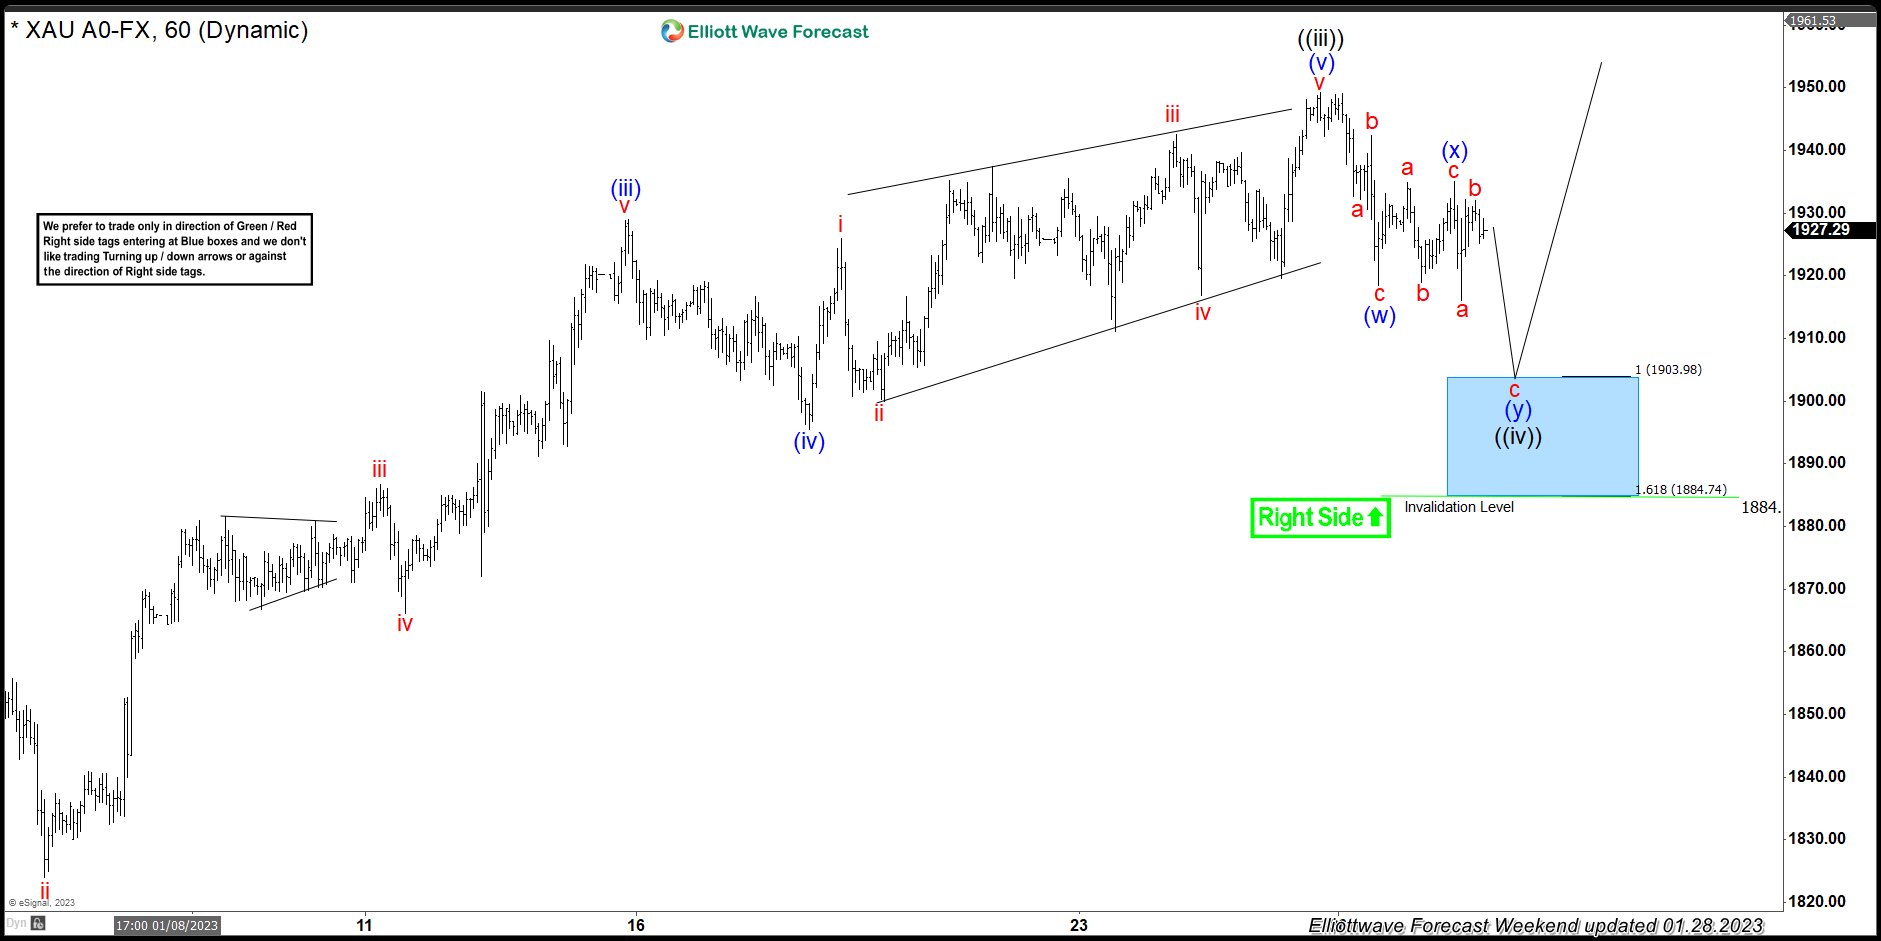
GOLD Elliott Wave 1 Hour Chart 1.28.2023
Current view suggests cycle from the 1726.4 low is still in progress as 5 waves structure. Currently, GOLD is doing wave ((iv)) pull back . The price structure of the pull back looks incomplete, it shows lower low sequences. So far we can count only 5 swings down from the peak. If we assume 6th swing is completed, we could be doing now last push down – 7th swing toward marked zone. Consequently we expect to get more short term weakness toward 1903.98-1884.74 area which would be our next buying zone. We don’t recommend selling the commodity against the main bullish trend. Strategy is waiting for the price to reach blue box- equal legs zone, before entering the long trades again. Once bounce reaches 50 Fibs against the (x) blue high , we will make long position risk free ( put SL at BE) and take partial profits. Invalidation for the long trades is break of 1.618 fib ext : 1884.7
Quick reminder:
Our charts are easy to trade and understand:
Red bearish stamp+ blue box = Selling Setup
Green bullish stamp+ blue box = Buying Setup
Charts with Black stamps are not tradable. 🚫
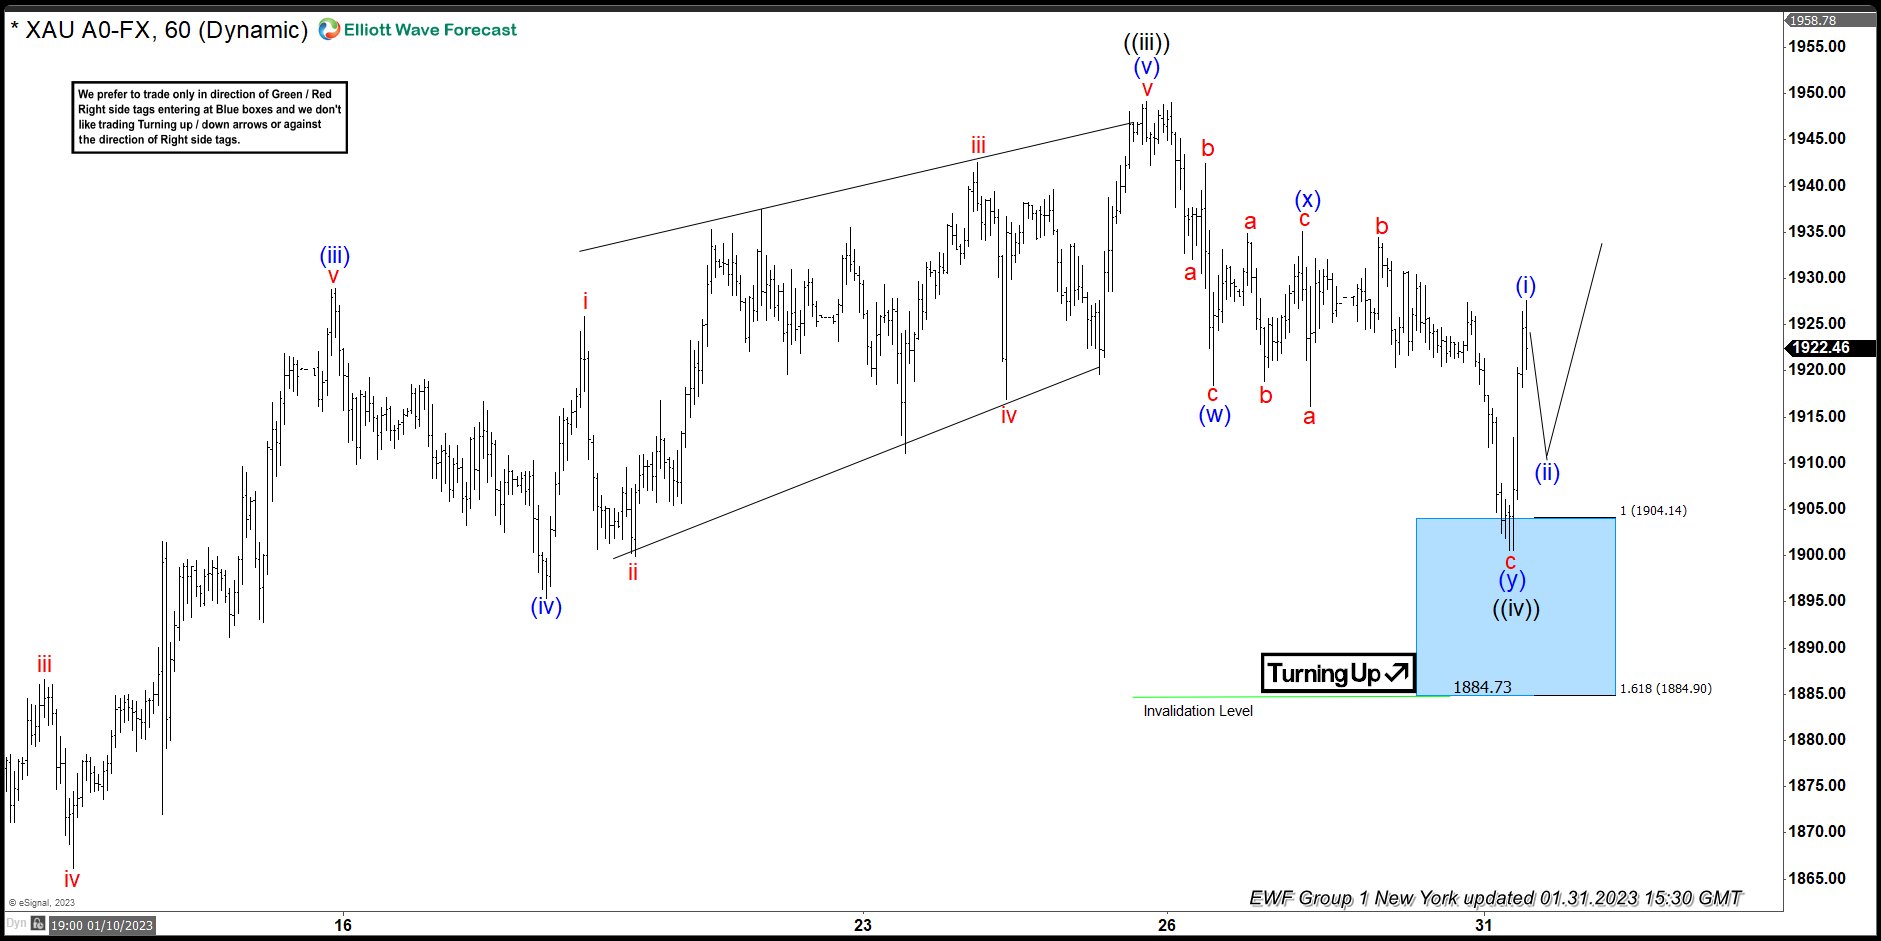
GOLD Elliott Wave 1 Hour Chart 1.31.2023
GOLD made 7th swing down and reached buying zone at 1903.98-1884.74 ( blue box) as expected. The commodity found buyers at the Blue Box zone and we are getting good reaction from there. The price reached and exceeded 50 fibs against the (x) blue connector. So, members who took the long trade are enjoying profits now in a risk free positions. We would like to see break above ((iii)) black peak to confirm next leg up is in progress.
Keep in mind that market is dynamic and presented view could have changed in the mean time. You can check most recent charts in the membership area of the site. Best instruments to trade are those having incomplete bullish or bearish swings sequences. We put them in Sequence Report and best among them are shown in the Live Trading Room.


