
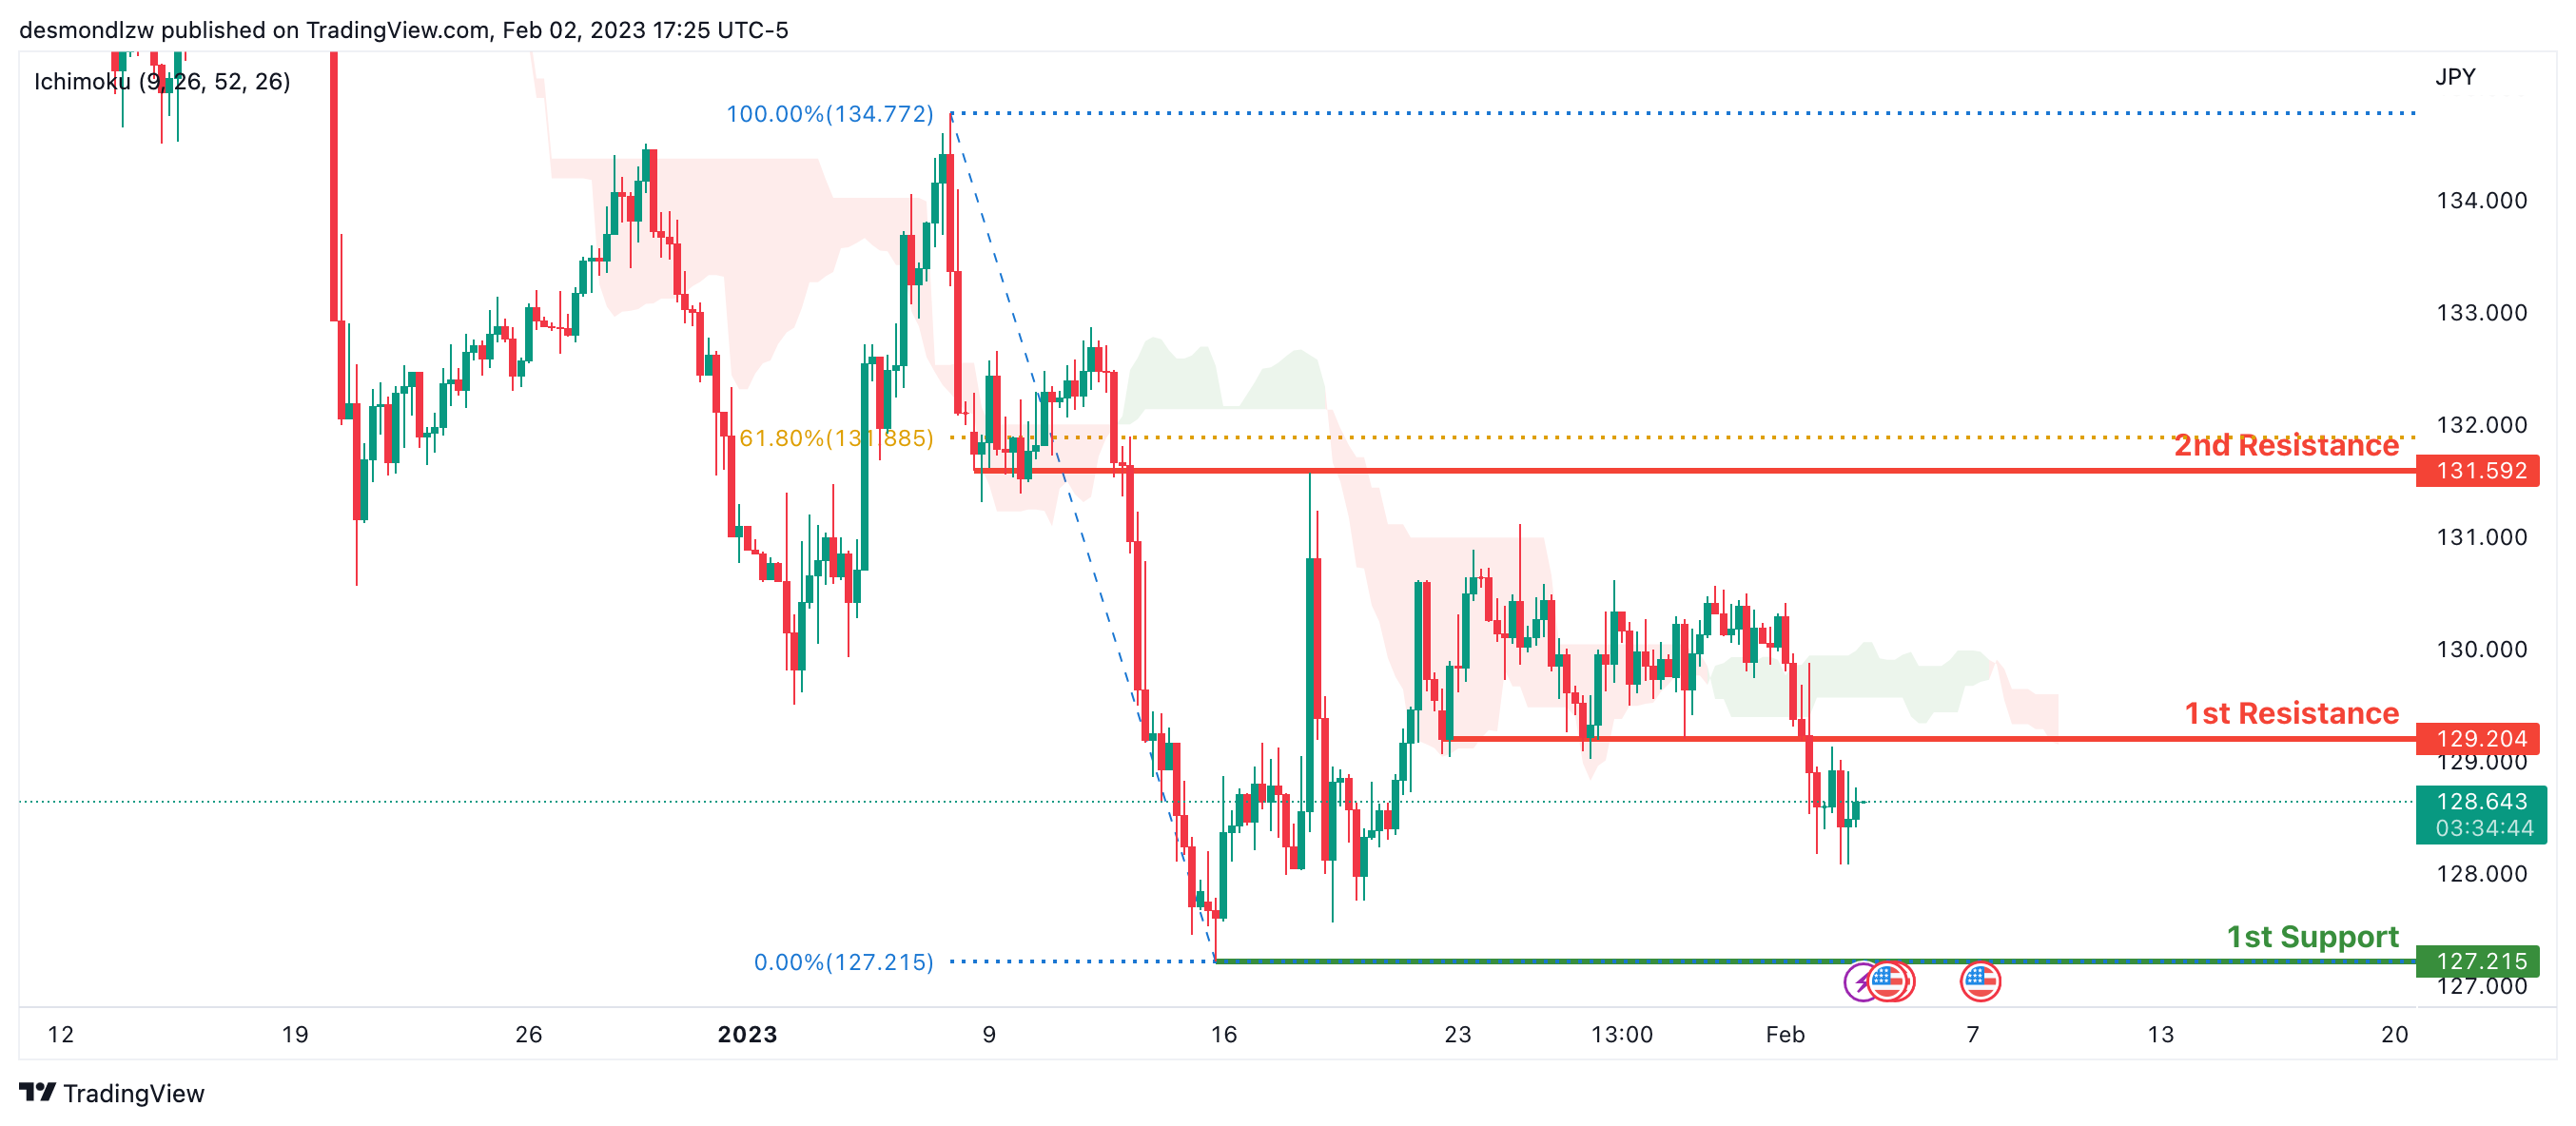
USD/JPY:
Looking at the H4 chart, my overall bias for USDJPY is bearish due to the current price crossing below the Ichimoku cloud, indicating a bearish market. If this bearish momentum continues, expect the price to possibly continue heading towards the 1st support at 127.215, where the previous swing low is. In an alternate scenario, price could possibly head back down to retest the 1st resistance at 129.204, where the overlap resistance is.
Areas of consideration:
- H4 time frame, 1st resistance at 129.204
- H4 time frame, 1st support at 127.215
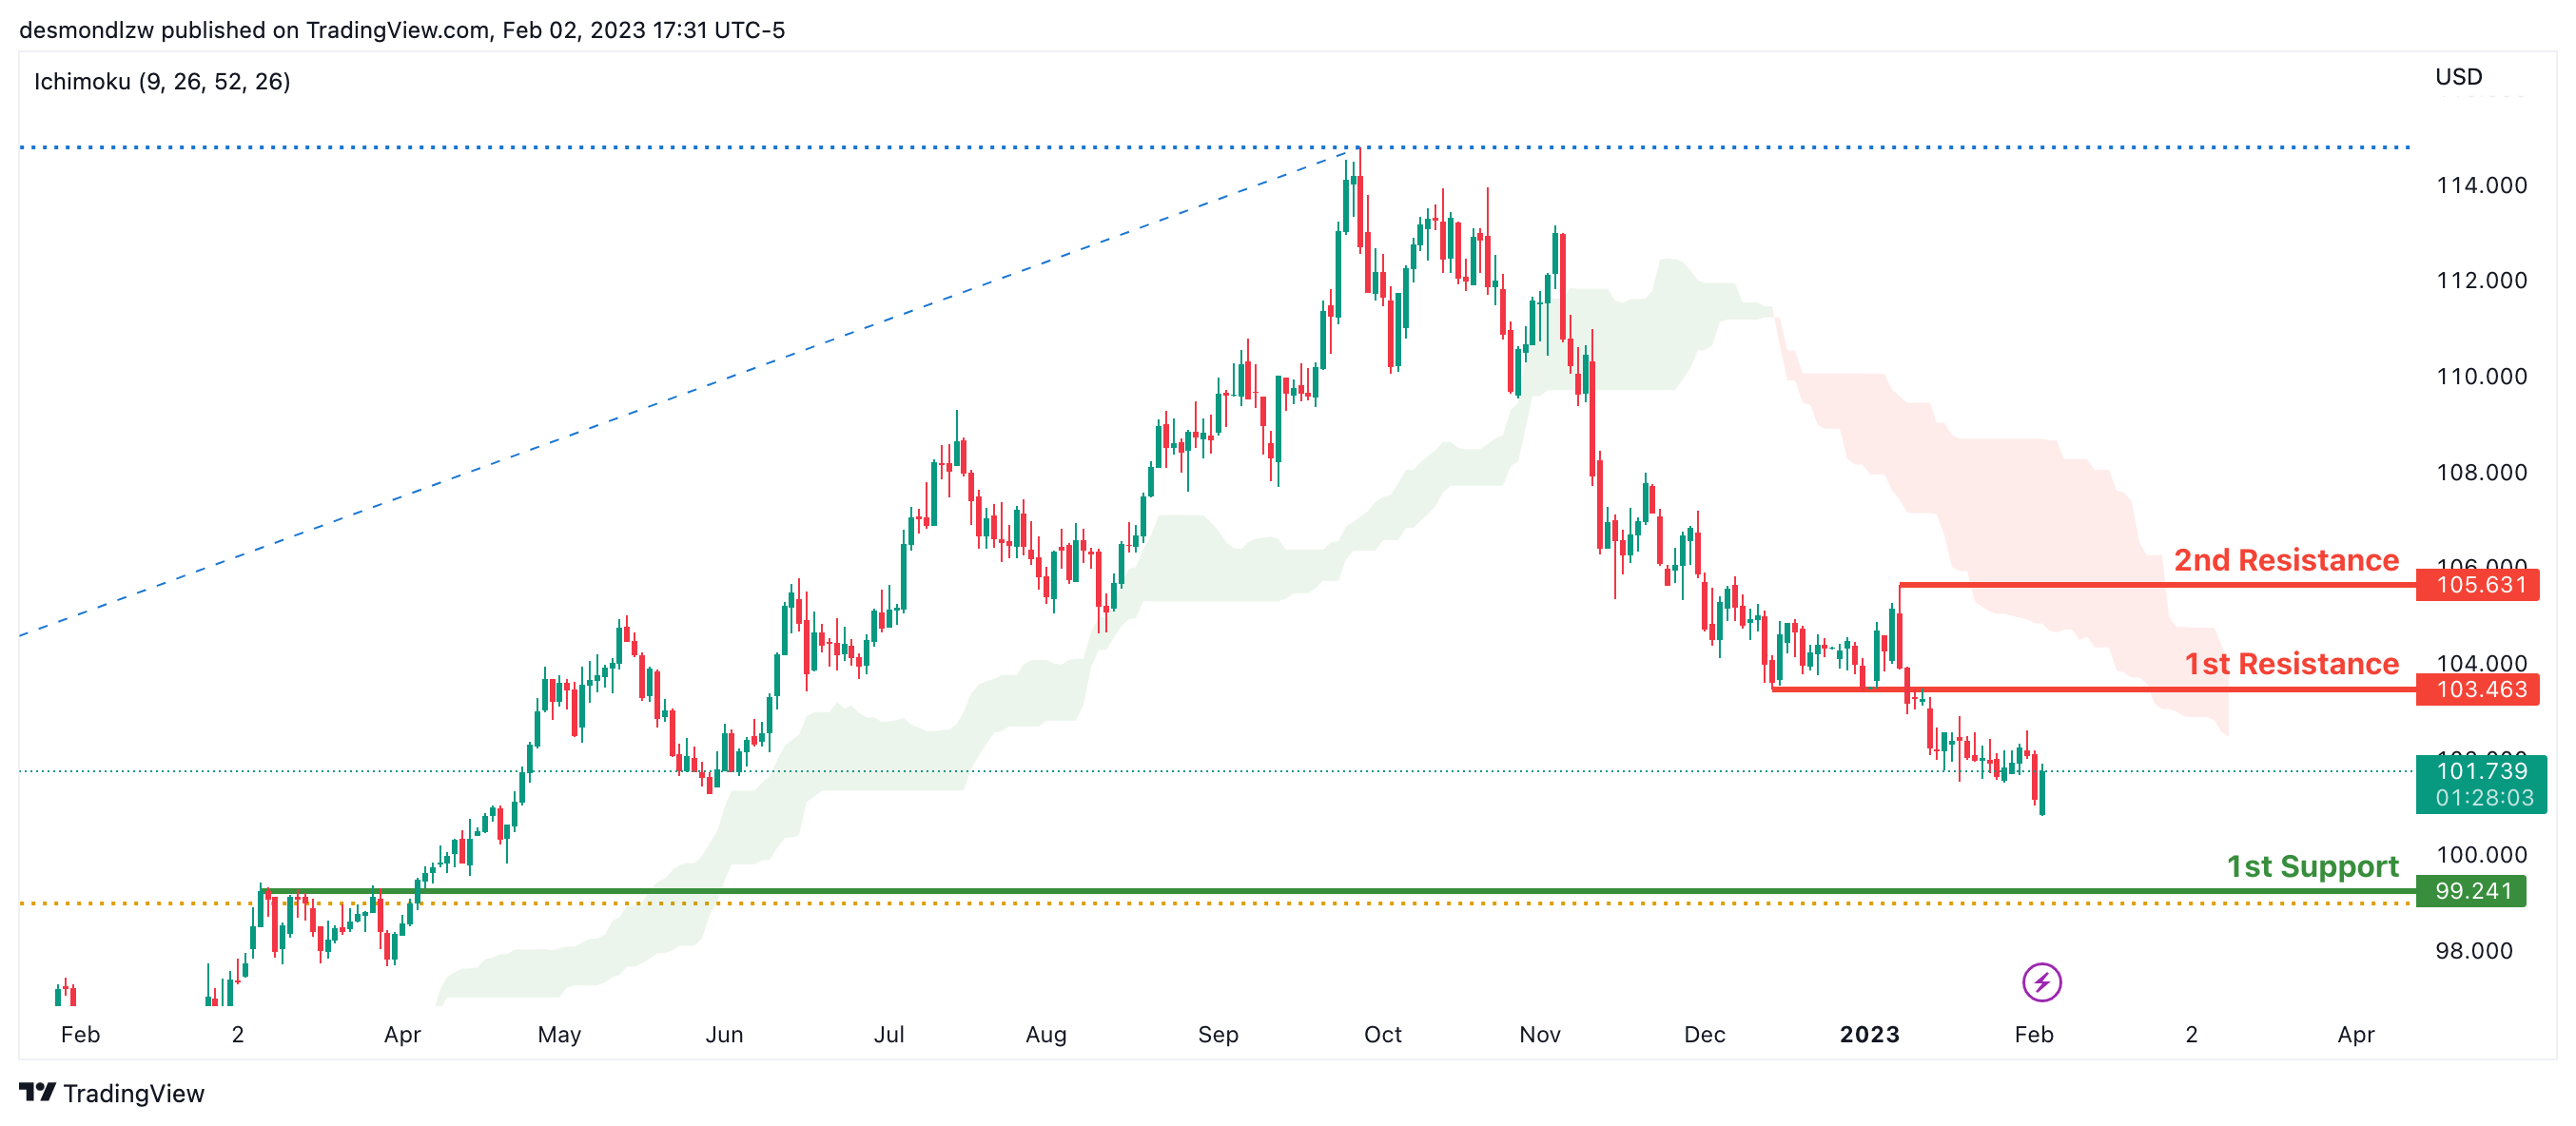
DXY:
Looking at the Daily chart, my overall bias for DXY is bearish due to the current price crossing below the Ichimoku cloud, indicating a bearish market. If this bearish momentum continues, expect the price to possibly continue heading towards the 1st support at 99.241, where the 61.8% Fibonacci line and overlap support is. In an alternative scenario, price could head back up to retest the 1st resistance at 103.463, where the overlap resistance is.
Areas of consideration:
- H4 time frame, 1st resistance at 103.463
- H4 time frame, 1st support at 99.241
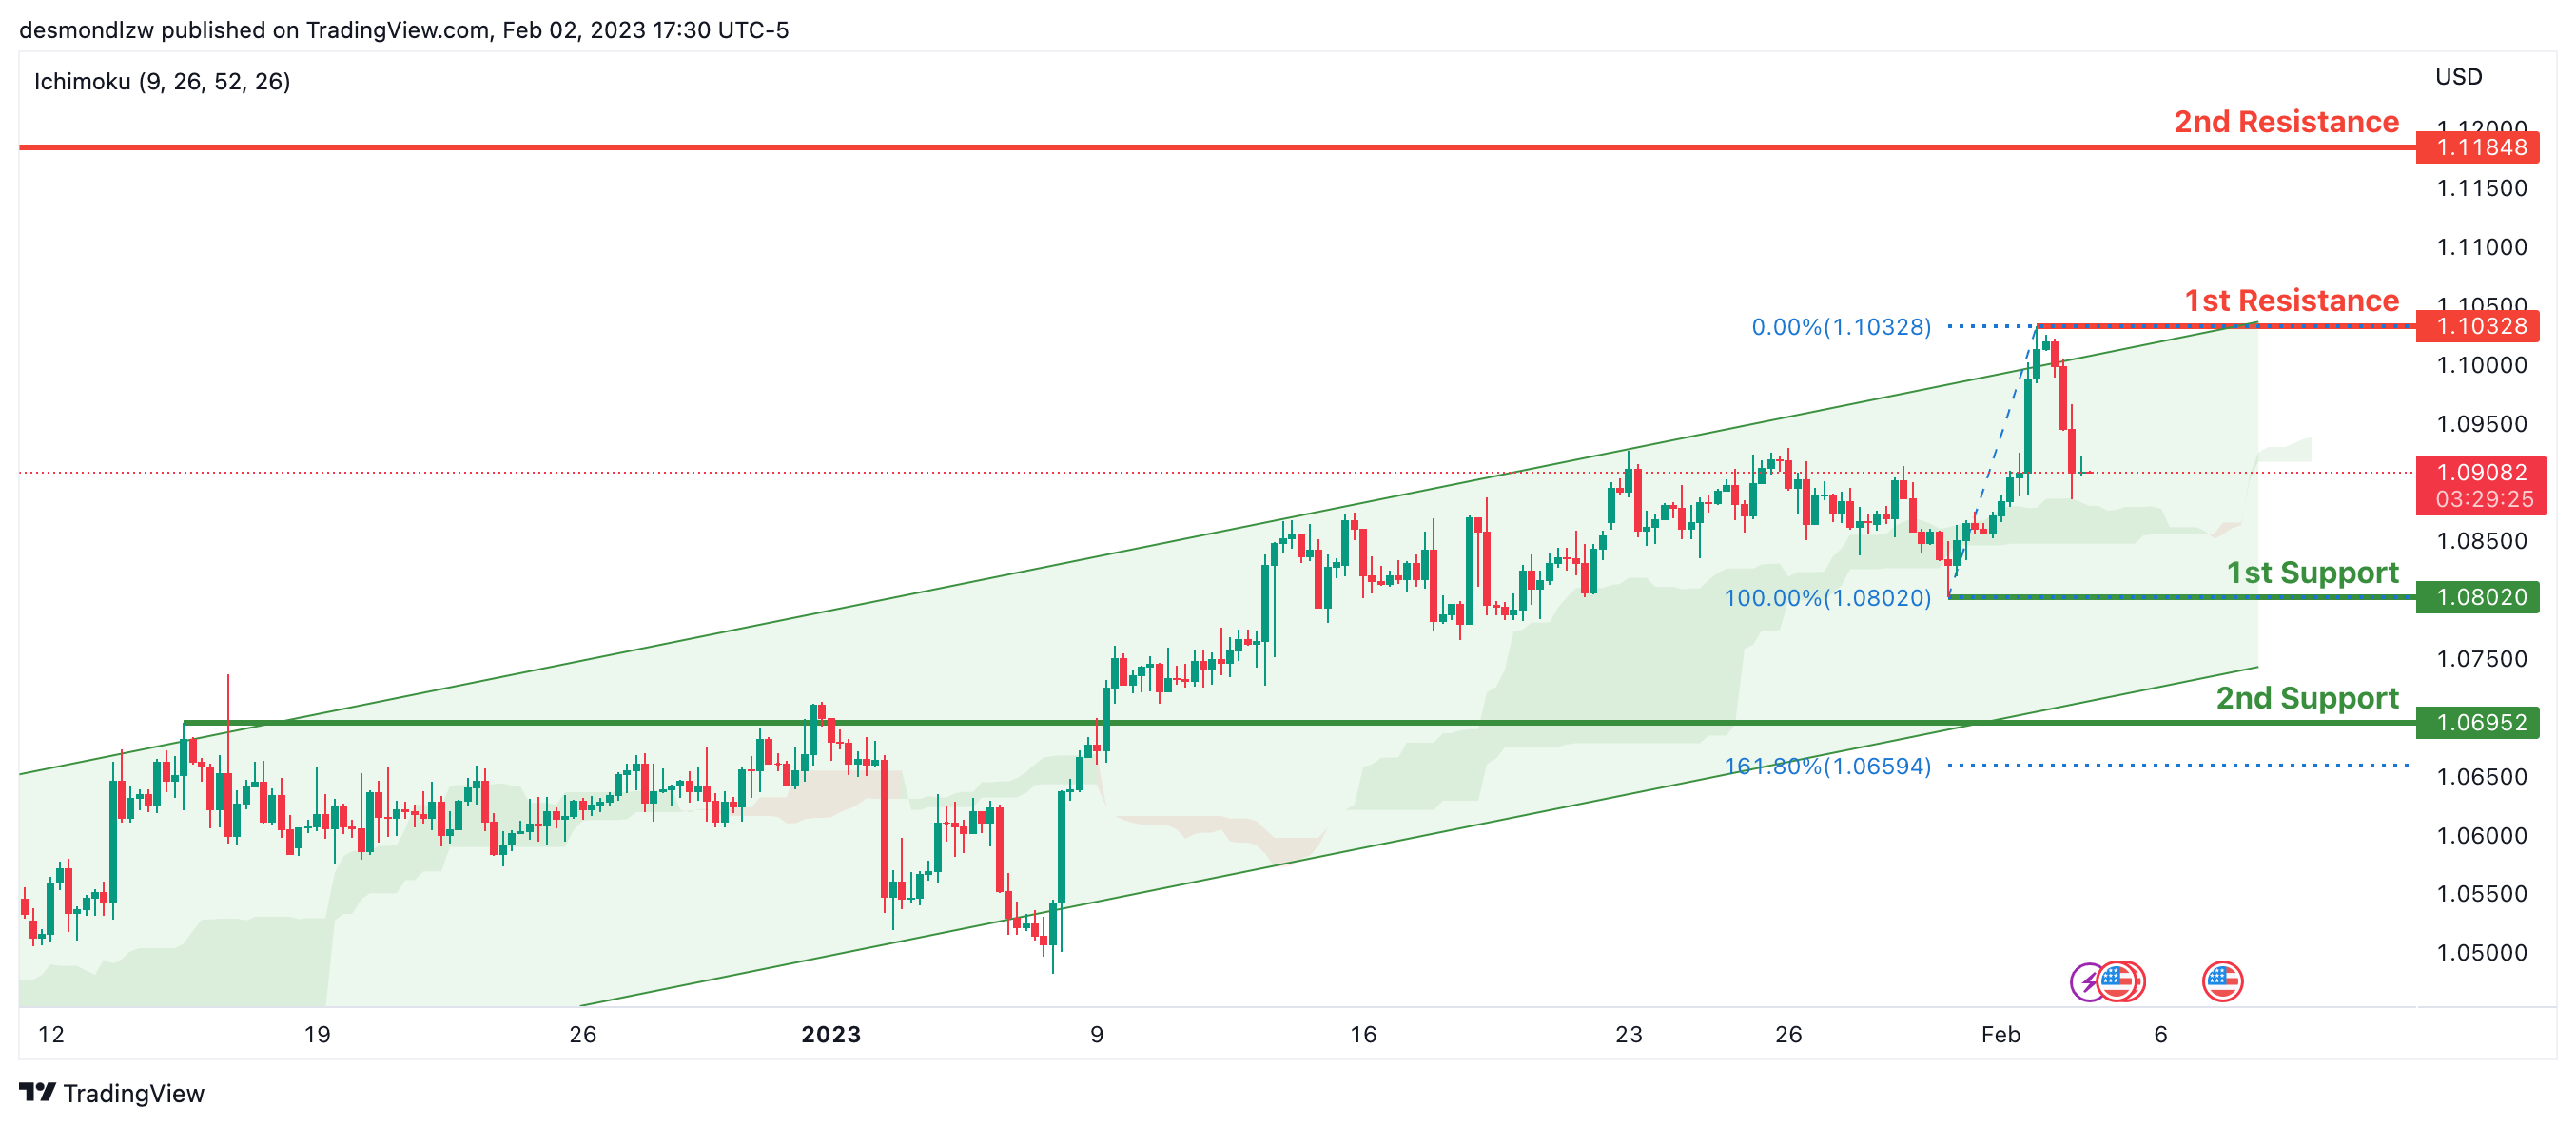
EUR/USD:
Looking at the H4 chart, my overall bias for EURUSD is bullish due to the current price crossing above the Ichimoku cloud, indicating a bullish market structure. To add confluence to this bias, price is also within an ascending channel. If this bullish momentum continues, expect the price to possibly continue heading towards the 1st resistance at 1.10328, where the recent swing high is. In an alternate scenario, price could possibly head back down to retest the 1st support level at 1.08020, where the recent low is.
Areas of consideration :
- H4 1st resistance at 1.10328
- H4 1st support at 1.08020
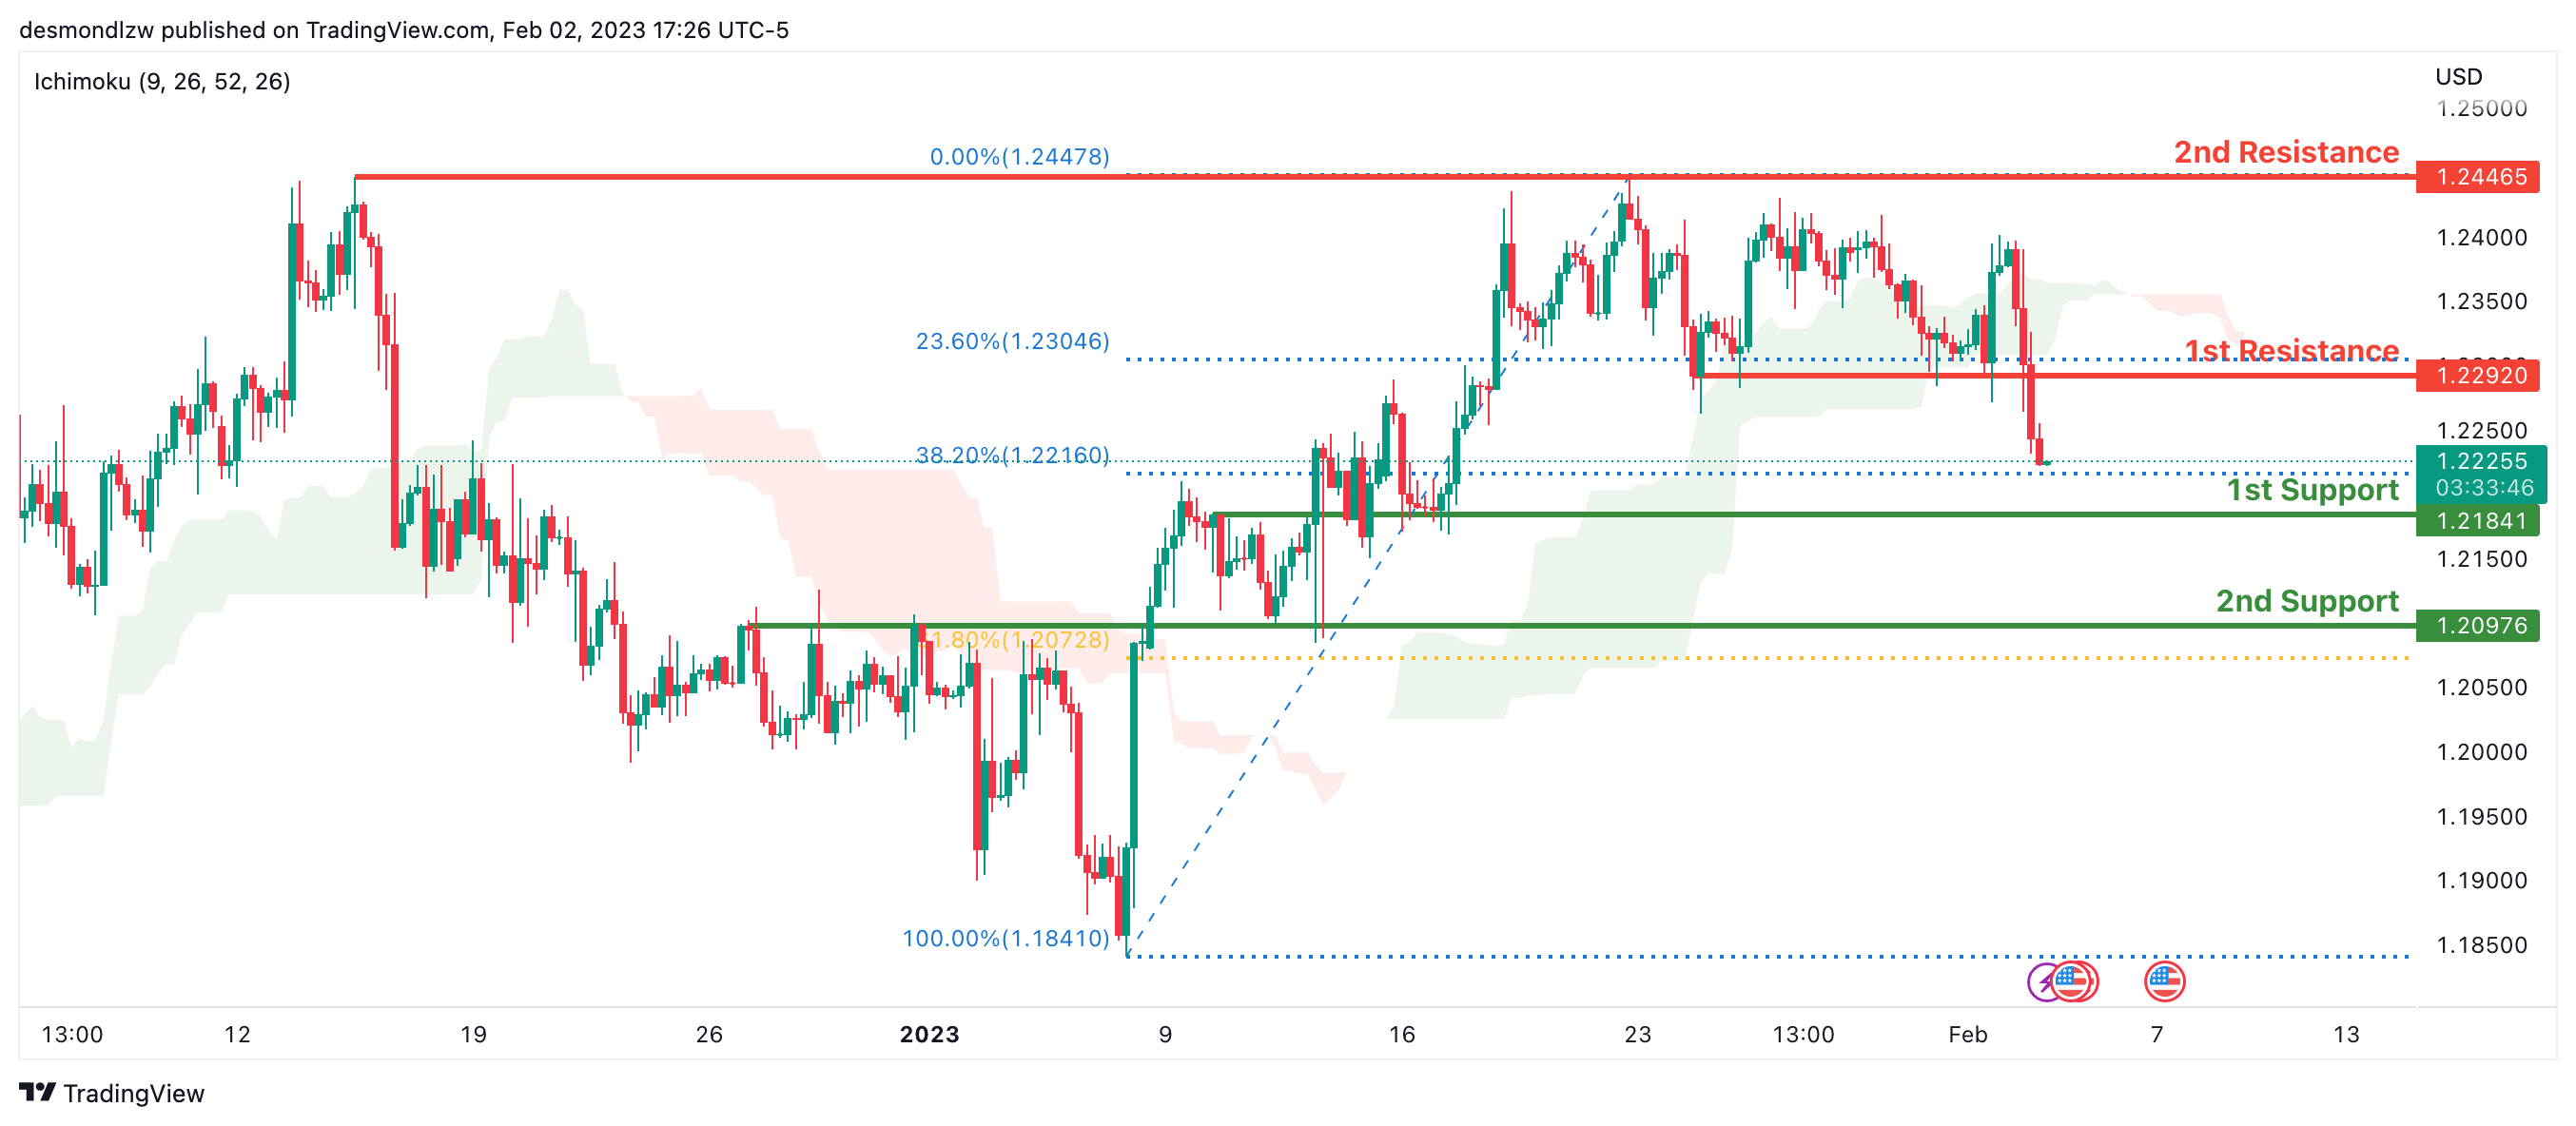
GBP/USD:
Looking at the H4 chart, my overall bias for GBPUSD is bearish due to the current price crossing below the Ichimoku cloud, indicating a bearish market. If this bearish momentum continues, expect the price to possibly continue to head towards the 1st support at 1.21841, where the 38.2% Fibonacci line is In an alternate scenario, price could head back up to retest the 1st resistance line at 1.22920, where the overlap resistance is.
Areas of consideration:
- H4 1st resistance at 1.22920
- H4 1st support at 1.21841
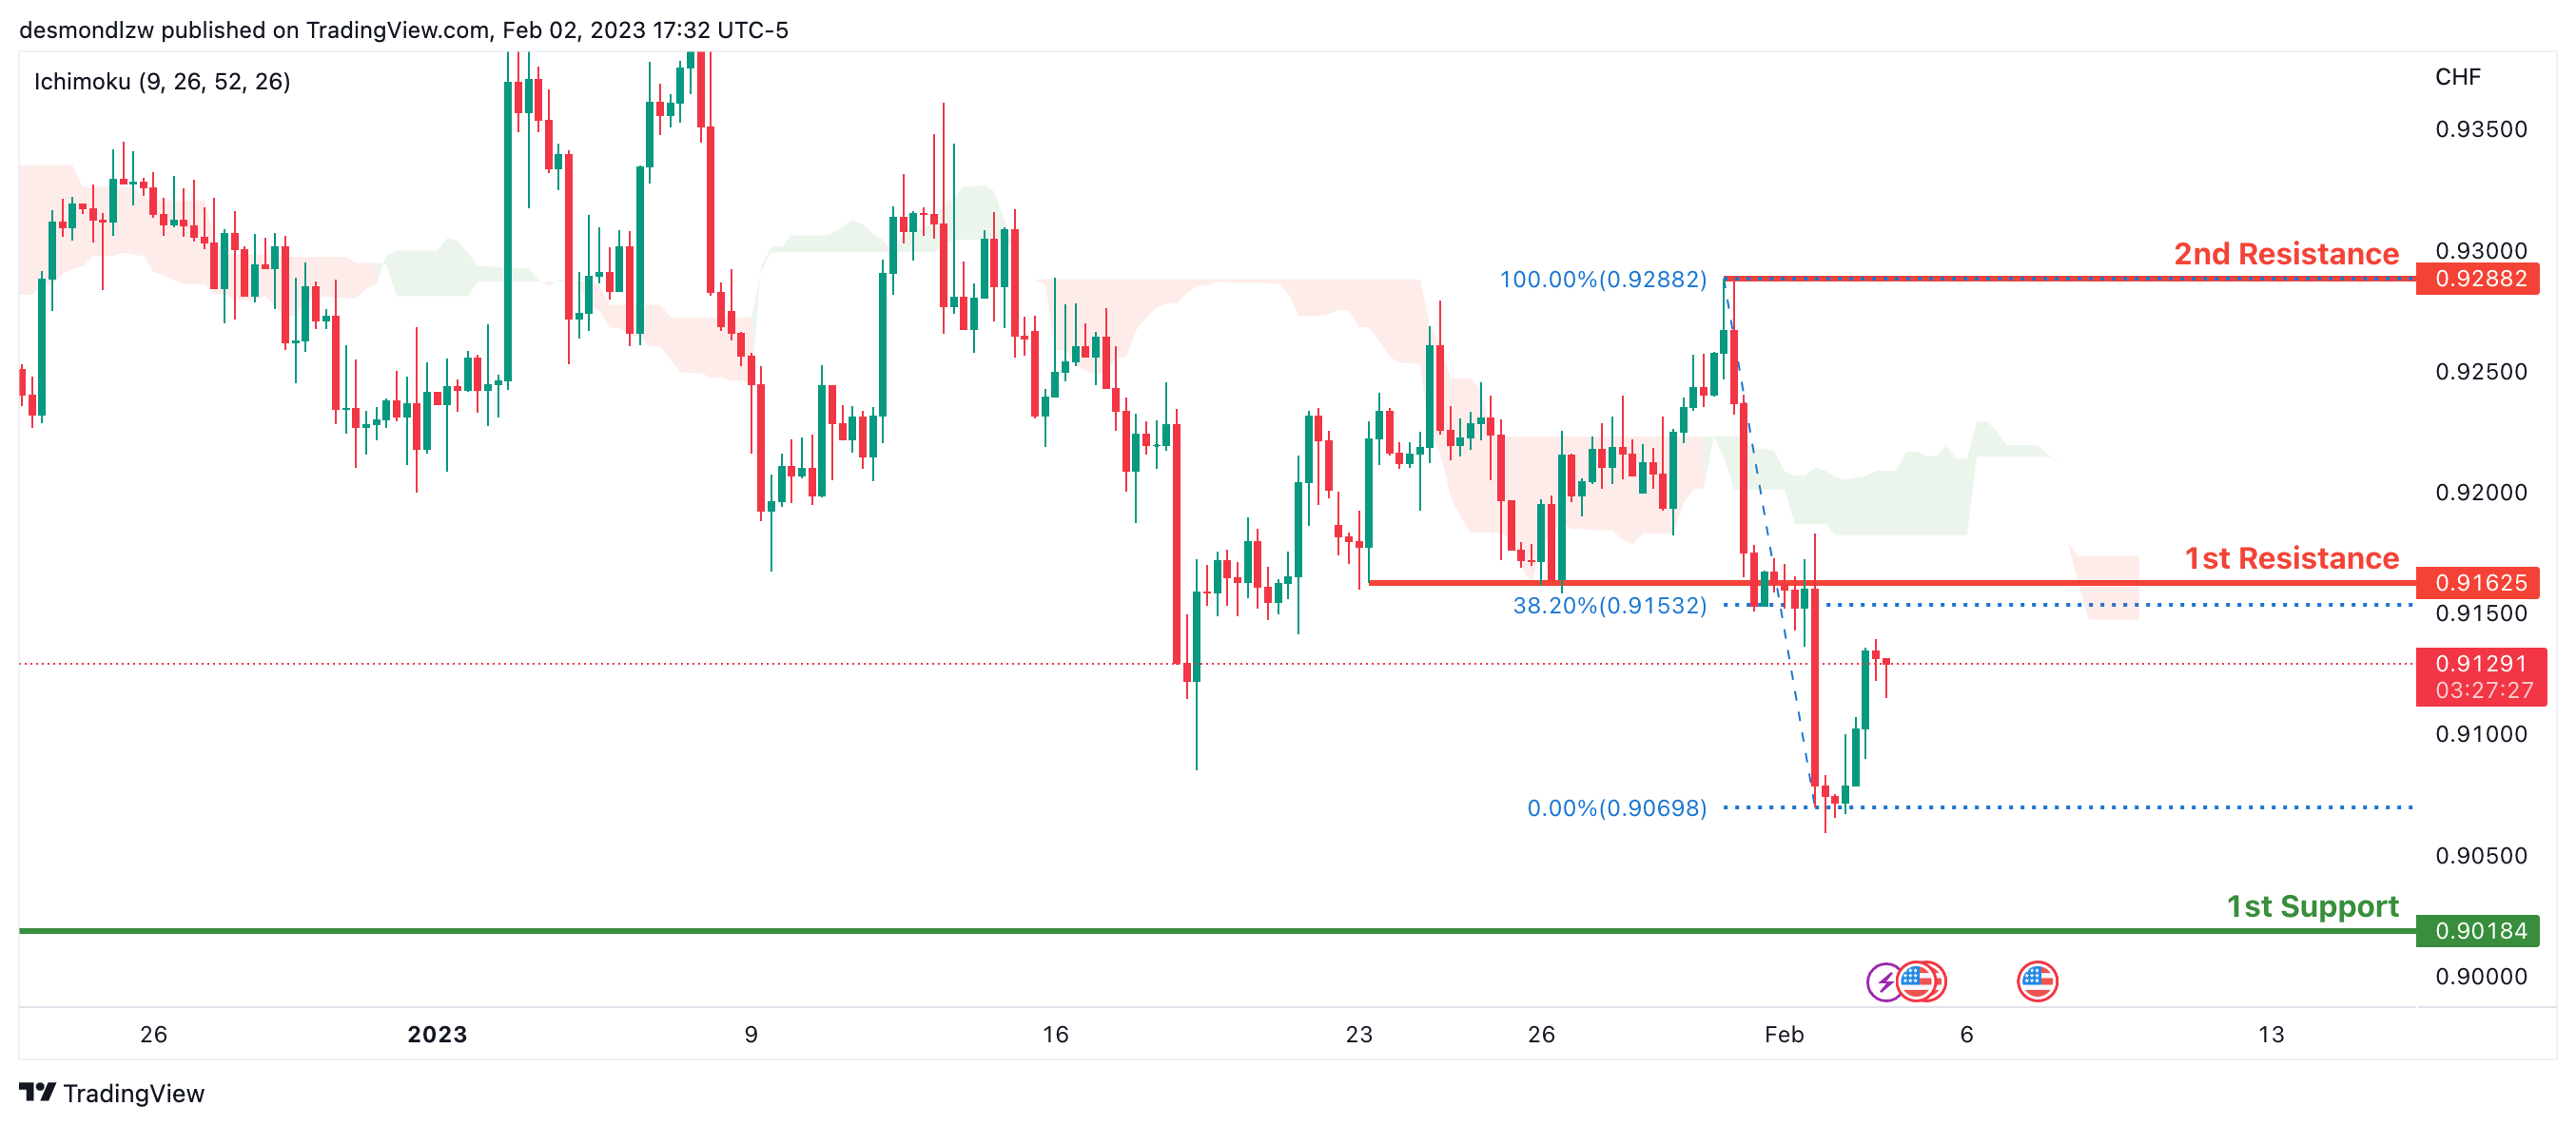
USD/CHF:
Looking at the H4 chart, my overall bias for USDCHF is bearish due to the current price being below the Ichimoku cloud, indicating a bearish market. If the current bearish trend continues, expect the price to possibly continue to head towards the 1st support at 0.90184, where the previous swing low is. In an alternative scenario, price could possibly head back up to retest the 1st resistance at 0.91625, where the 38.2% Fibonacci line is.
Areas of consideration
- H4 1st support at 0.90184
- H4 1st resistance at 0.91625
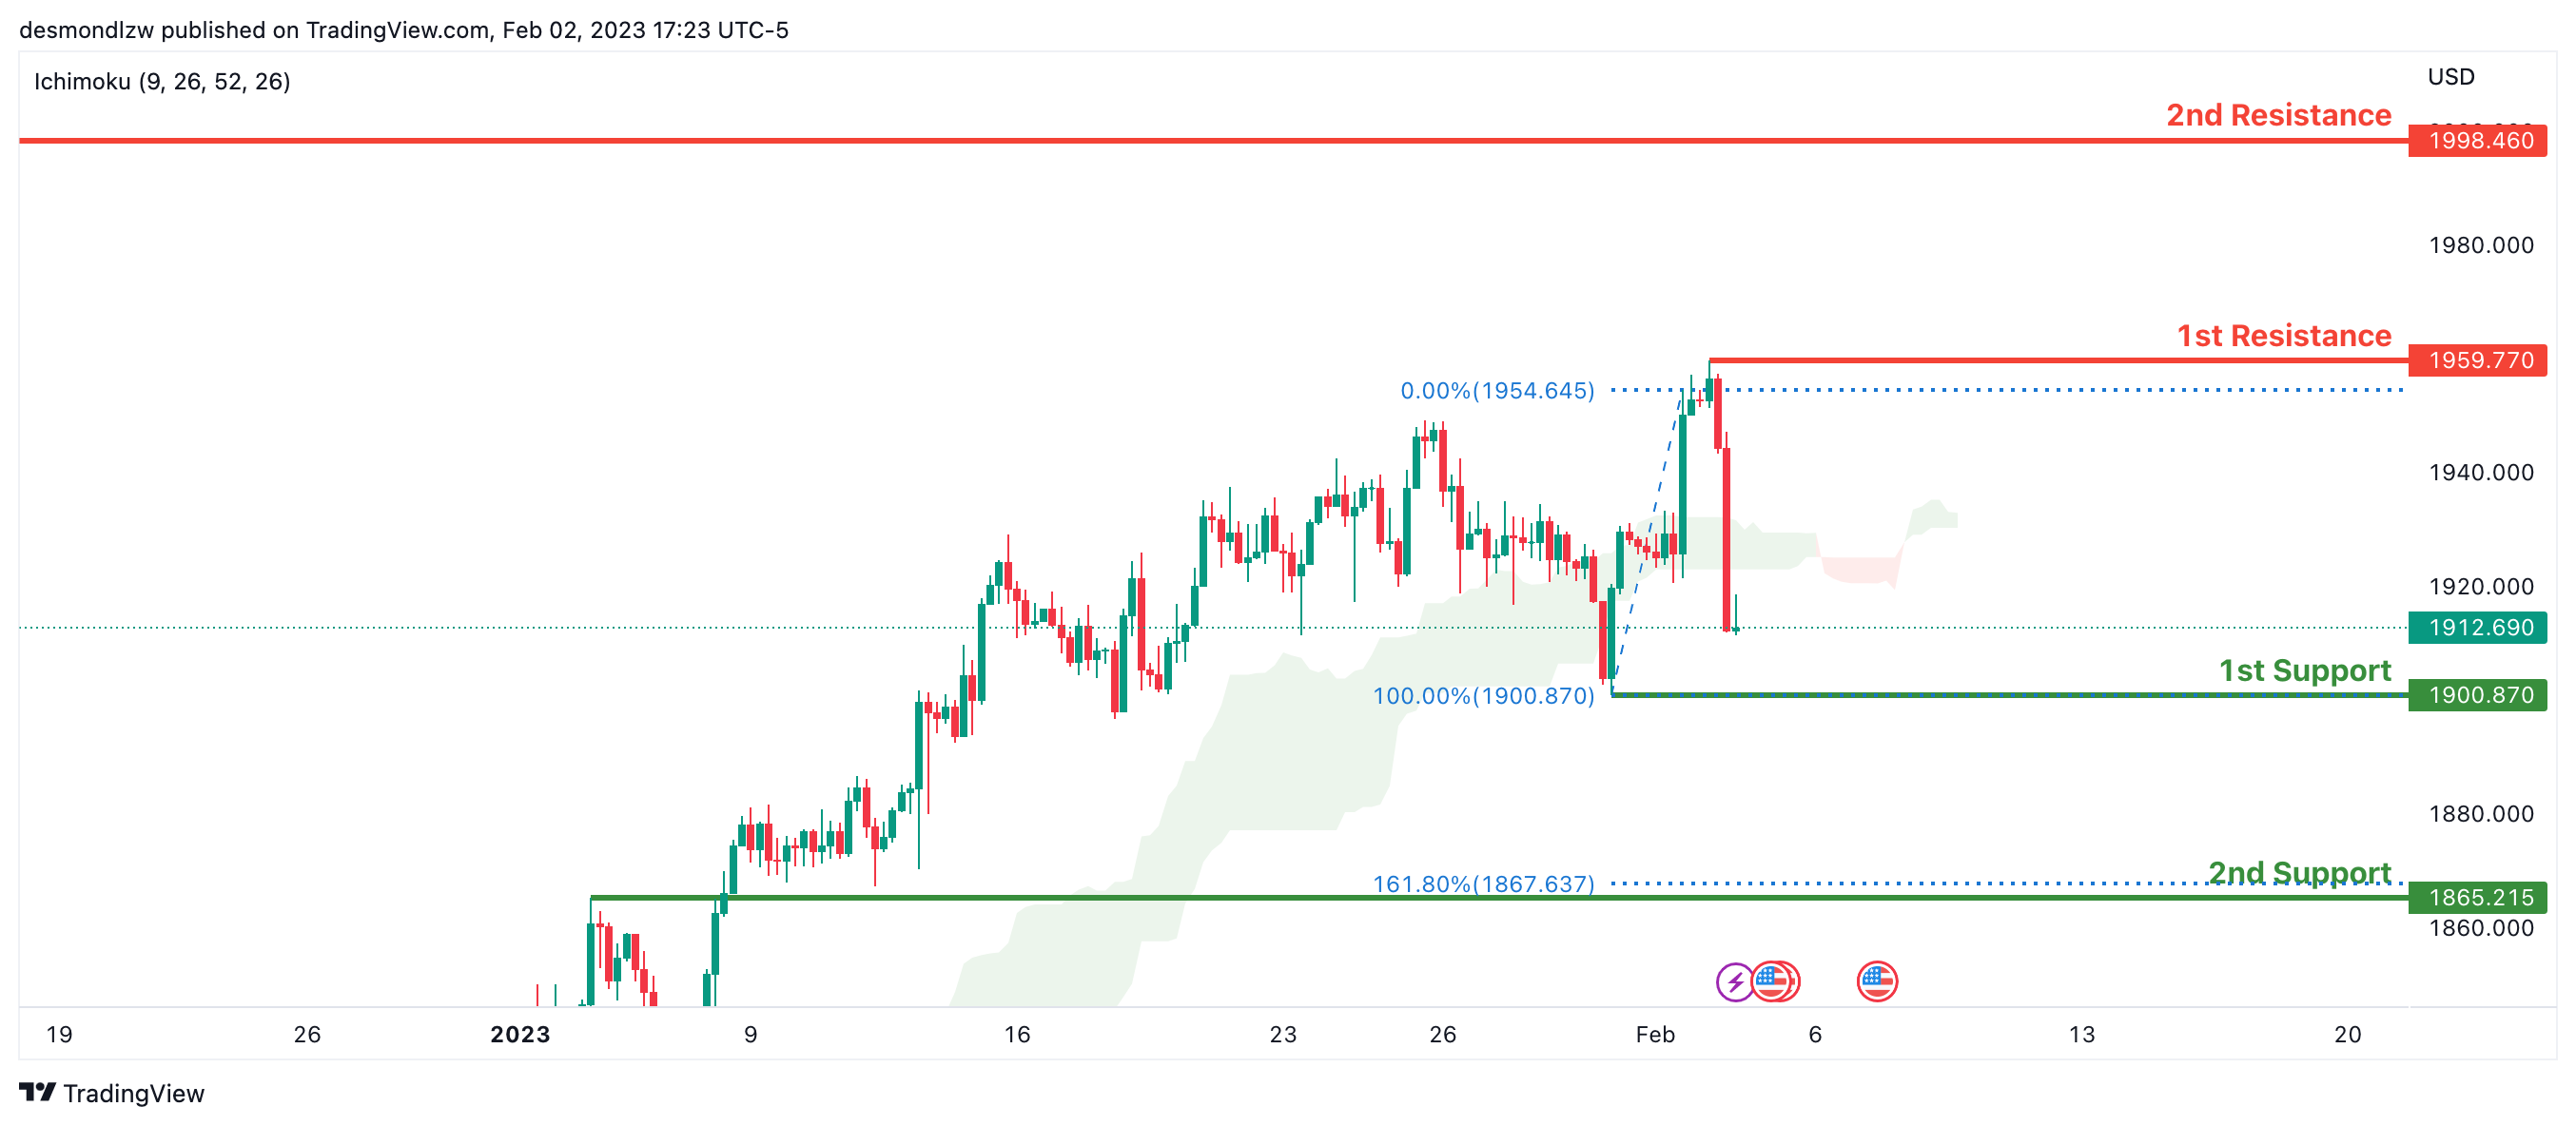
XAU/USD (GOLD):
Looking at the H4 chart, my overall bias for XAUUSD is bearish due to the current price being below the Ichimoku cloud, indicating a bearish market. If this bearish momentum continues, expect the price to possibly continue heading towards the 1st support at 1900.870 where the recent low is. In an alternative scenario, price could possibly head back up to retest the 1st resistance at 1959.770, where the previous swing high is.
Areas of consideration:
- H4 time frame, 1st resistance at 1959.770
- H4 time frame, 1st support at 1900.870
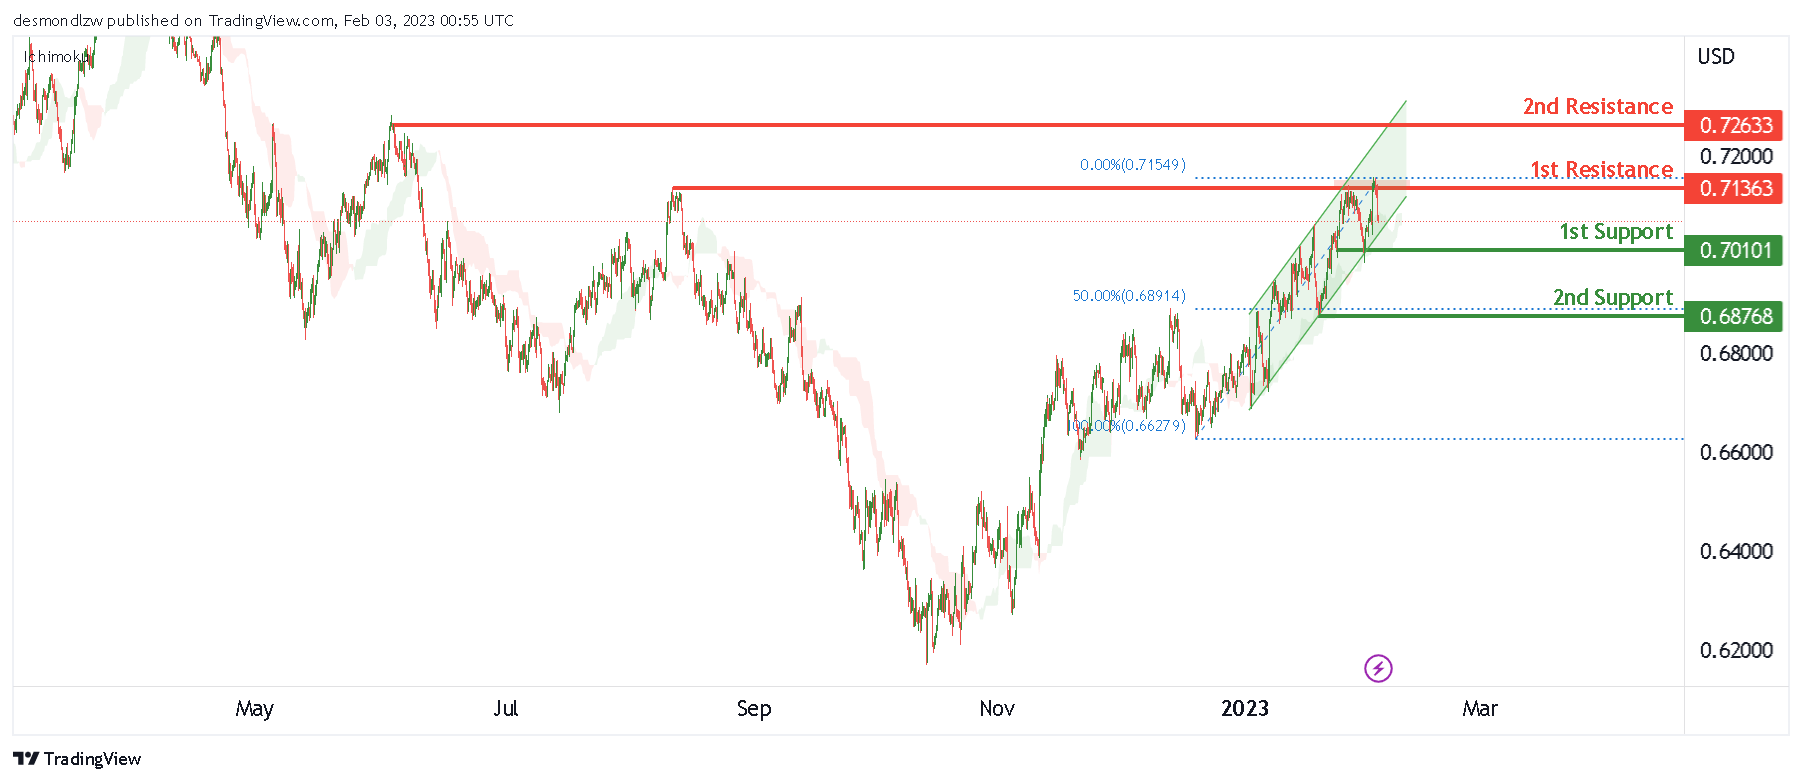
AUD/USD:
Looking at the H4 chart, my overall bias for AUDUSD is slightly bullish due to the current price being fluctuating within the ascending channel, even though the current price is within the Ichimoku cloud.
As the price tended to break through the 1st resistance level at 0.71363, but it did not. If the price breaks this significant level, the price will head towards the 2nd resistance level at 0.72633 which is the previous swing high.
In an alternate scenario, the price could possibly go back up towards the 1st support level at 0.70101which is the recent swing low, before heading down to the 2nd support at 0.68768 which is line with the 50% Fibonacci line.
Areas of consideration
- H4. 2nd resistance at 0.72633
- H4. 1st resistance at 0.71363,
- H4, 1st support at 0.70101
- H4, 2nd support at 0.68768
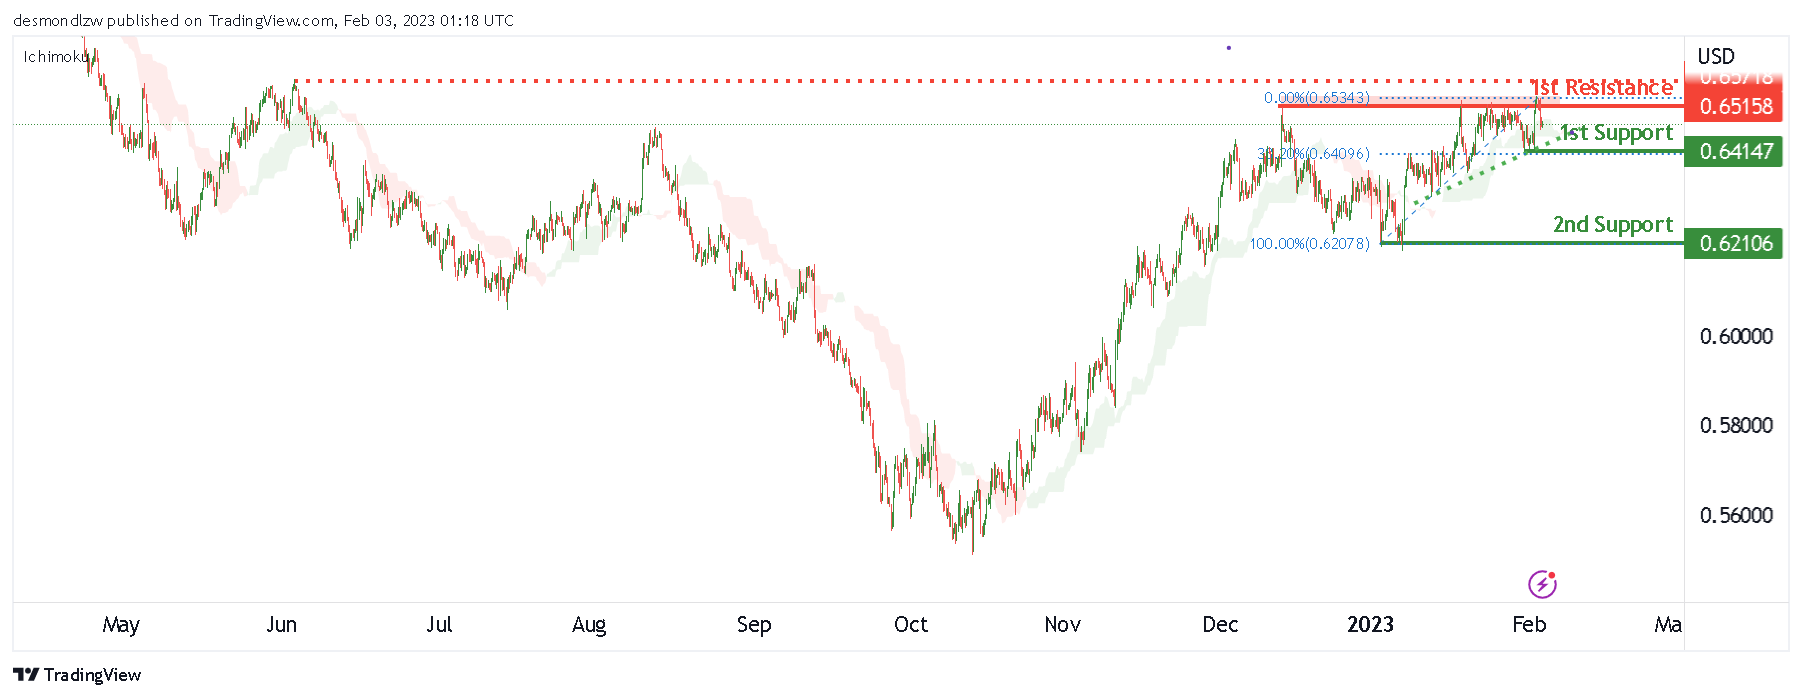
NZD/USD:
Looking at the H4 chart, my overall bias for NZDUSD is slightly bullish, there is an ascending trendline. Expecting the price to fluctuate within the trendline and 1st resistance at 0.65158, before heading toward the 2nd resistance level at 0.65576, the previous swing high.
In an alternate scenario, price could possibly head back toward the 1st support level at 0.64147 which is inline with the 38.2% Fibonacci retracement. Once it breaks 1st support level, the price is down to the 2nd support level at 0.62106
Areas of consideration:
- H4 time frame, 2nd resistance at 0.65576
- H4 time frame, 1st resistance at 0.65158
- H4 time frame, 1st support at 0.64147
- H4 time frame, 2nd support at 0.62106
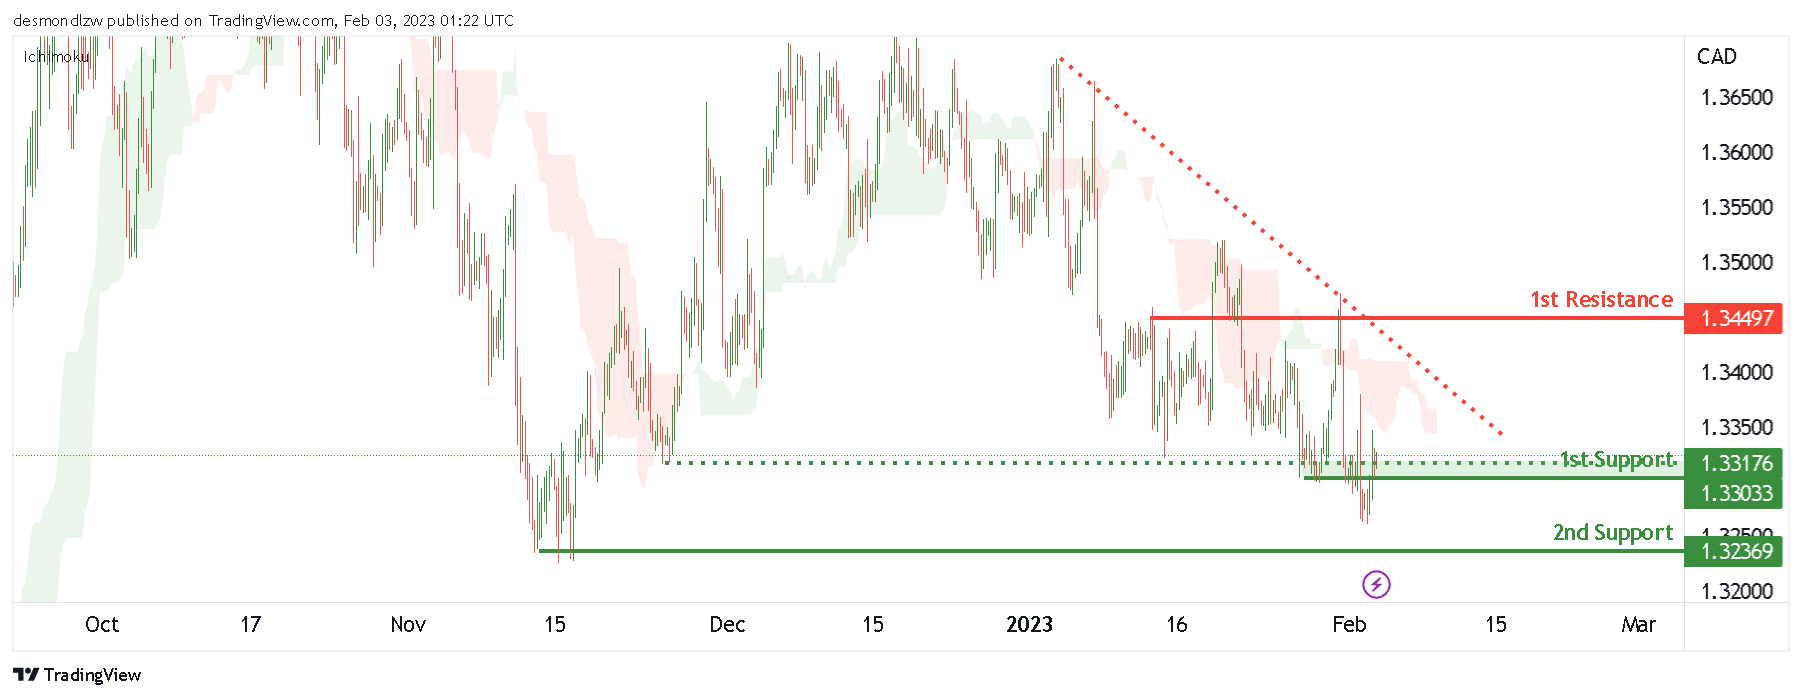
USD/CAD:
Looking at the H4 chart, my overall bias for USDCAD is bearish, as the current price is below the Ichimoku cloud, and the current price is fluctuating around the 1st support line at 1.33033. There is a descending trend line created. Expecting the price is heading down to the 2nd support level at 1.32369 which is the recent swing low.
In an alternative scenario, the price could possibly head up to the 1st resistance at 1.34497 which is the recent swing high.
Areas of consideration:
- H4 time frame, 1st resistance at 1.34497
- H4 time frame, 1st support at 1.33033
- H4 time frame, 2nd support at 1.32369
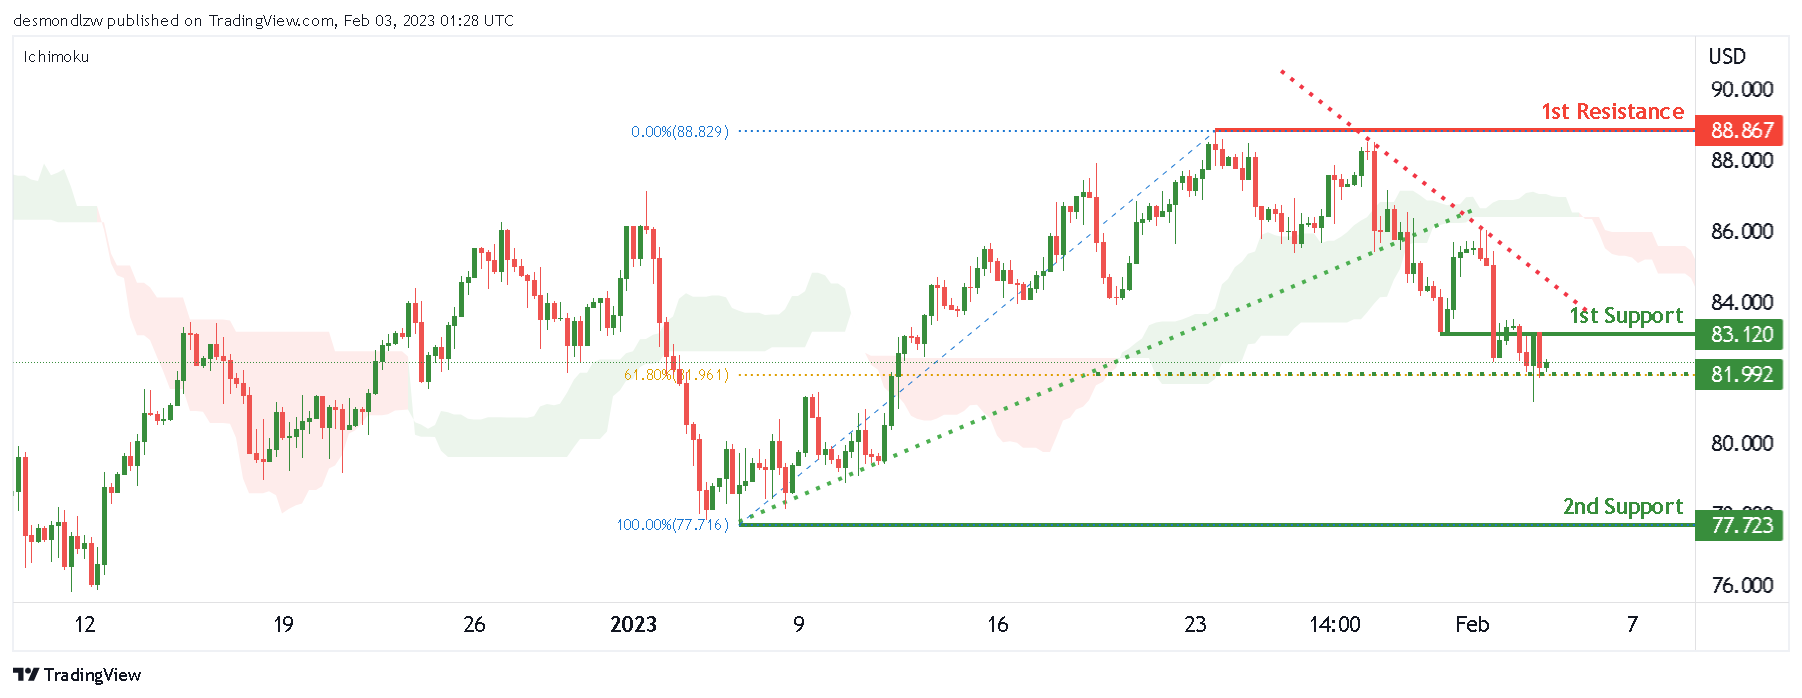
OIL:
Looking at the H4 chart, my overall bias for BOC is slightly bearish.as the current price is below the Ichimoku cloud, and a descending trendline add confluence to my bias. Expecting the price to fluctuate around the 1st support level at 83.120, before it heads down to the intermediate support at 81.992 which is inline with the 61.8% Fibonacci retracement, and 2nd support at 77.723.
In an alternate scenario, the price could possibly head up towards the 1st resistance level at 88.829 which is the recent swing high.
Areas of consideration:
- H4 time frame, 1st resistance at 88.829
- H4 time frame,1st support at 83.120
- H4 time frame, intermediate support at 81.992
- H4 time frame, 2nd support at 77.723.
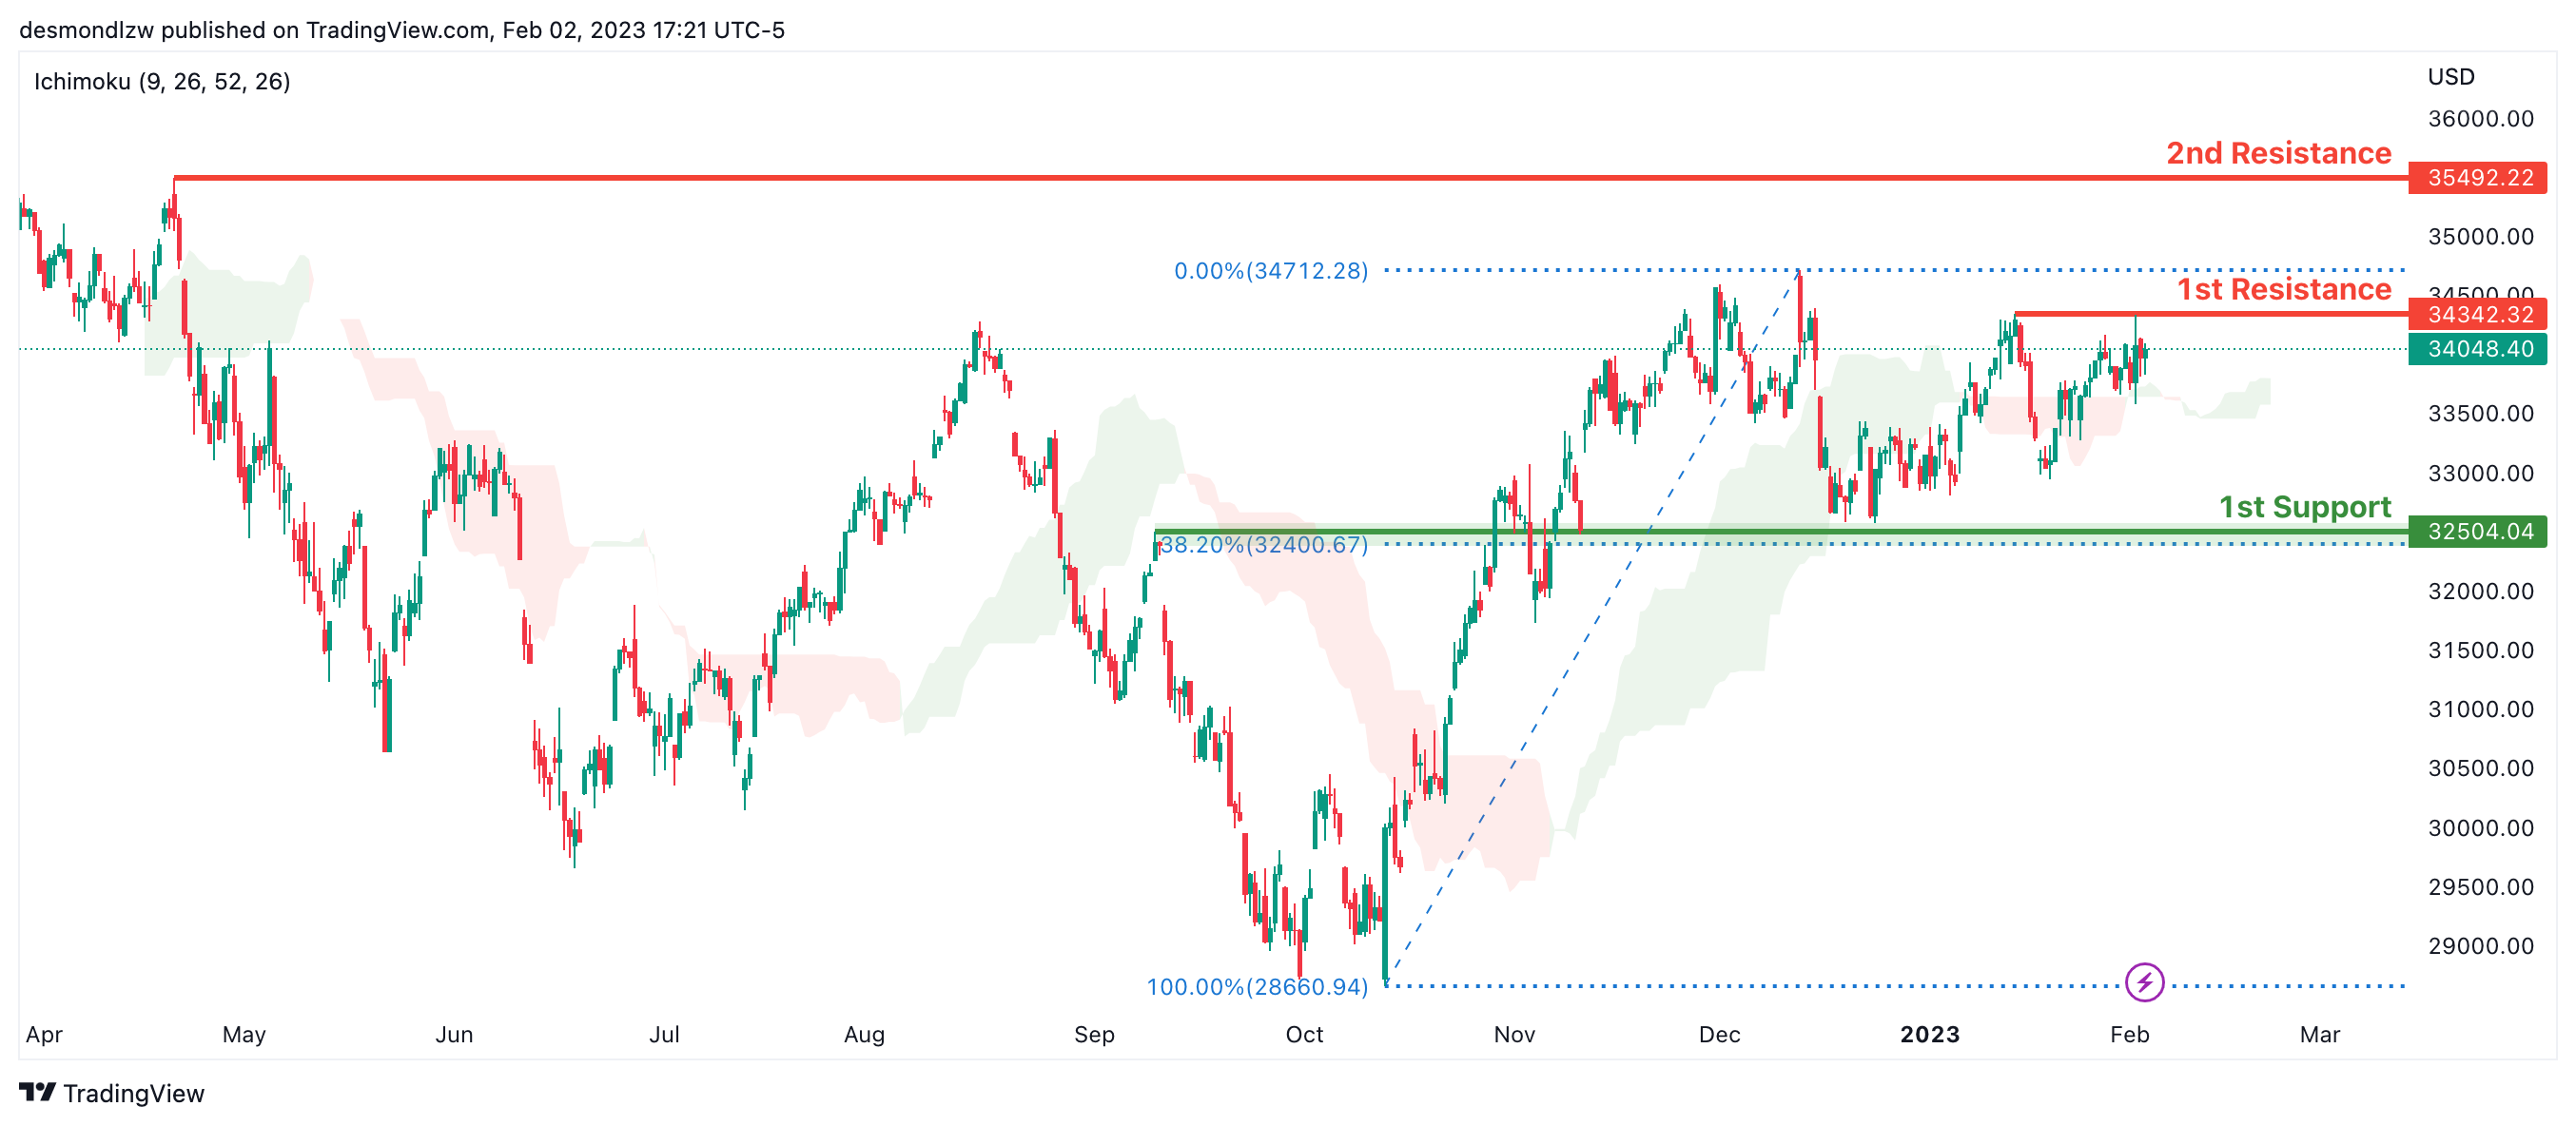
Dow Jones Industrial Average:
On the H4 chart, the overall bias for DJI is bullish. To add confluence to this, the price is crossing above the Ichimoku cloud which indicates a bullish market. If this bullish momentum continues, expect the price to possibly continue heading towards the 1st resistance line at 34342.32, where the recent swing high is. In an alternative scenario, price could possibly head back down towards the 1st support at 32581.97, slightly above where the 38.2% Fibonacci line is.
Areas of consideration:
- H4 time frame, 1st support at 32581.97
- H4 time frame, 1st Resistance at 34342.32
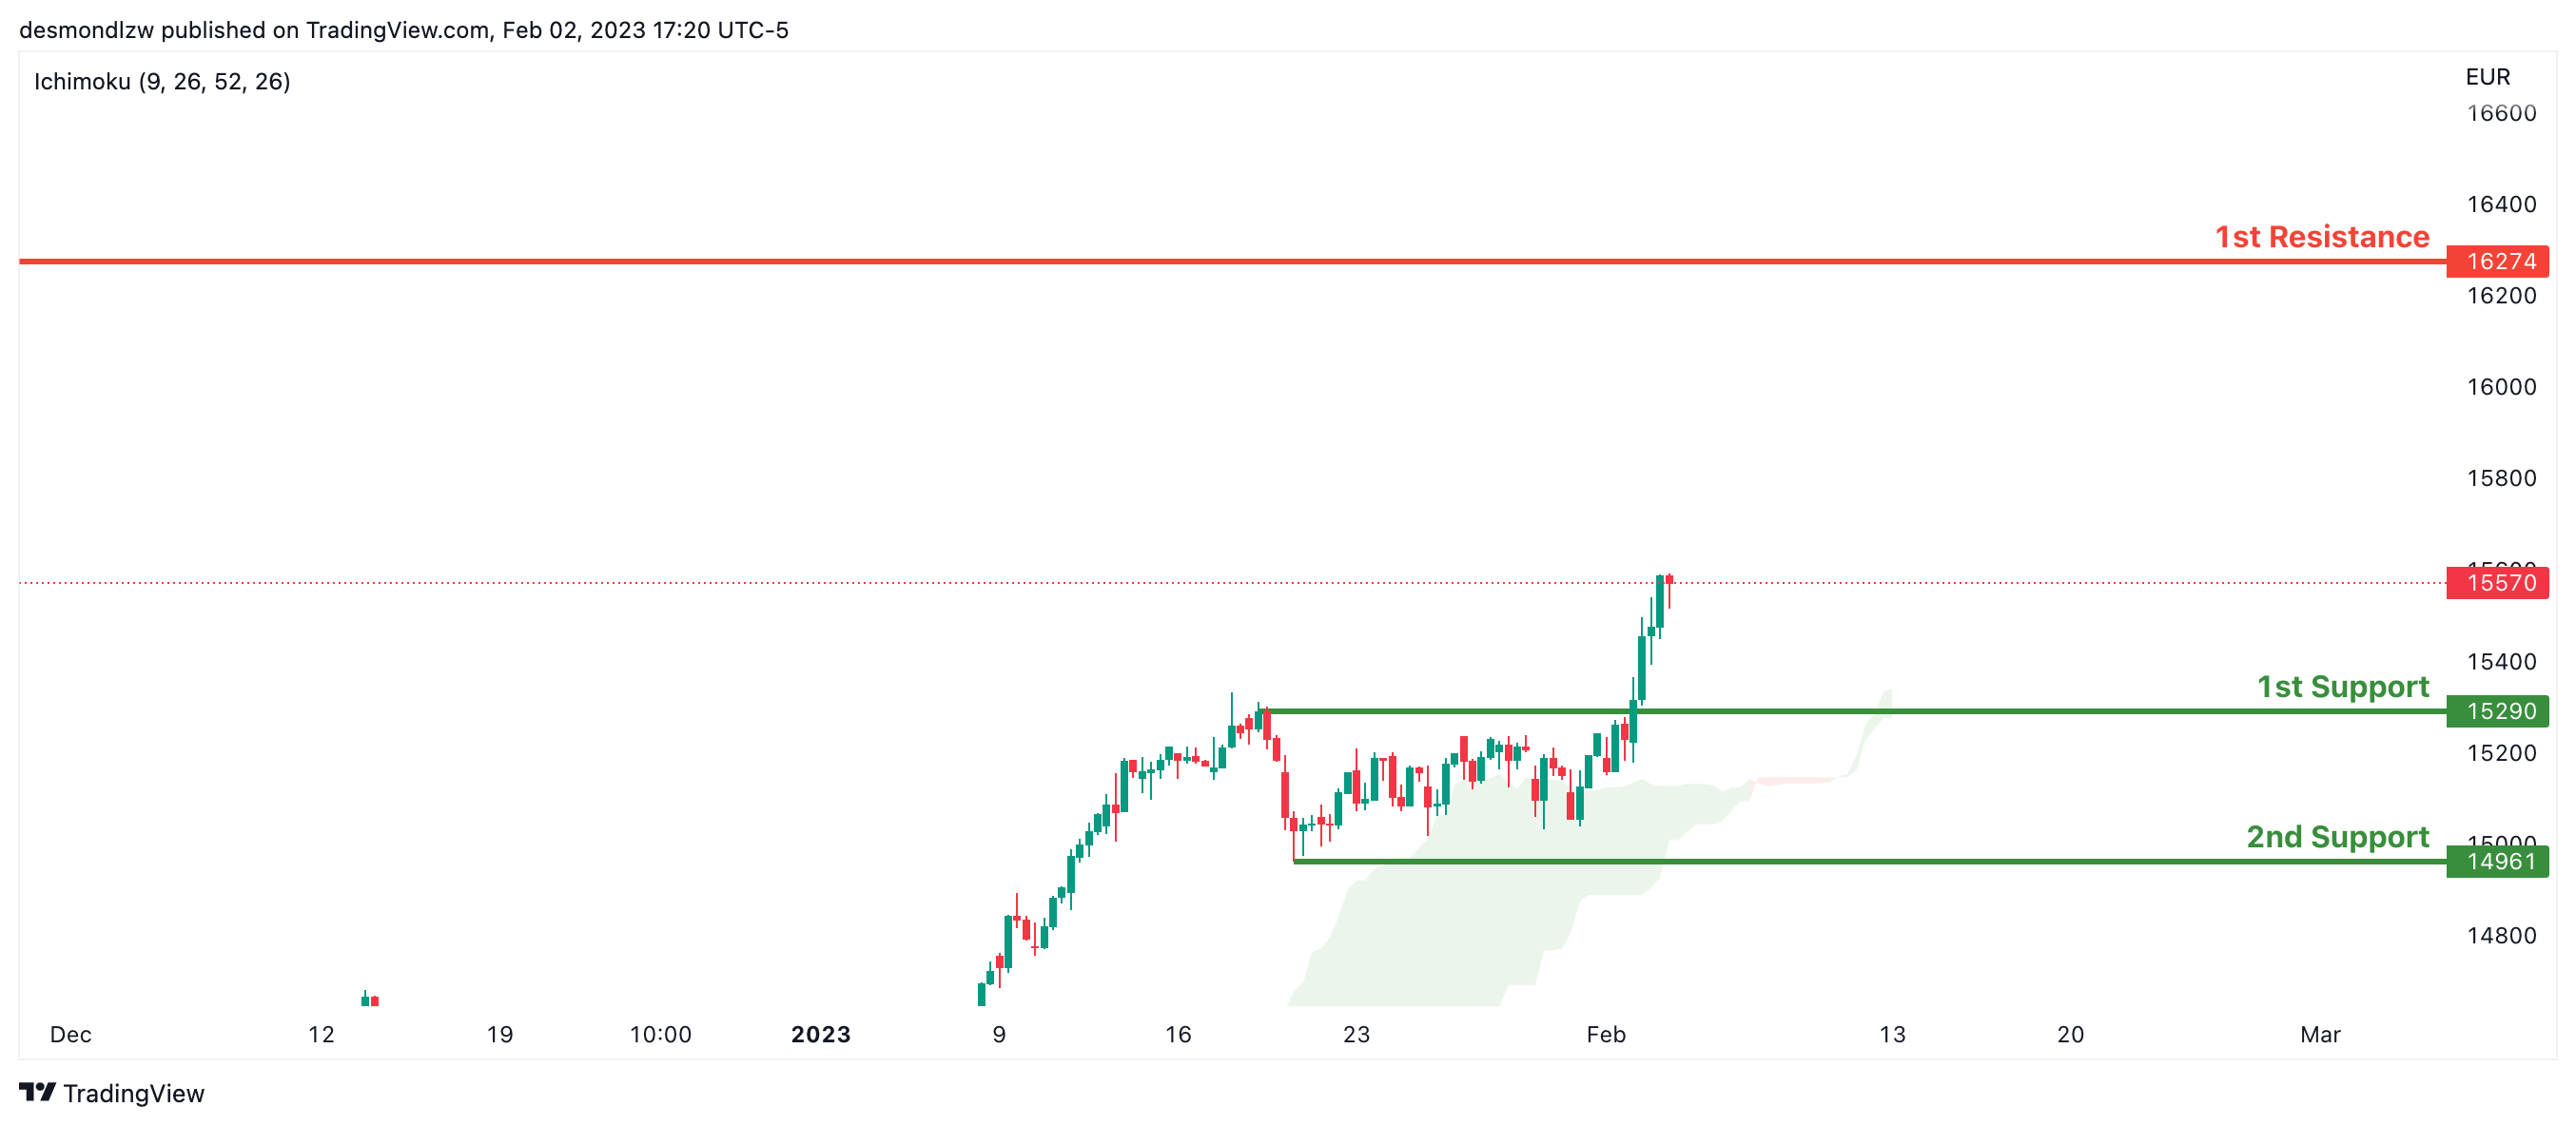
DAX:
Looking at the H4 chart, my overall bias for DAX is bullish due to the current price crossing above the Ichimoku cloud, indicating a bullish market. If this bullish momentum continues, expect the price to possibly head towards the 1st resistance line at 16274, where the previous swing high is. In an alternative scenario, price could possibly head down to retest the 1st support at 15290, where the overlap support is.
Areas of consideration:
- H4 time frame, 1st resistance is at 16274
- H4 time frame, 1st support is at 15290
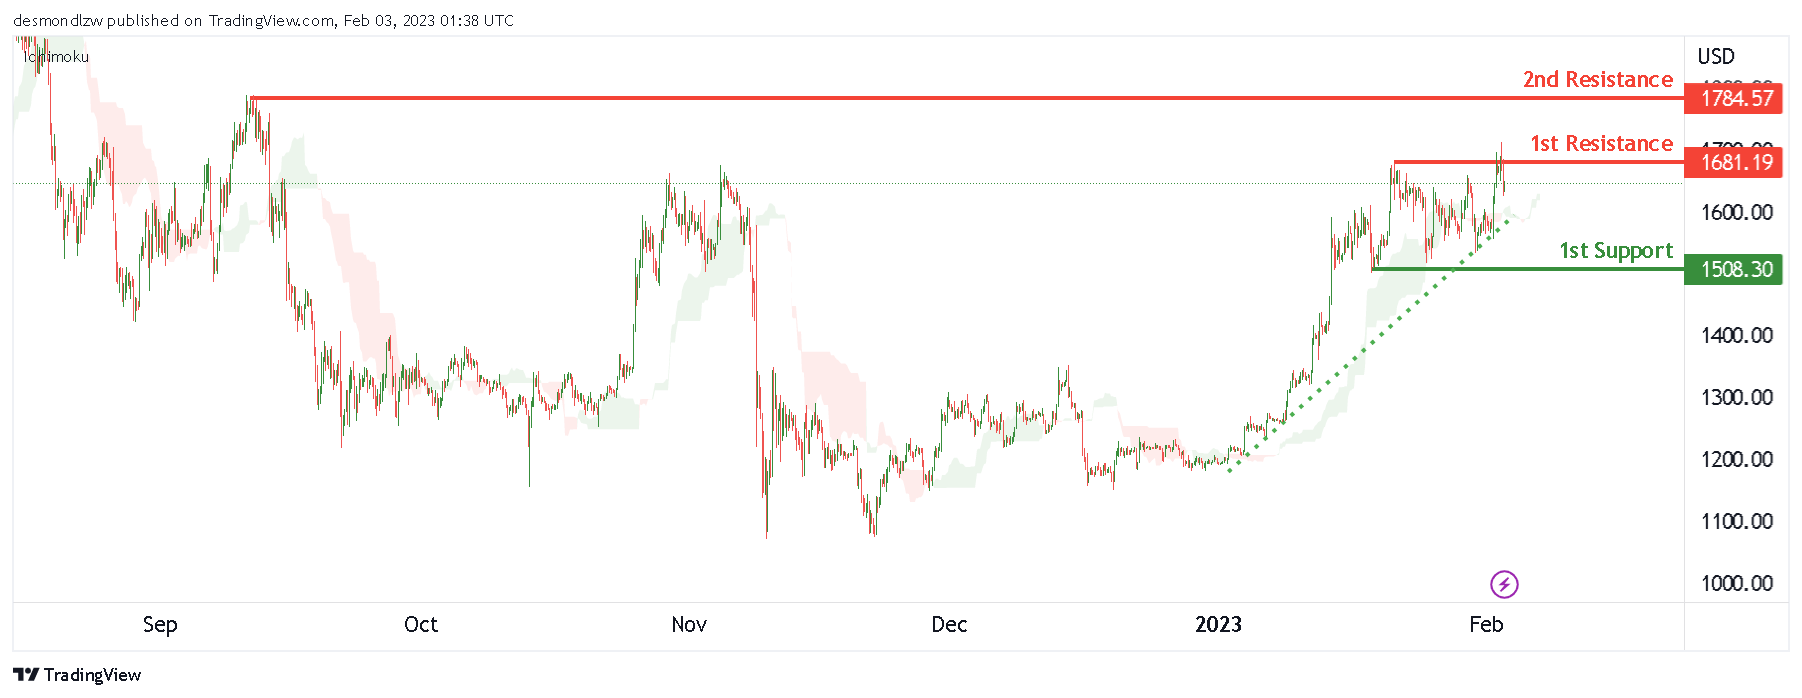
ETHUSD:
Looking at the H4 chart, my overall bias for ETHUSD is slightly bullish, the strong ascending trend line has been created. Expecting the price to break the 1st resistance line at 1681.19 which is the recent swing high, before it heads towards the 2nd resistance 1782.49.
In an alternate scenario, the price may go down to the 1st support at 1508.30 which is the recent swing low.
Areas of consideration:
- H4 time frame, 2nd resistance of 1782.49
- H4 time frame, 1st resistance of 1681.19
- H4 time frame, 1st support at 1508.30
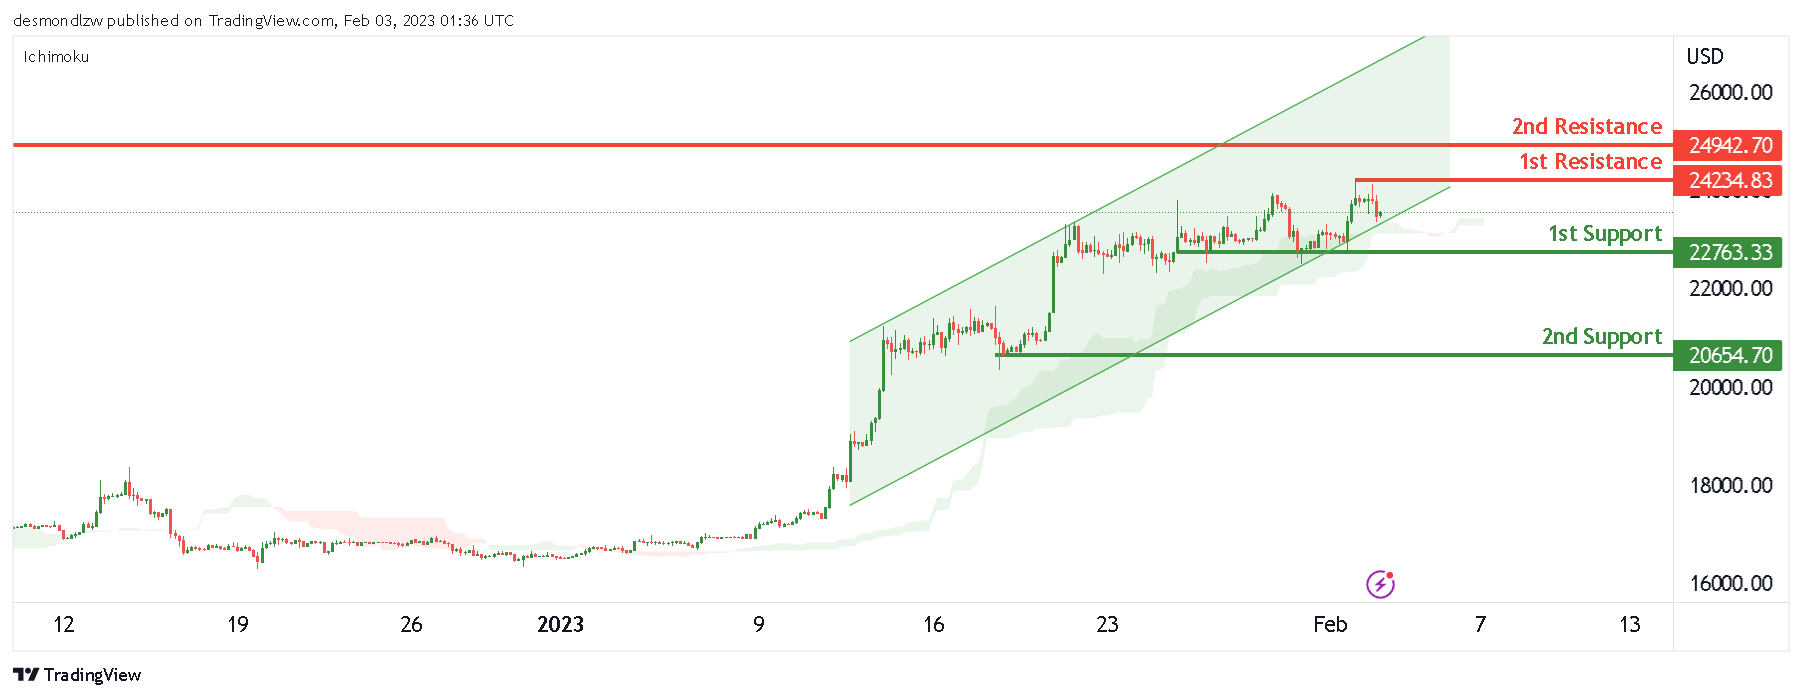
BTCUSD:
Looking at the H4 chart, my overall bias for BTCUSD is bullish. An ascending channel was created, expecting the price to break the 1st resistance line at 24234.83 which is the recent overlap resistance, before heading towards the 2nd resistance at 24942.70 which is the previous swing high.
In an alternative scenario, the price could possibly head down to the 1st support at 22763.33 which is the overlap support.
Areas of consideration:
- H4 time frame, 2nd resistance 24942.70
- H4 time frame, 1st resistance 24234.83
- H4 time frame, 1st support at 22763.33
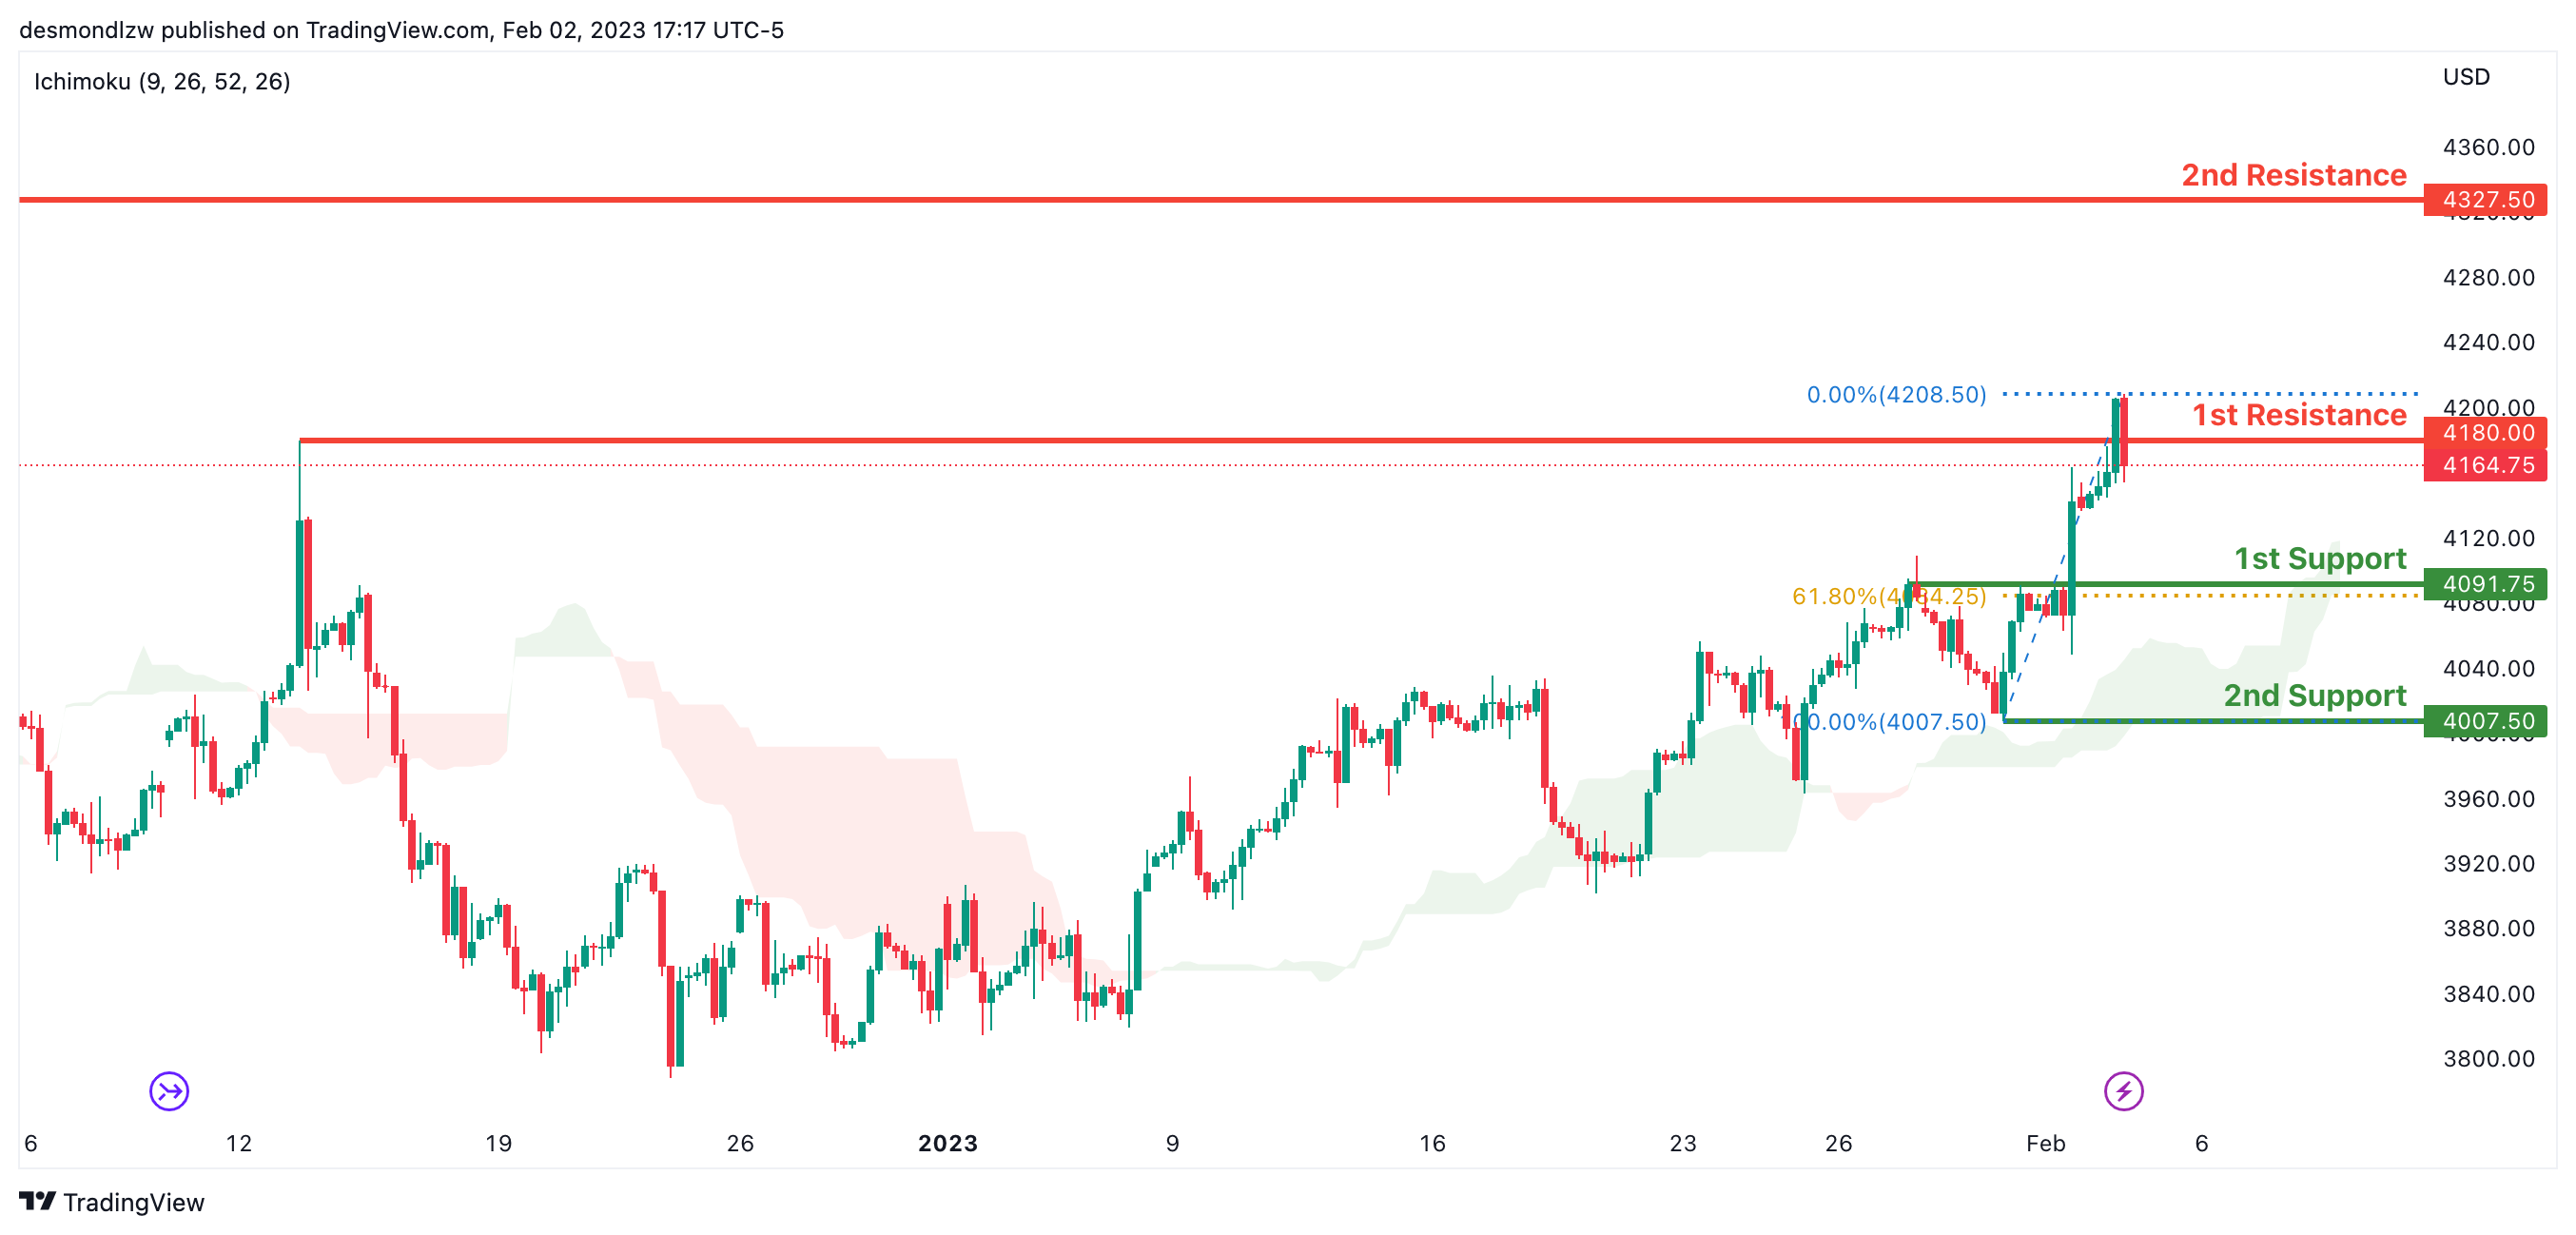
S&P 500:
Looking at the H4 chart, my overall bias for S&P500 is bullish due to the current price being above the Ichimoku cloud, indicating a bullish market. If this bullish momentum continues, expect the price to possibly break the 1st resistance at 4180.00, where the previous swing high is., before heading towards the 2nd resistance at 4327.50 where the previous swing high is, In an alternative scenario, price could possibly head back down to retest the 1st support at 4091.75, where the 50% Fibonacci line is.
Areas of consideration:
- H4 time frame, 1st support at 4091.75
- H4 time frame, 1st resistance at 44180.00
- H4 time frame, 2nd resistance at 4327.50


