
USD/JPY:
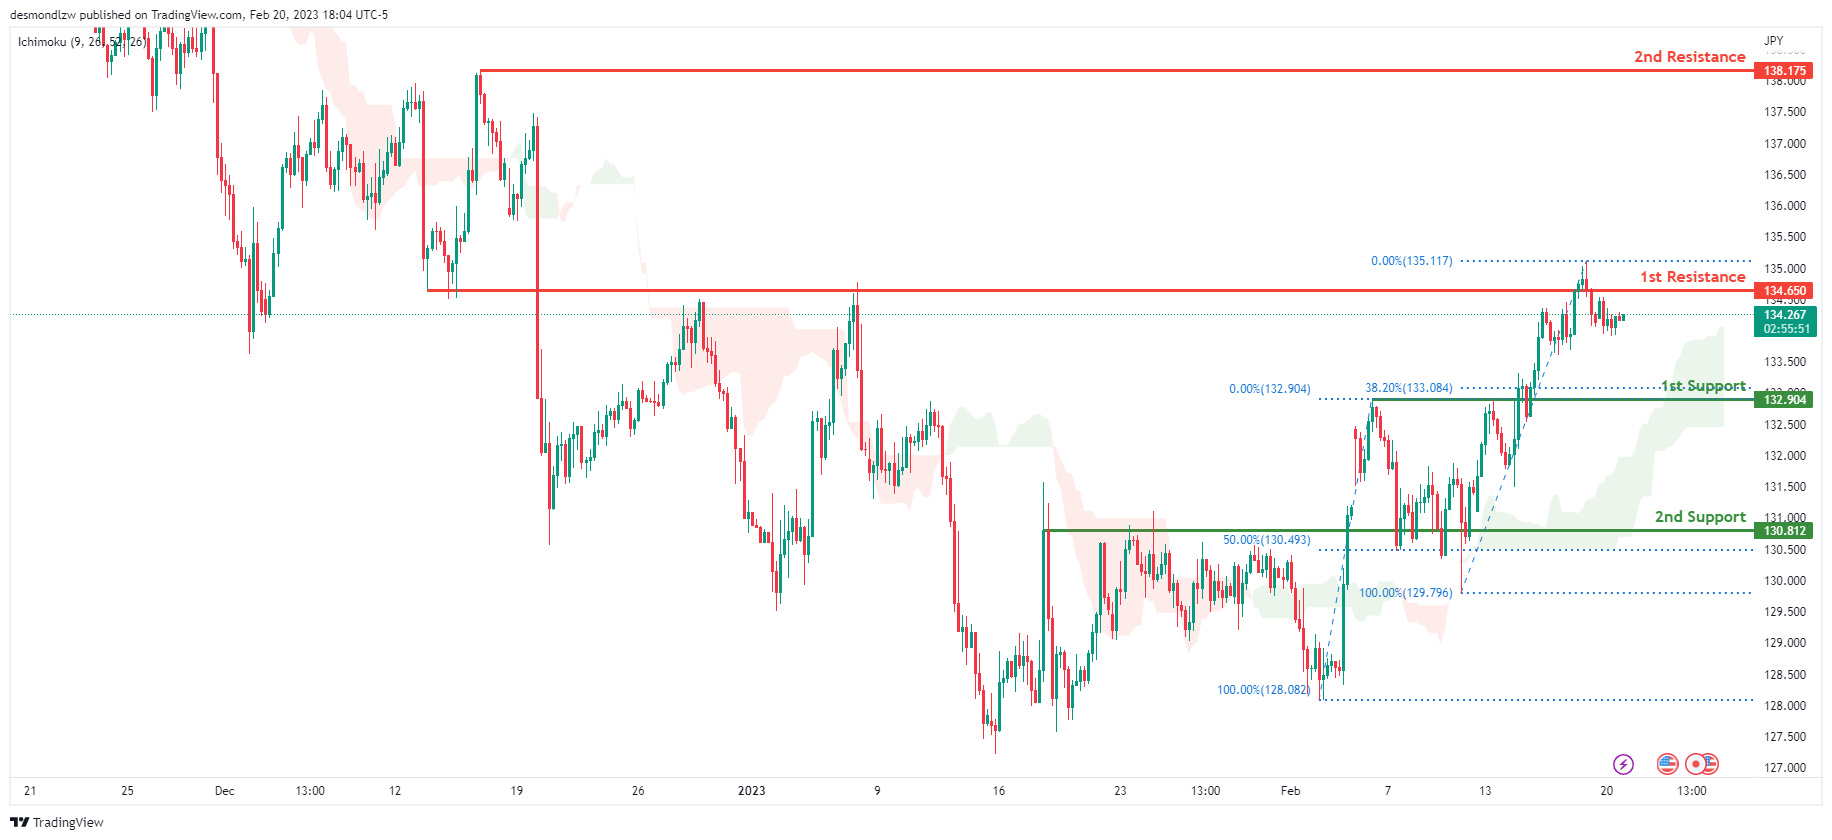
Looking at the H4 chart, my overall bias for USDJPY is bullish due to the current price being above the Ichimoku cloud, indicating a bullish market. If this bullish momentum continues, expect the price to possibly break the 1st resistance at 134.650, where the overlap resistance is before heading towards the 2nd resistance at 138.175, where the previous swing high is.
In an alternate scenario, price could possibly head back down to retest the 1st support at 132.904, where the overlap support and 38.2% Fibonacci line is.
Areas of consideration:
- H4 time frame, 1st resistance at 134.650
- H4 time frame, 2nd resistance at 138.175
- H4 time frame, 1st support at 132.904
DXY:
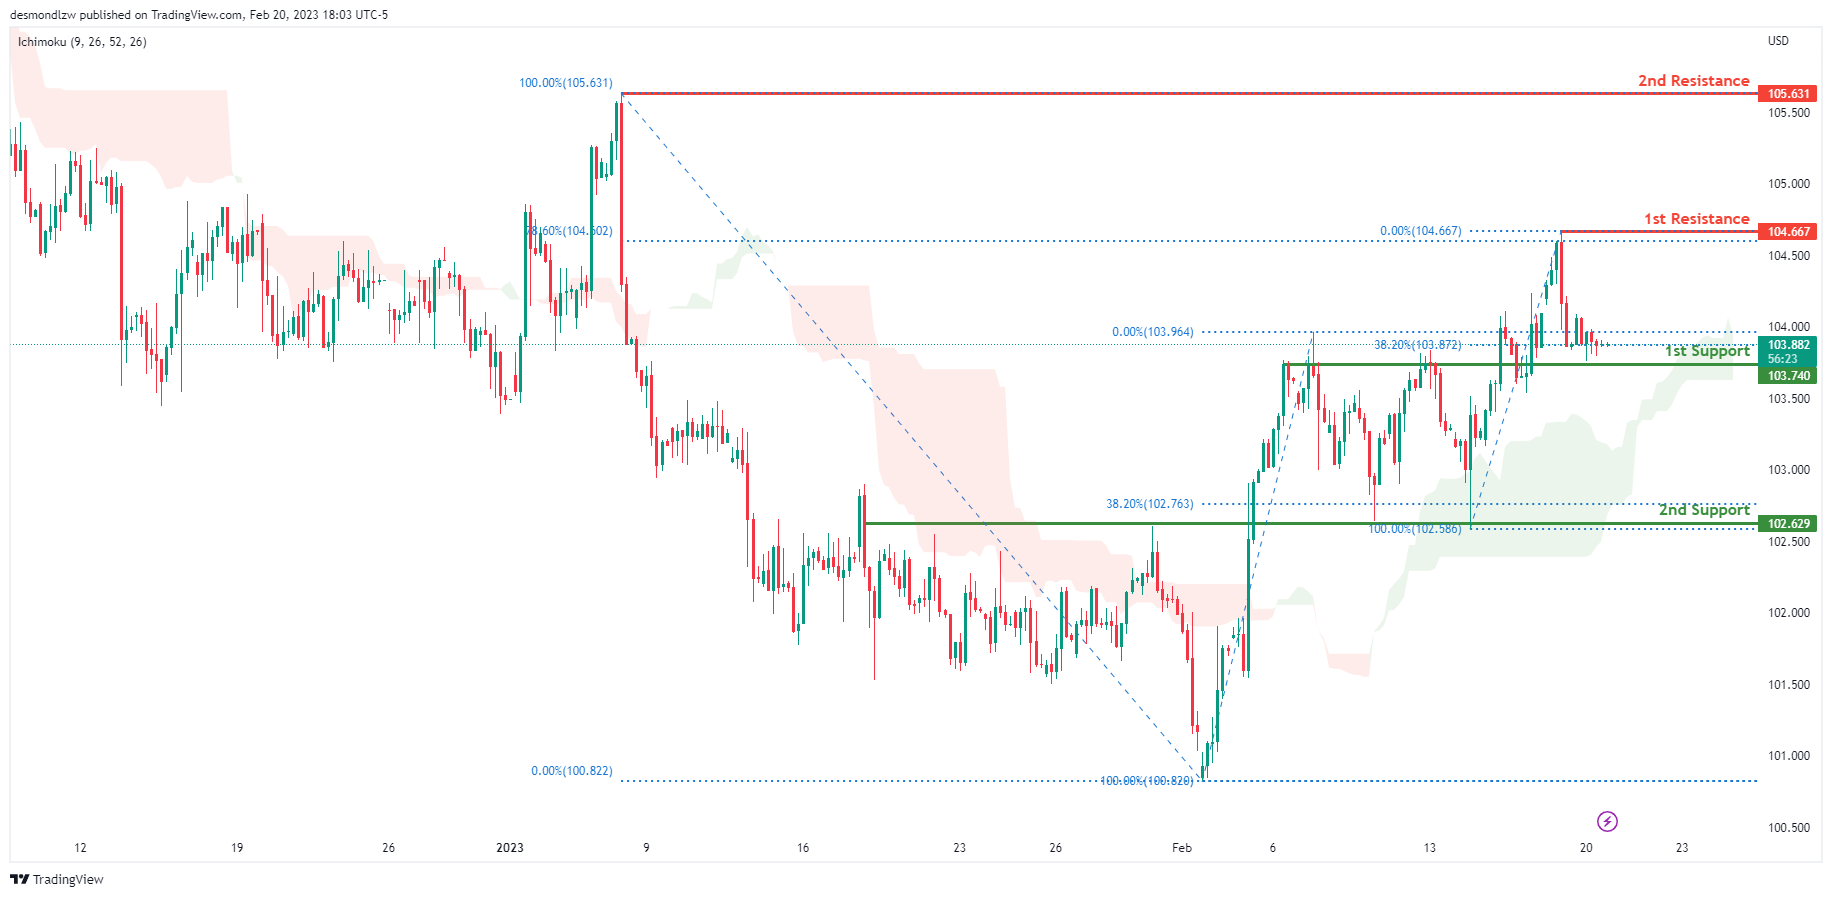
Looking at the H4 chart, my overall bias for DXY is bullish due to the current price crossing above the Ichimoku cloud, indicating a bullish market. If this bullish momentum continues, expect the price to possibly continue heading towards the 1st resistance at 104.667, where the recent high and 78.6% Fibonacci line is.
In an alternative scenario, price could head back down to retest the 1st support at 103.740, where the overlap support and 38.2% Fibonacci line is.
Areas of consideration:
- H4 time frame, 1st resistance at 104.667
- H4 time frame, 1st support at 103.740
EUR/USD:
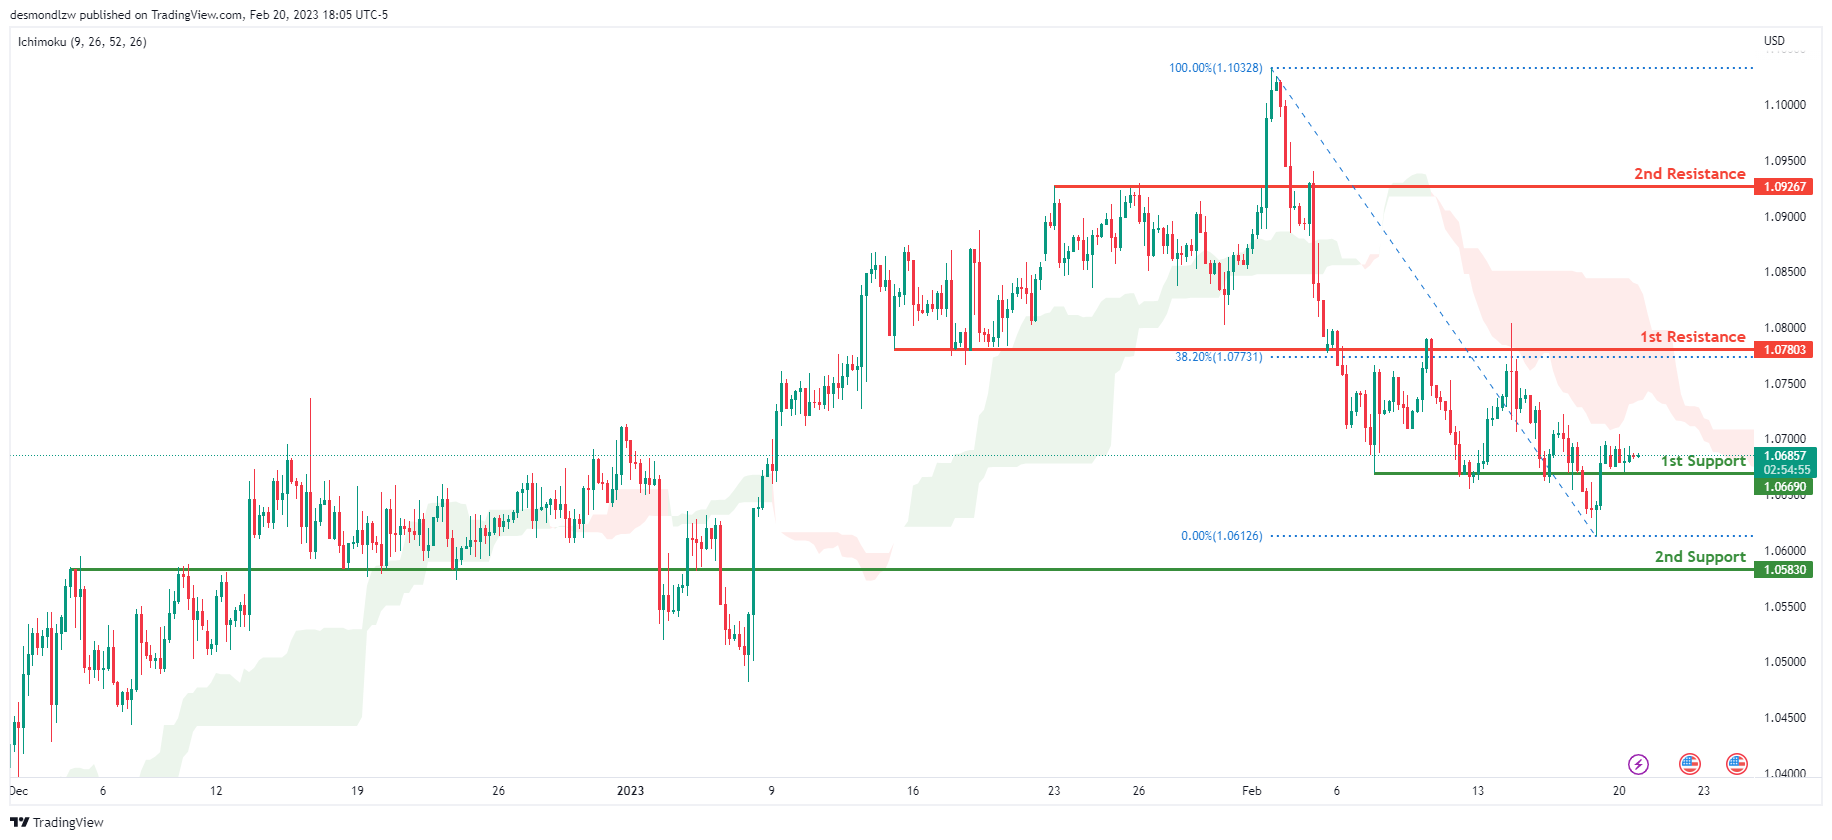
Looking at the H4 chart, my overall bias for EURUSD is bearish due to the current price crossing below the Ichimoku cloud, indicating a bearish market structure. If this bearish momentum continues, expect the price to possibly break the 1st support at 1.06690, where the overlap support is, before heading towards the 2nd support at 1.05830 which is the overlap support.
In an alternate scenario, price could possibly head back up to retest the 1st resistance at 1.07803, where the overlap resistance and 38.2% Fibonacci line is.
Areas of consideration :
- H4 1st resistance at 1.07803
- H4 1st support at 1.06690
- H4 2nd support at 1.05830
GBP/USD:
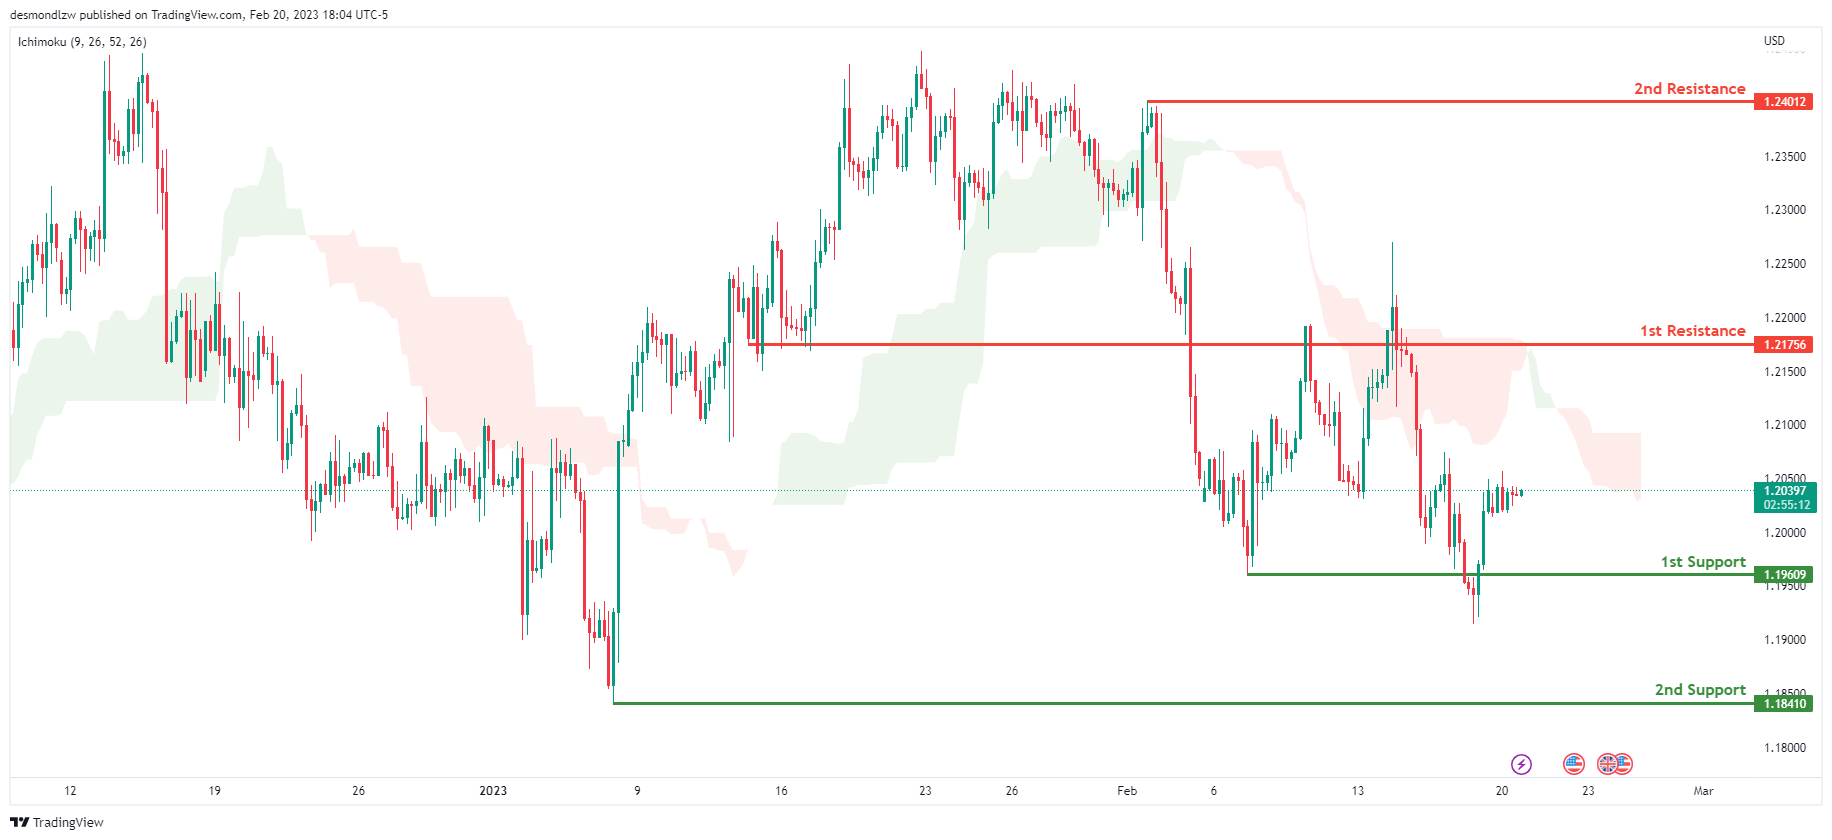
Looking at the H4 chart, my overall bias for GBPUSD is bearish due to the current price crossing below the Ichimoku cloud, indicating a bearish market. If this bearish momentum continues, expect the price to possibly break the 1st support at 1.19609, where the recent swing low is, before heading towards the 2nd support at 1.18410, where the previous swing low is.
In an alternate scenario, price could head back up to retest the 1st resistance line at 1.21756 where the overlap resistance is.
Areas of consideration:
- H4 1st resistance at 1.21756
- H4 1st support at 1.19609
- H4 2nd support at 1.18410
USD/CHF:
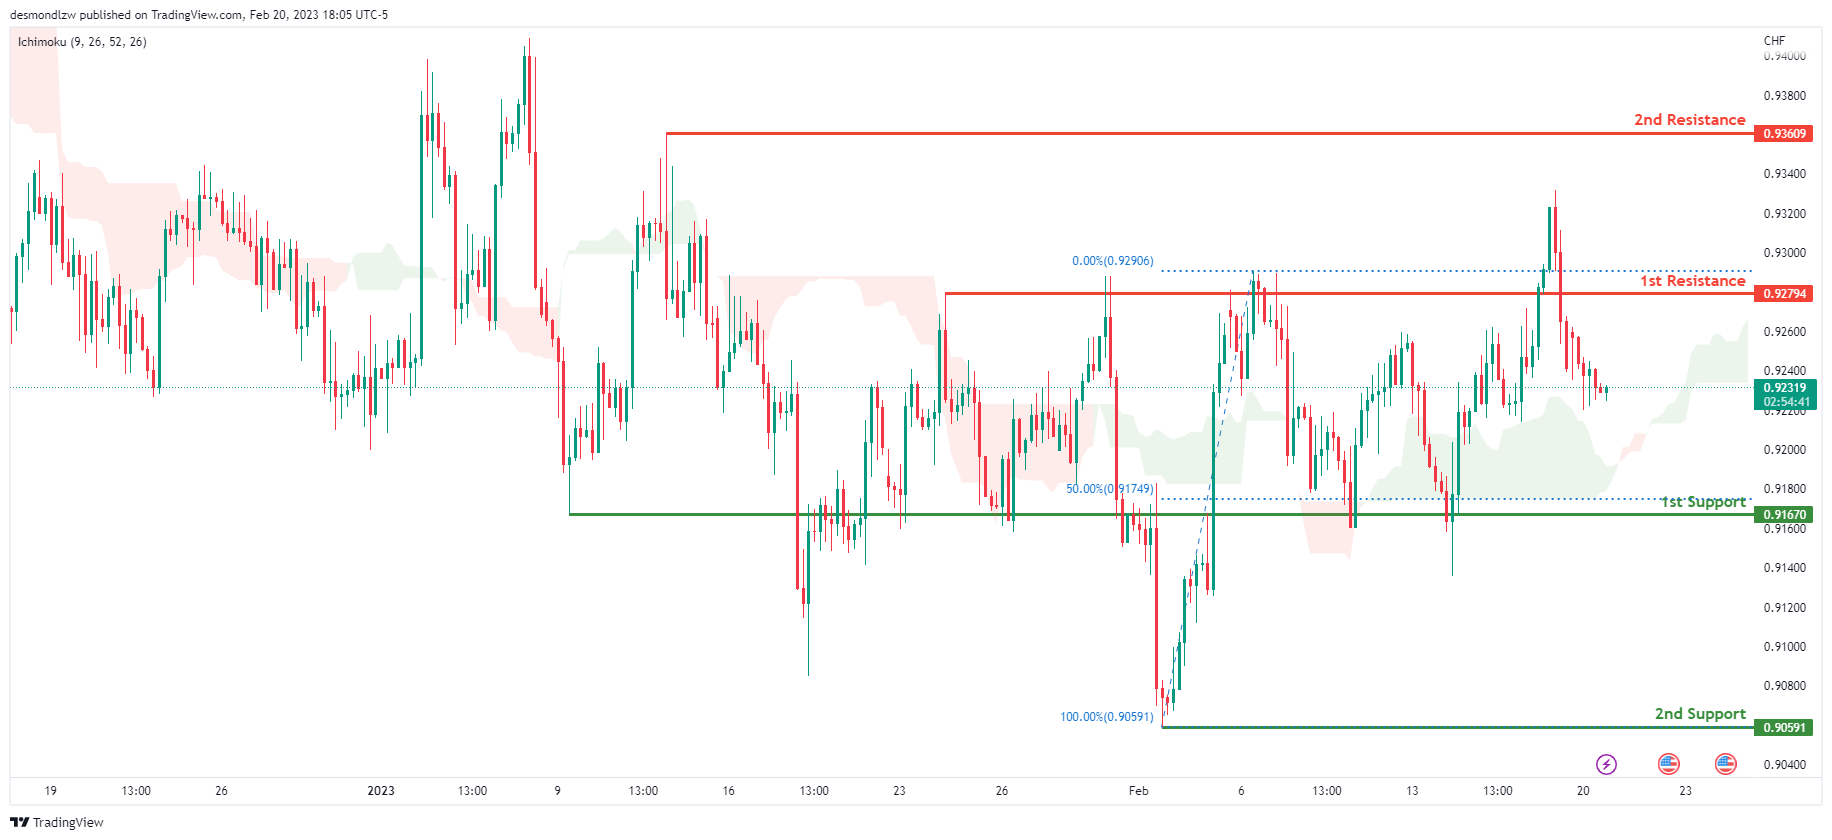
Looking at the H4 chart, my overall bias for USDCHF is bullish due to the current price being above the Ichimoku cloud, indicating a bullish market. If the current bullish trend continues, expect the price to possibly break the 1st resistance at 0.92794, where the previous swing high is, before heading towards the 2nd resistance at 0.93609 where the intermediate high is.
In an alternative scenario, price could possibly head back down to retest the 1st support at 0.91670, where the recent swing low and 50% Fibonacci line is.
Areas of consideration
- H4 1st support at 0.91670
- H4 1st resistance at 0.92794
- H4 2nd resistance at 0.93609
XAU/USD (GOLD):
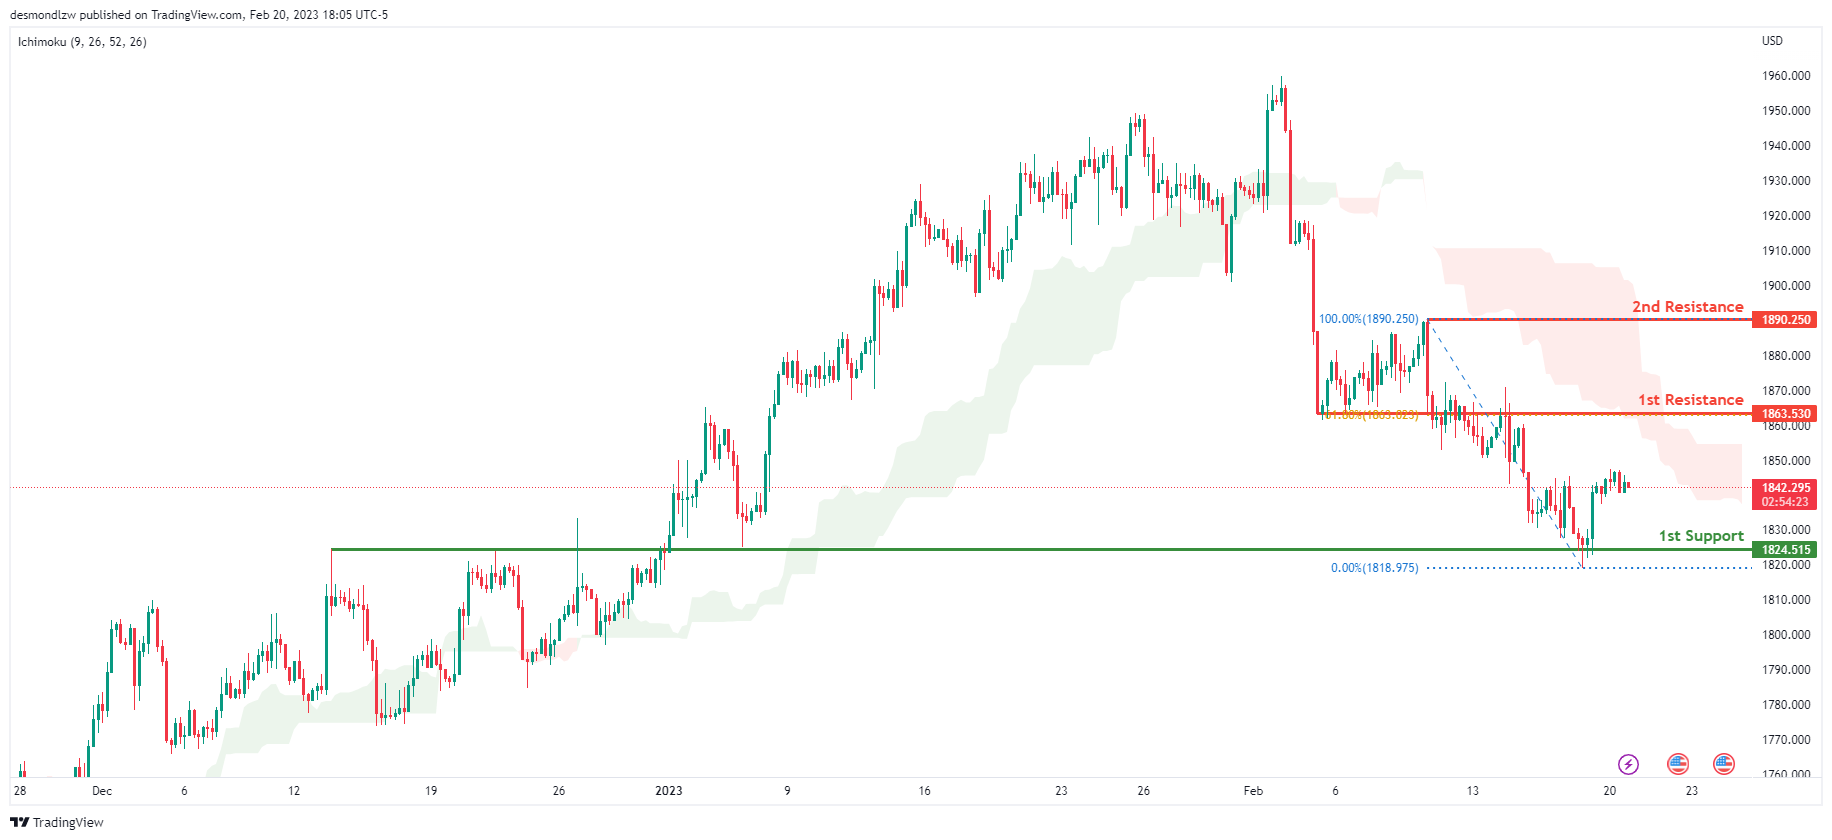
Looking at the H4 chart, my overall bias for XAUUSD is bearish due to the current price being below the Ichimoku cloud, indicating a bearish market. If this bearish momentum continues, expect the price to possibly continue heading towards the 1st support at 1824.515 where the overlap support is.
In an alternative scenario, price could possibly head back up to retest the 1st resistance at 1863.530, where the overlap resistance and 61.8% Fibonacci line is.
Areas of consideration:
- H4 time frame, 1st resistance at 1863.530
- H4 time frame, 1st support at 1824.515
AUD/USD:
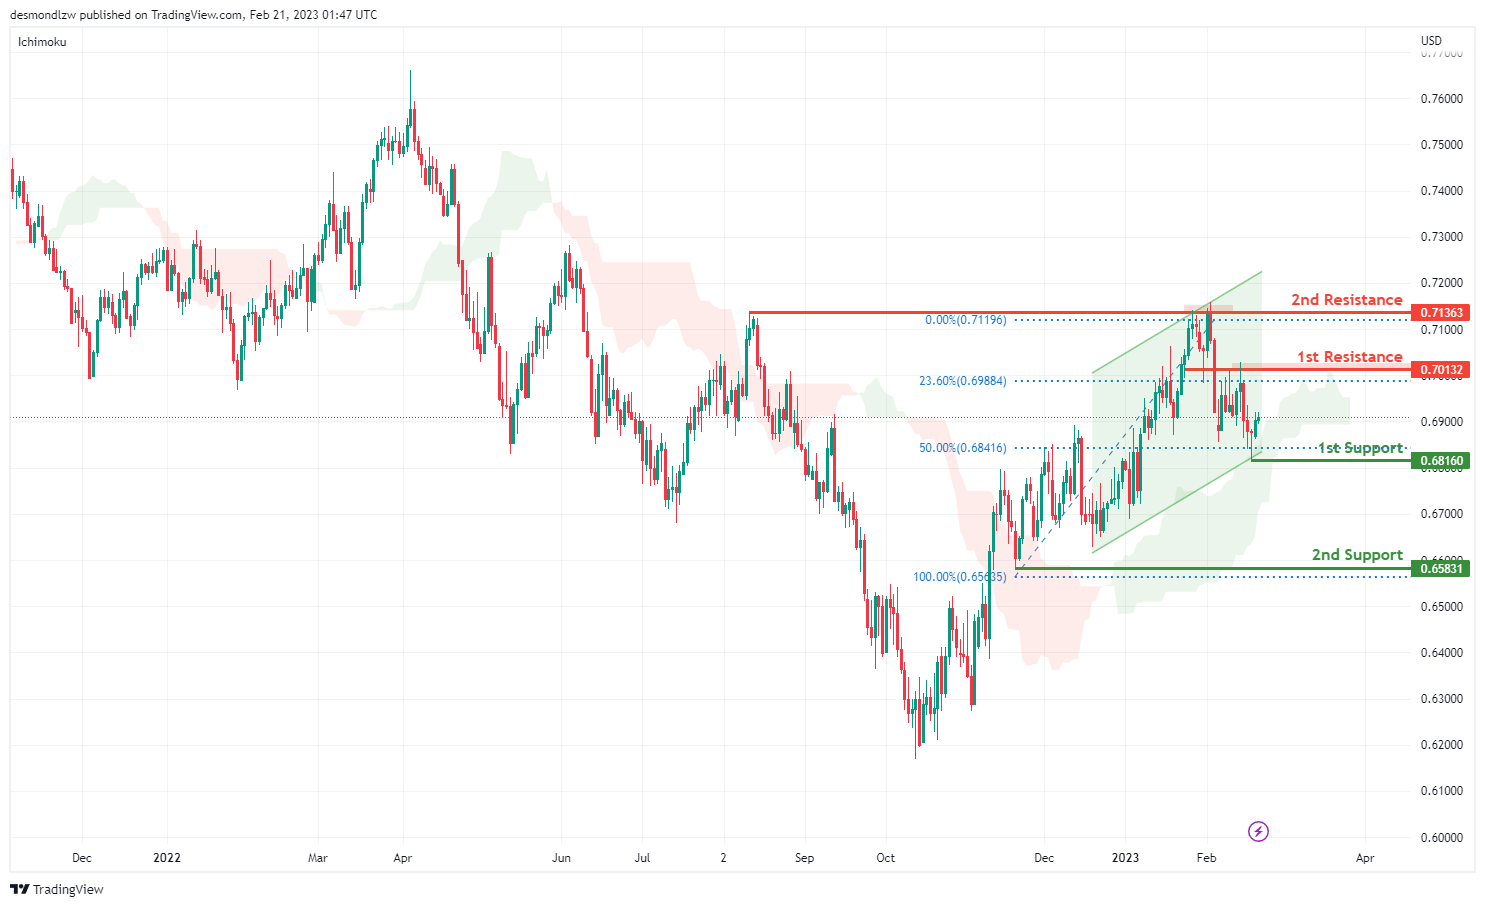
Looking at the H4 chart, my overall bias for AUDUSD is bullish due to the current price being above the Ichimoku cloud, and there is an ascending channel, indicating a bullish market.
The price could possibly go up towards the 1st resistance level at 0.70132 which is the recent swing high and in line with the 23.6% Fibonacci retracement. There is 2nd resistance at 0.71363 which is the previous swing high.
In an alternate scenario, the price could possibly down towards the The 1st support is at 0.68160 which is the recent swing high and in line with the 50% Fibonacci retracement. The 2nd support is at 0.65831 which is the recent swing low.
Areas of consideration
- H4. 2nd resistance at 0.71363
- H4. 1st resistance at 0.70132
- H4, 1st support at 0.68160
- H4, 2nd support at 0.65831
NZD/USD:
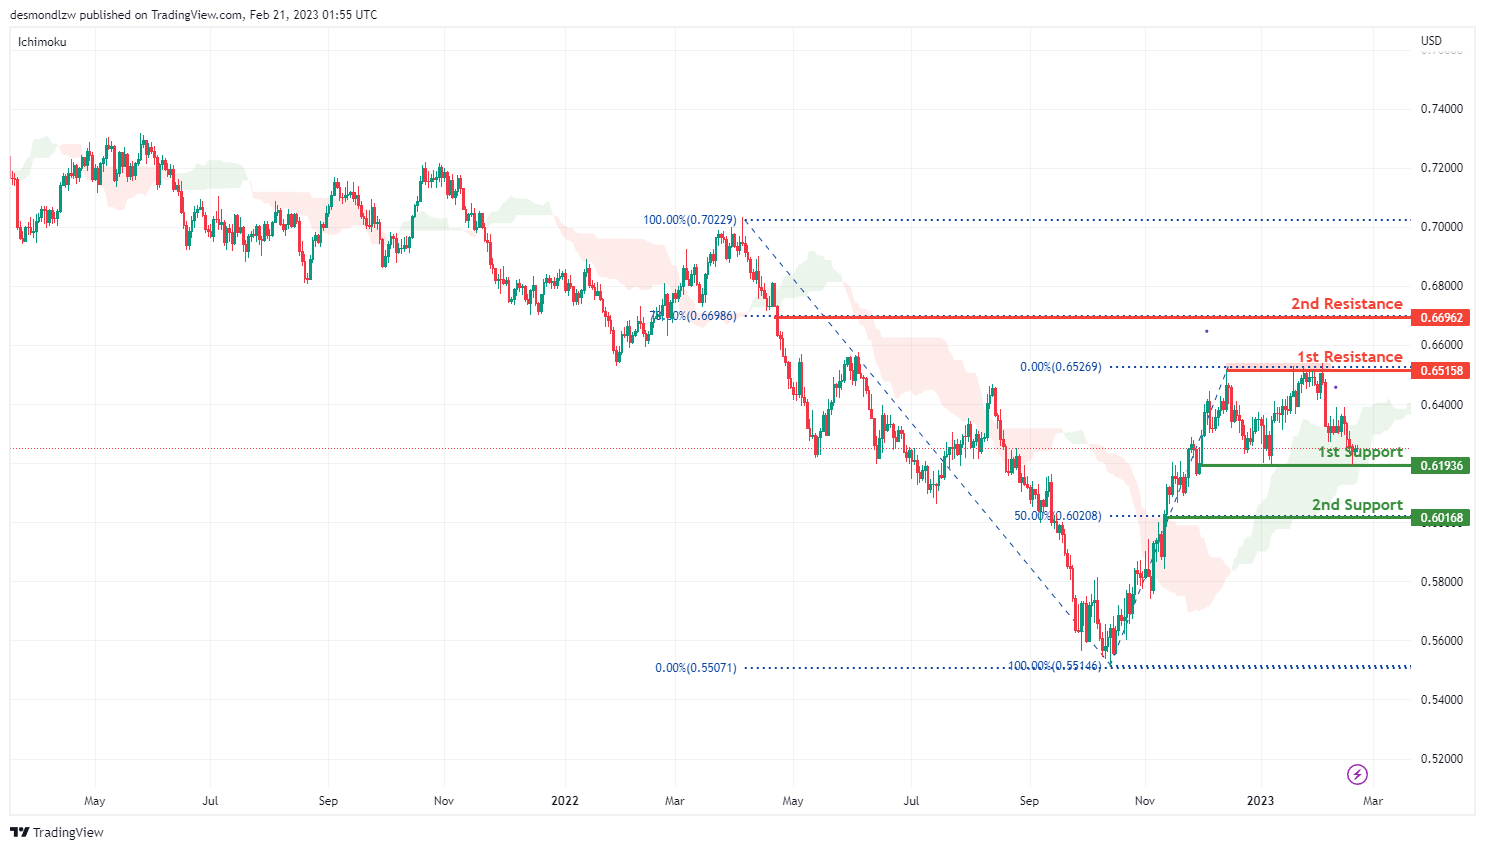
Looking at the H4 chart, my overall bias for NZDUSD is bullish, as the current price is acrossing the Ichimoku Cloud. Expecting the price to go up towards the 1st resistance level at 0.65158 which is the recent overlap swing high and in line with 61,8% Fibonacci retracement. There is a 2nd resistance at 0.66962 where the 78.6% Fibonacci line is.
In an alternate scenario, price could possibly go down towards the 1st support at 0.61936 which is the overlap swing low. The 2nd support is at 0.60168 where the 50% Fibonacci line is.
Areas of consideration:
- H4 time frame, 2nd resistance at 0.66962
- H4 time frame, 1st resistance at 0.65158
- H4 time frame, 1st support at 0.61936
- H4 time frame, 2nd support at 0.60168
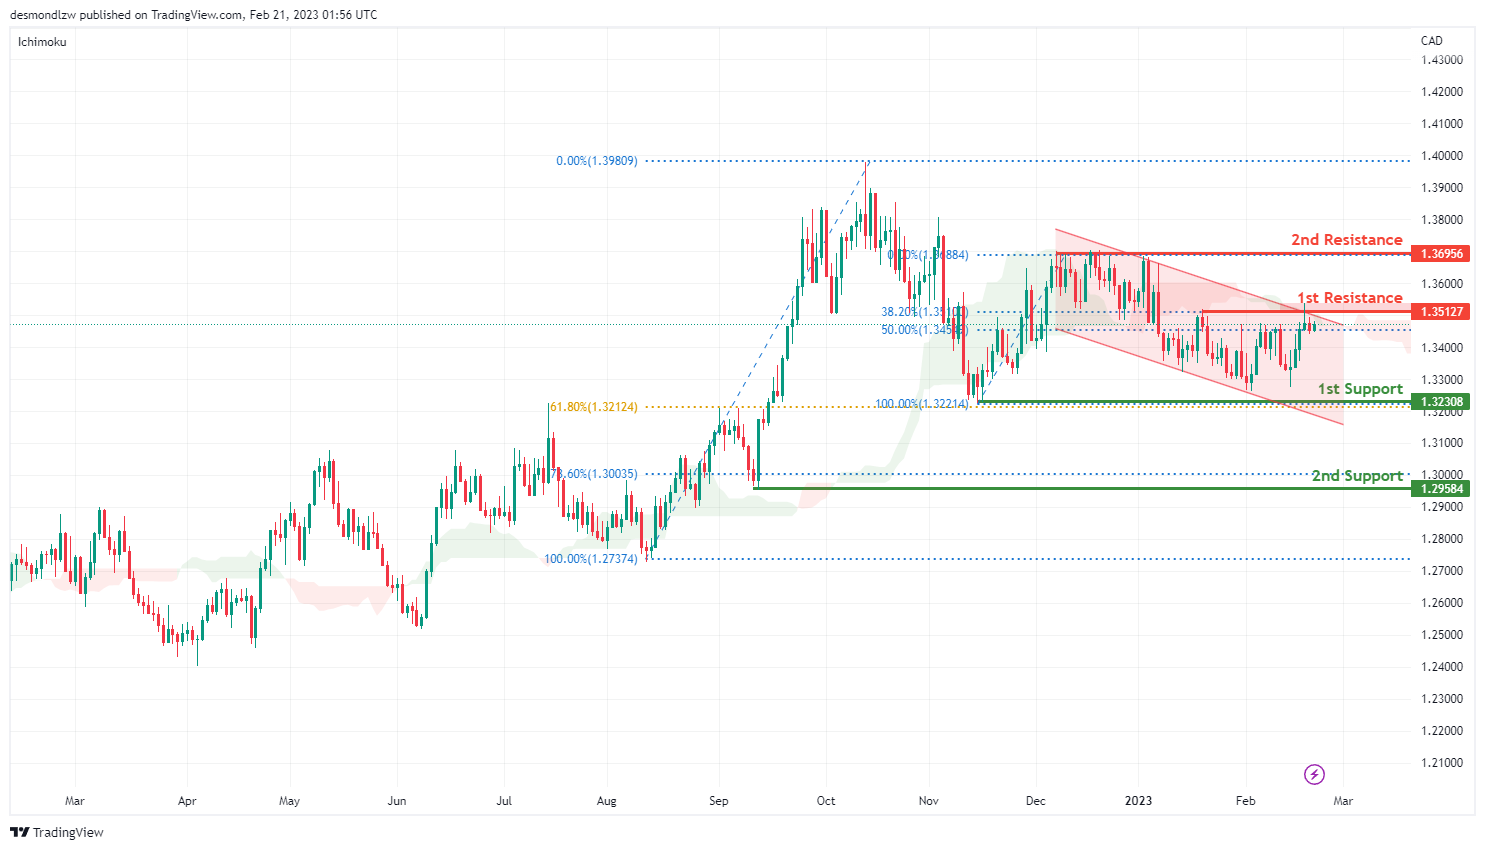
USD/CAD:
Looking at the H4 chart, my overall bias for USDCAD is bearish , as there is descending chanel. Expecting the current price possibly down to the 1st support at 1.32308 which is the previous swing low and also in line with the 61.8% Fibonacci retracement. The 2nd support is at 1.29584 where the 78.6% Fibonacci line is .
In an alternative scenario, the price could possibly break the 1st resistance at 1.35127 which is the recent swing high and in line with 38.2% Fibonacci retracement, before heading to the 2nd resistance at 1.36956 which is the overlap previous swing high.
Areas of consideration:
- H4 time frame, 2nd resistance at 1.36956
- H4 time frame, 1st resistance at 1.35127
- H4 time frame, 1st support at 1.32308
- H4 time frame, 2nd support at 1.29584
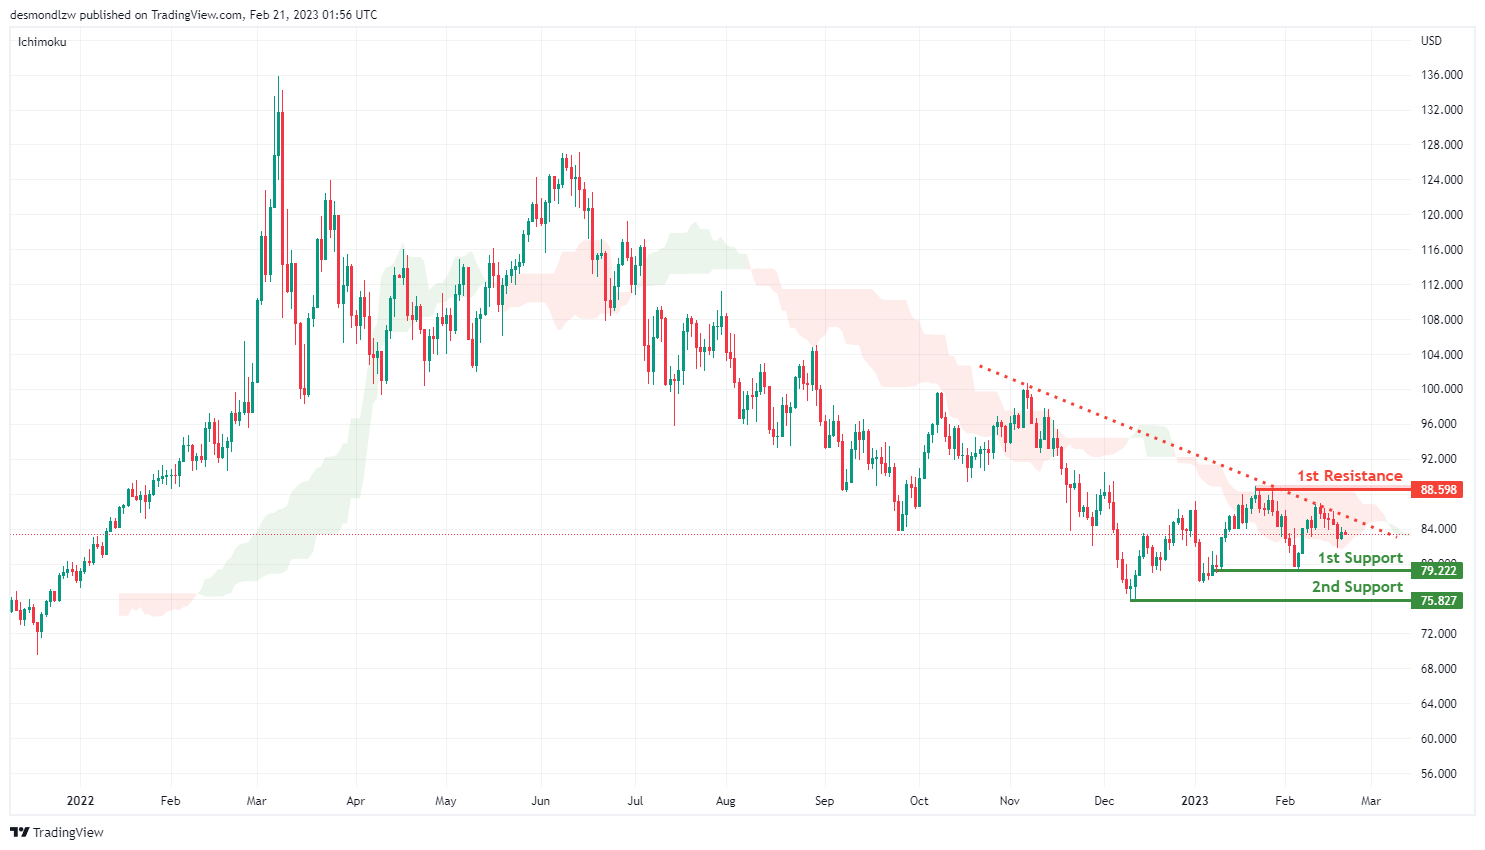
OIL:
Looking at the H4 chart, my overall bias for BOC is bearish as the current price acrossing the Ichimoku cloud, and there is an descending trend line. Expecting the price to head down towards the 1st support level at 79.222 which is the recent overlap swing low, before the price drops to the 2nd support at 75.827.
In an alternate scenario, the price could possibly head up towards the 1st resistance level at 88.598 which is the recent swing high.
Areas of consideration:
- H4 time frame, 1st resistance at 88.598
- H4 time frame,1st support at 79.587
- H4 time frame, 2nd support at 75.827
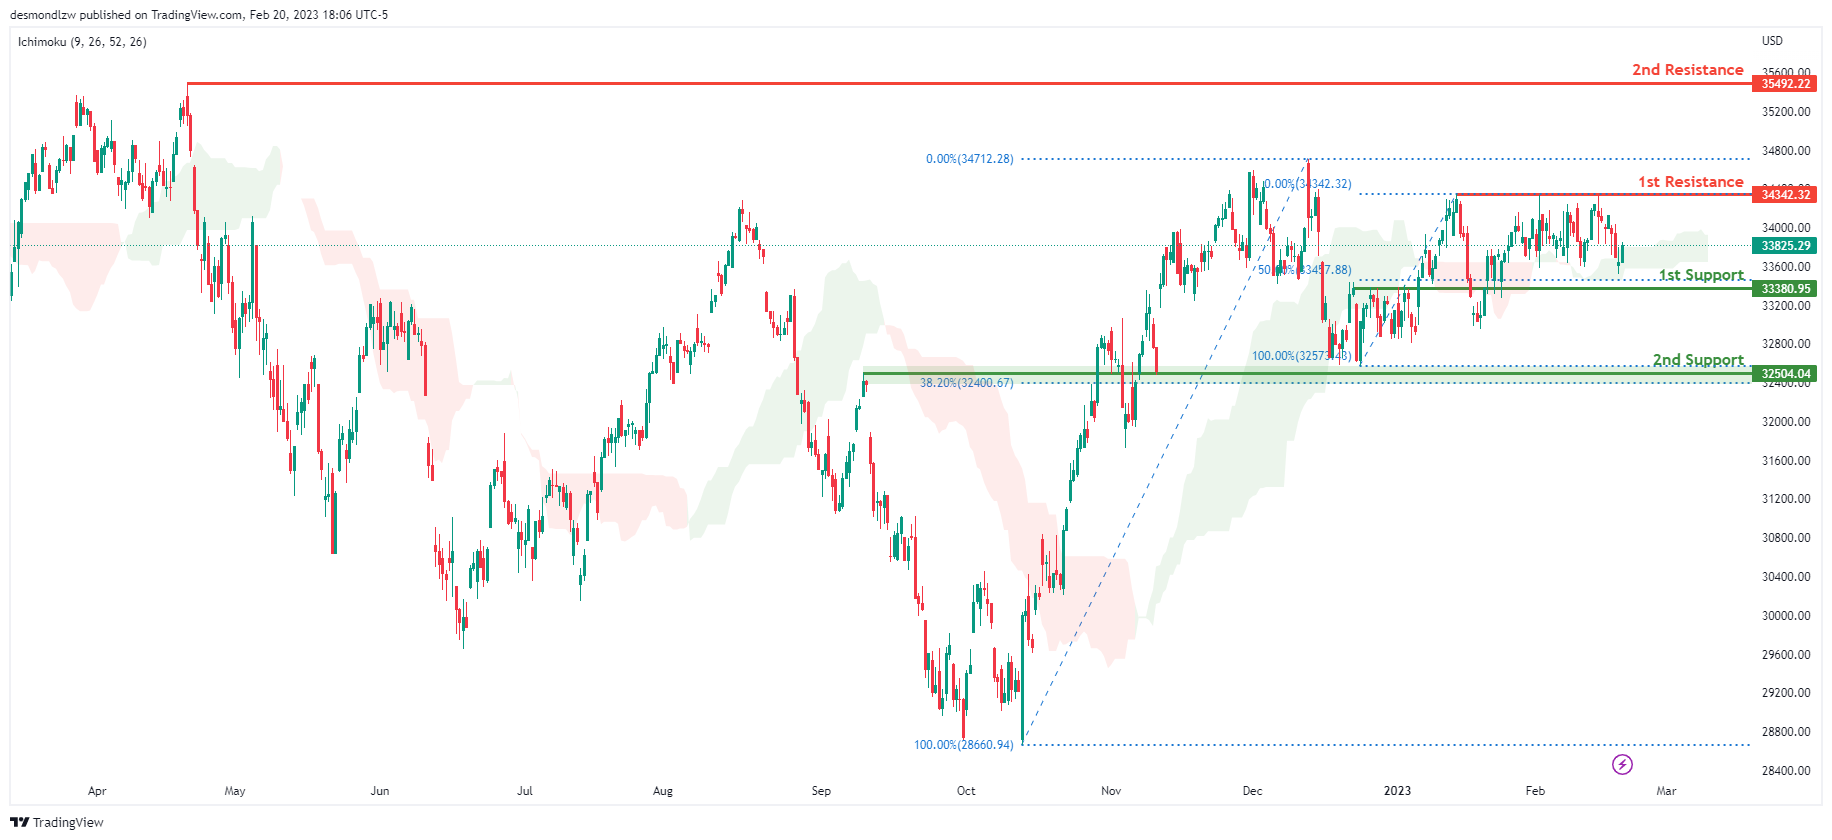
Dow Jones Industrial Average:
On the H4 chart, the overall bias for DJI is bullish. To add confluence to this, the price is crossing above the Ichimoku cloud which indicates a bullish market. If this bullish momentum continues, expect the price to possibly continue heading towards the 1st resistance line at 34342.32, where the recent swing high is.
In an alternative scenario, price could possibly head back down towards the 1st support at 33380.95, where the 50% Fibonacci line is.
Areas of consideration:
- H4 time frame, 1st support at 33380.95
- H4 time frame, 1st Resistance at 34342.32
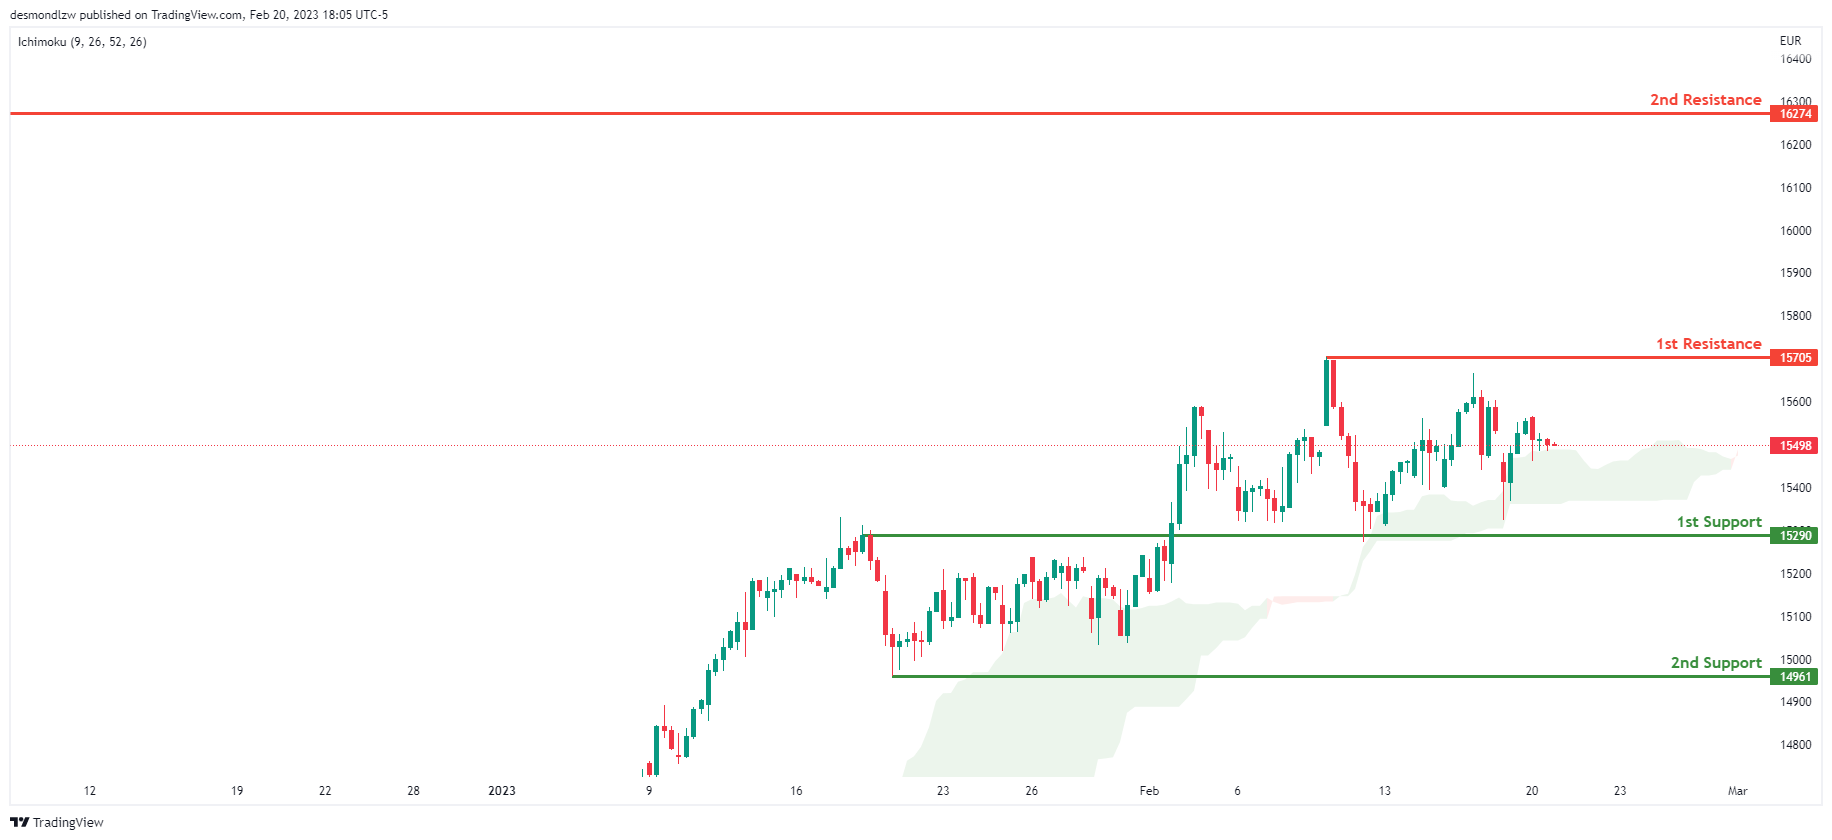
DAX:
Looking at the H4 chart, my overall bias for DAX is bullish due to the current price crossing above the Ichimoku cloud, indicating a bullish market. If this bullish momentum continues, expect the price to possibly head towards the 1st resistance line at 15705, where the recent high is.
In an alternative scenario, price could possibly head down to retest the 1st support at 15290, where the overlap support is.
Areas of consideration:
- H4 time frame, 1st resistance is at 15705
- H4 time frame, 1st support is at 15290
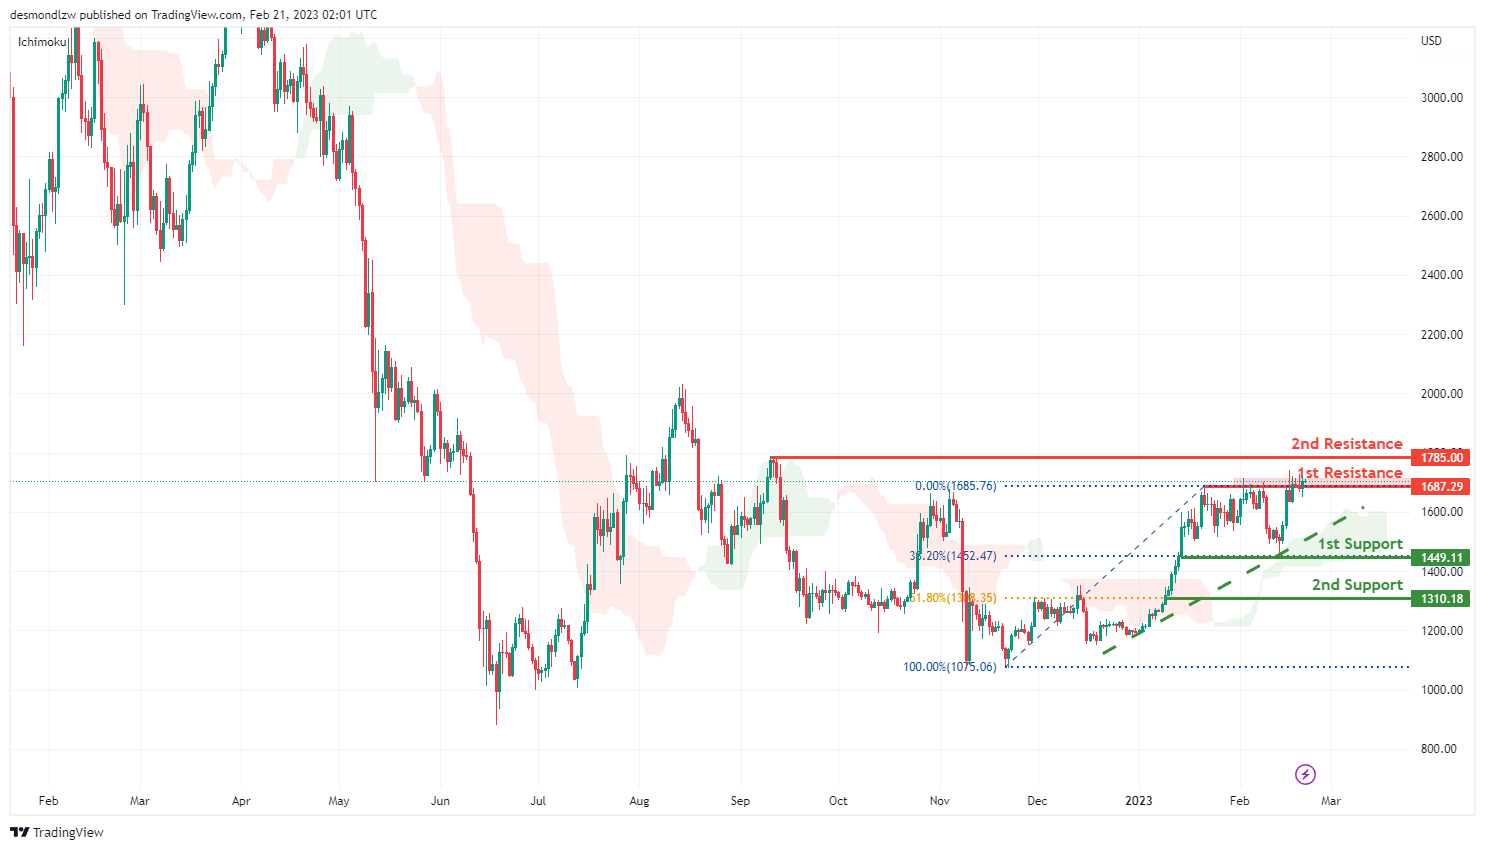
ETHUSD:
Looking at the H4 chart, my overall bias for ETHUSD is bullish, as there is a strong ascending trend line. The price may go up and break the 1st resistance line at 1685.76 before breaking the 2nd resistance line at 1785.00 which is the previous swing high.
In an alternate scenario, the price may retrace back to the 1st support line at 1449.11 which is in line with 38.2% Fibonacci retracement, before it heads towards the 2nd support at 1310.18 which is in line with 61.8% Fibonacci retracement.
Areas of consideration:
- H4 time frame, 2nd resistance of 1785.00
- H4 time frame, 1st resistance of 1685.76
- H4 time frame, 1st support at 1449.11
- H4 time frame, 2nd support at 1310.18
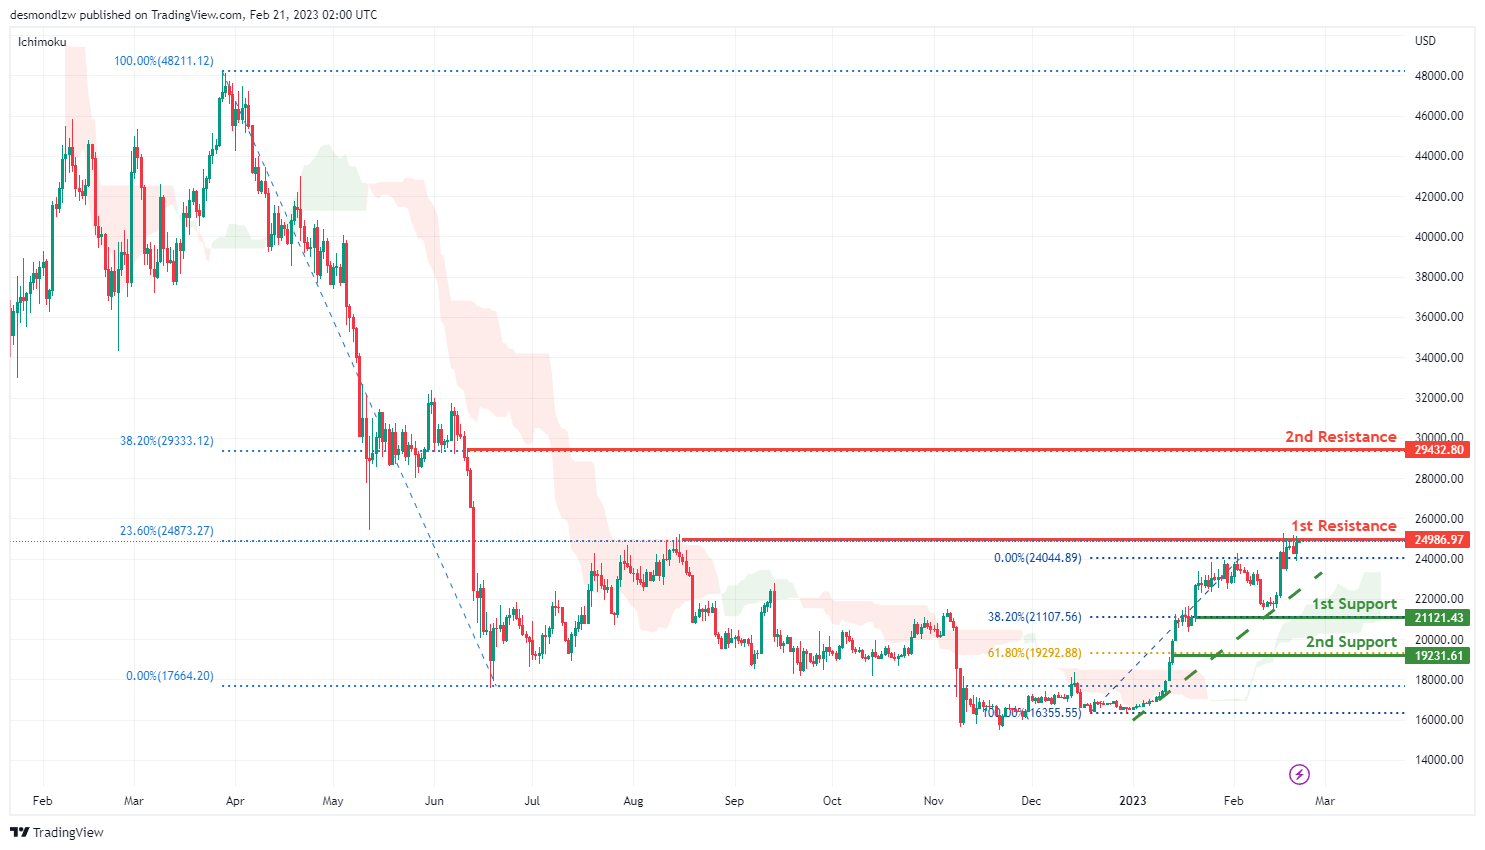
BTCUSD:
Looking at the H4 chart, my overall bias for BTCUSD is bulllish. As there is an ascending trend line, expect the price could possibly head up to the 1st resistance at 24986.97 which is the overlap recent swing high, before it head up to the 2nd resistance 29432.80 where the 38.2% Fibonacci retracemnt is.
In an alternate scenario, The price may go down towards the 1st support line at 21121.43 which is in line with 38.2% Fibonacci retracement, before heading down towards the 2nd support at 19231.61 which is in line with 61.8% Fibonacci retracement.
Areas of consideration:
- H4 time frame, 2nd resistance 29432.80
- H4 time frame, 1st resistance 24986.97
- H4 time frame, 1st support at 21121.43
- H4 time frame, 2nd support at 19231.61
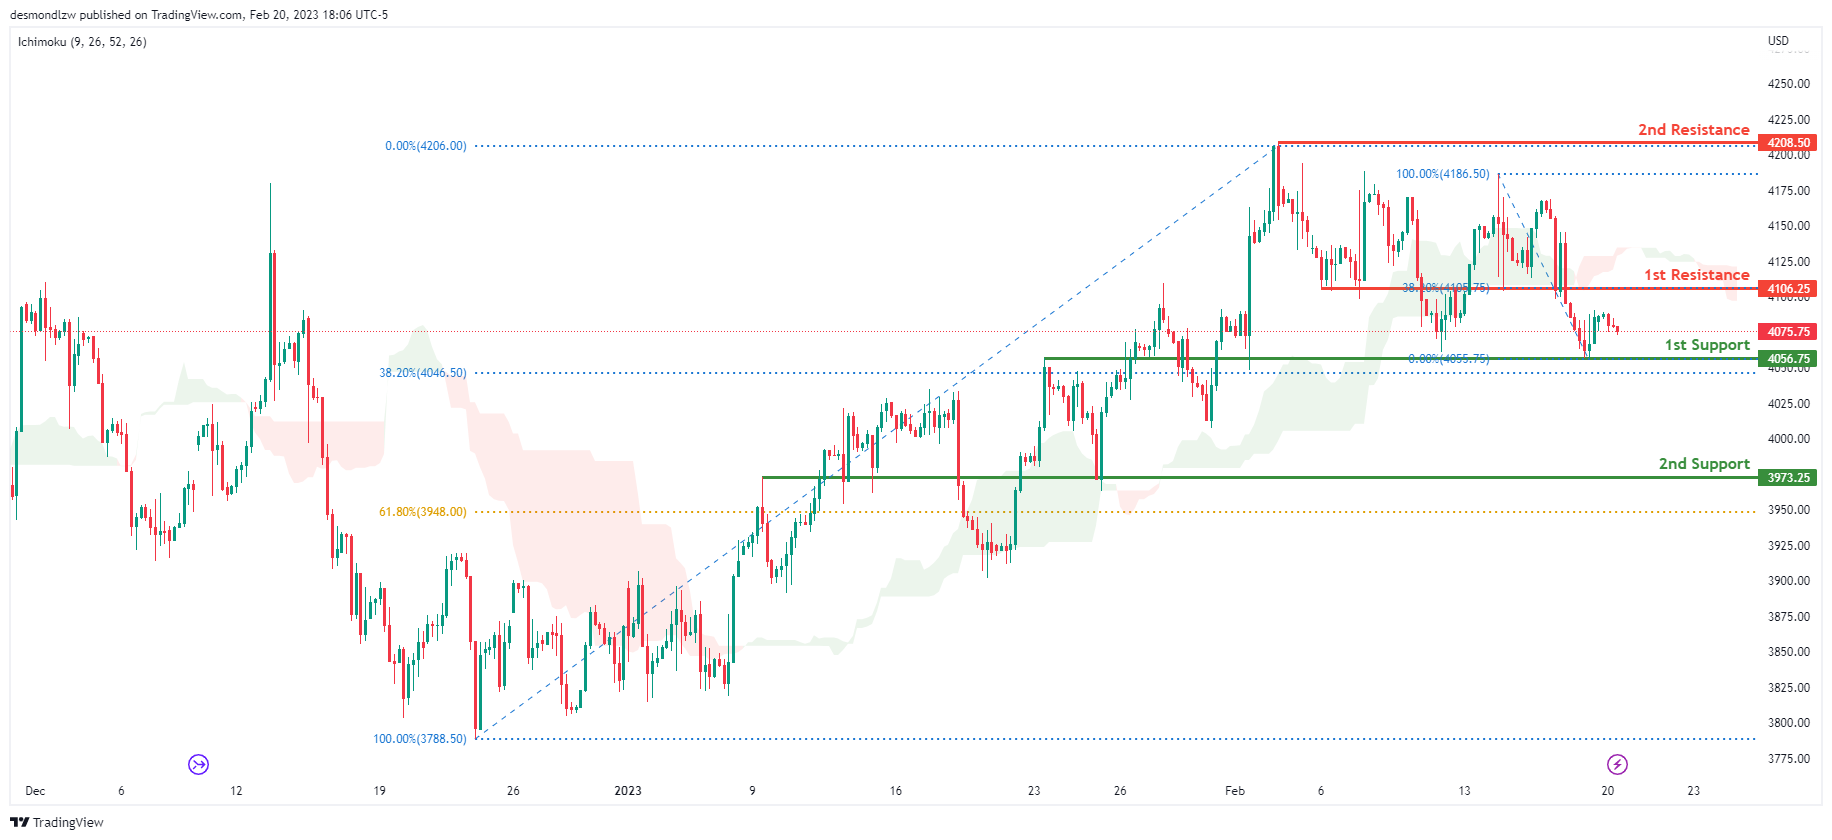
S&P 500:
Looking at the H4 chart, my overall bias for S&P500 is bearish due to the current price being below the Ichimoku cloud, indicating a bearish market. If this bearish momentum continues, expect the price to possibly break the 1st support at 4056.75, where the overlap support and 38.2% Fibonacci line is, before heading towards the 2nd support at 3973.25 which is the overlap support and slightly above where the 61.8% Fibonacci line is.
In an alternative scenario, price could possibly head back up to retest the 1st resistance at 4106.25, where the overlap resistance and 38.2% Fibonacci line is.
Areas of consideration:
- H4 time frame, 1st support at 4056.75
- H4 time frame, 2nd support at 3973.25
- H4 time frame, 1st resistance at 4106.25


