
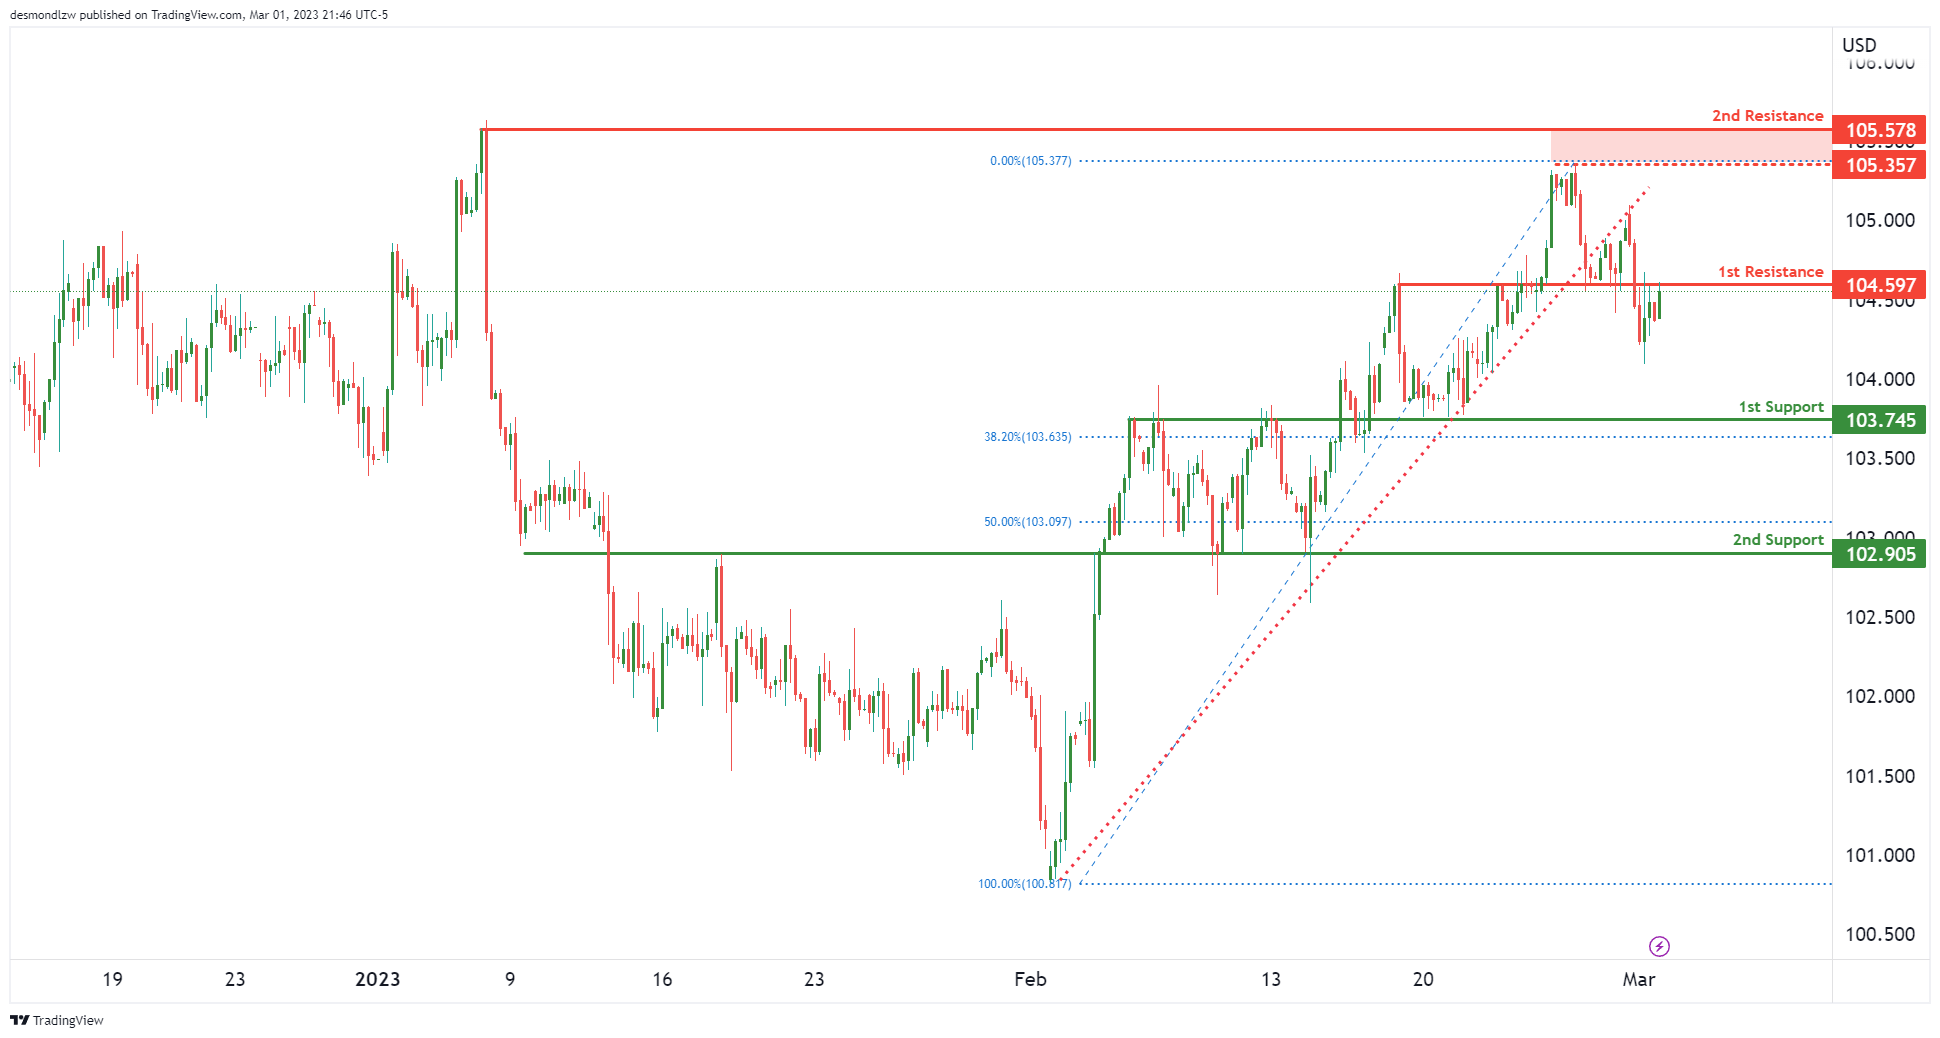
DXY:
Price is testing our 1st resistance at 104.59 which is an overlap resistance. Reversing from here could see it drop to our 1st support at 103.74 which lines up with our 38.2% Fibonacci retracement. Breaking that level could see a further drop to 2nd support at 102.90 that lines up with our 50% Fibonacci retracement.
It’s worth noting that price has recently broken our ascending support-turned-resistrance trend line suggesting a possible change in momentum from bullish to bearish.
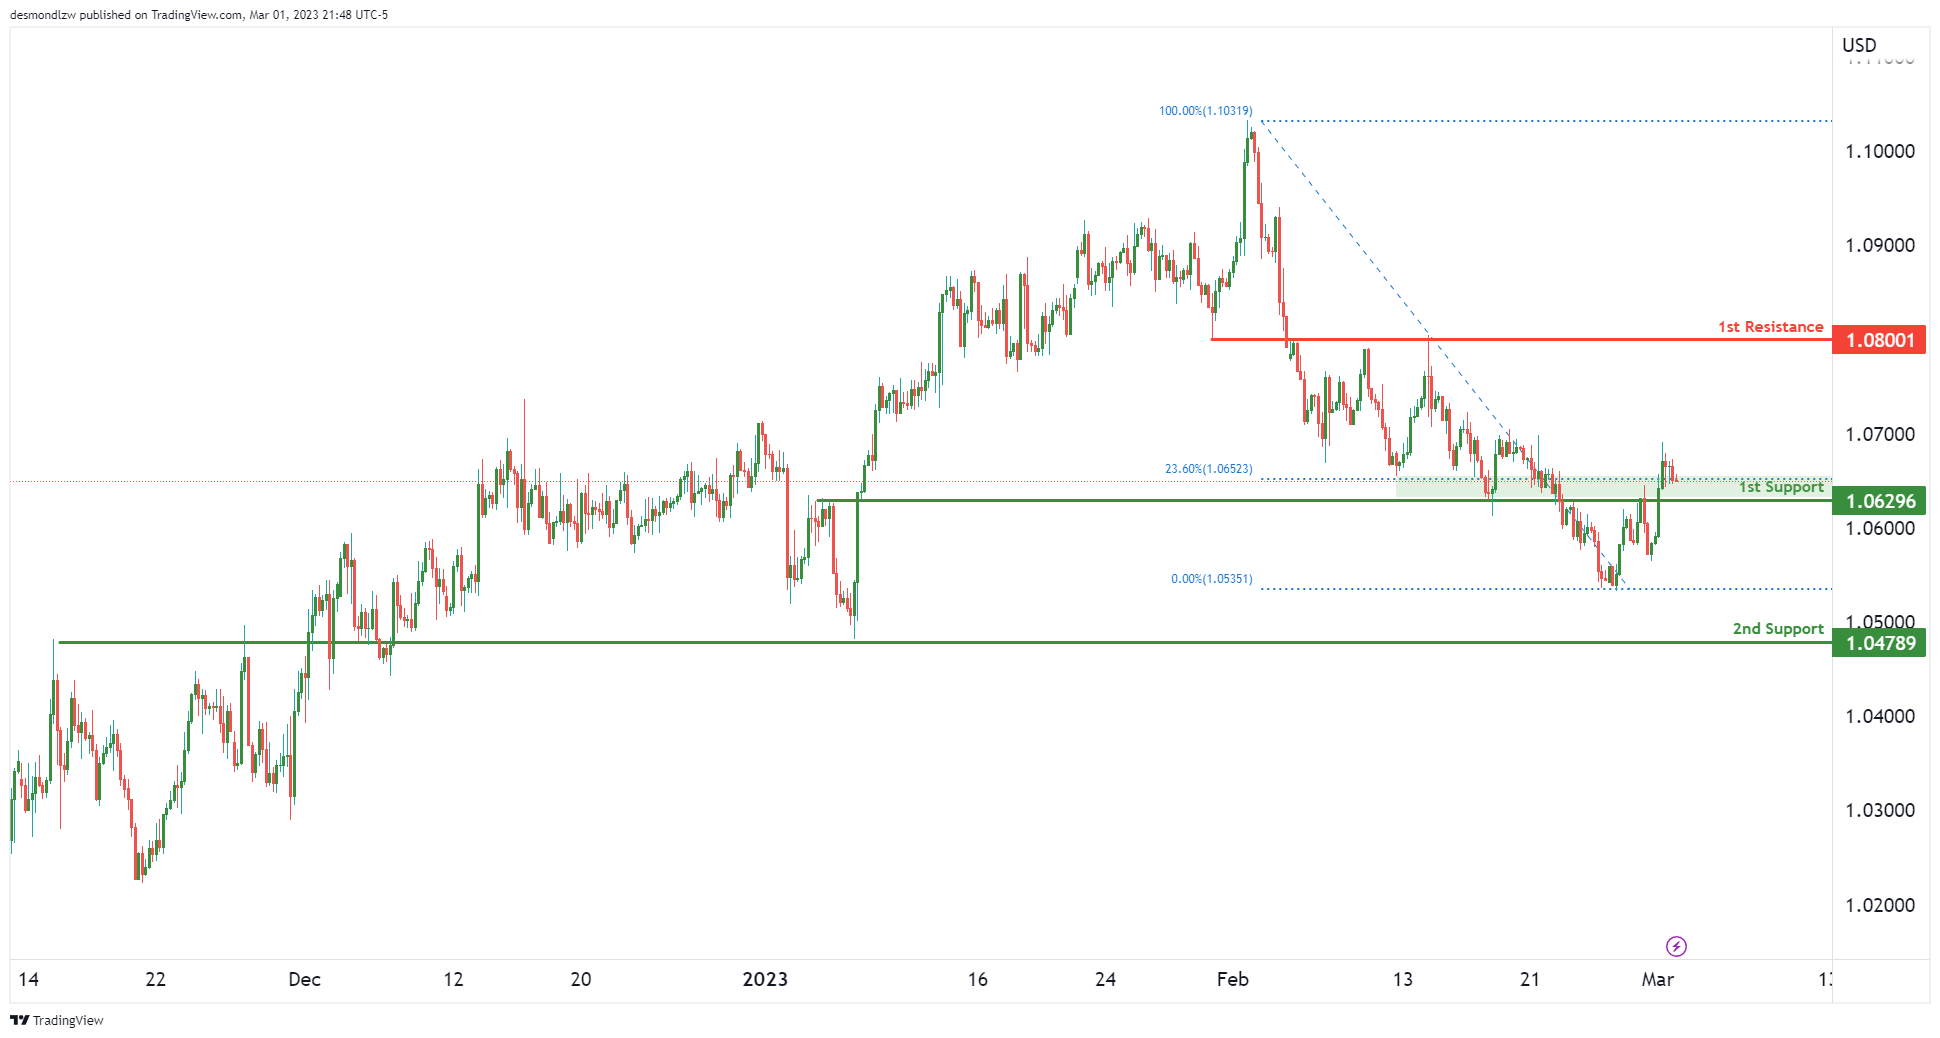
EUR/USD:
Price is testing our 1st support at 1.0629 which lines up with the 23.6% Fibonacci retracement – this Fibonacci retracement is traditionally seen as the first retracement that needs to be broken to trigger a bigger move up. If price were to bounce from here, the 1st resistance to watch out for is 1.0800.
Were prices to drop from here, the overlap support we’re looking at is down at 1.0478.
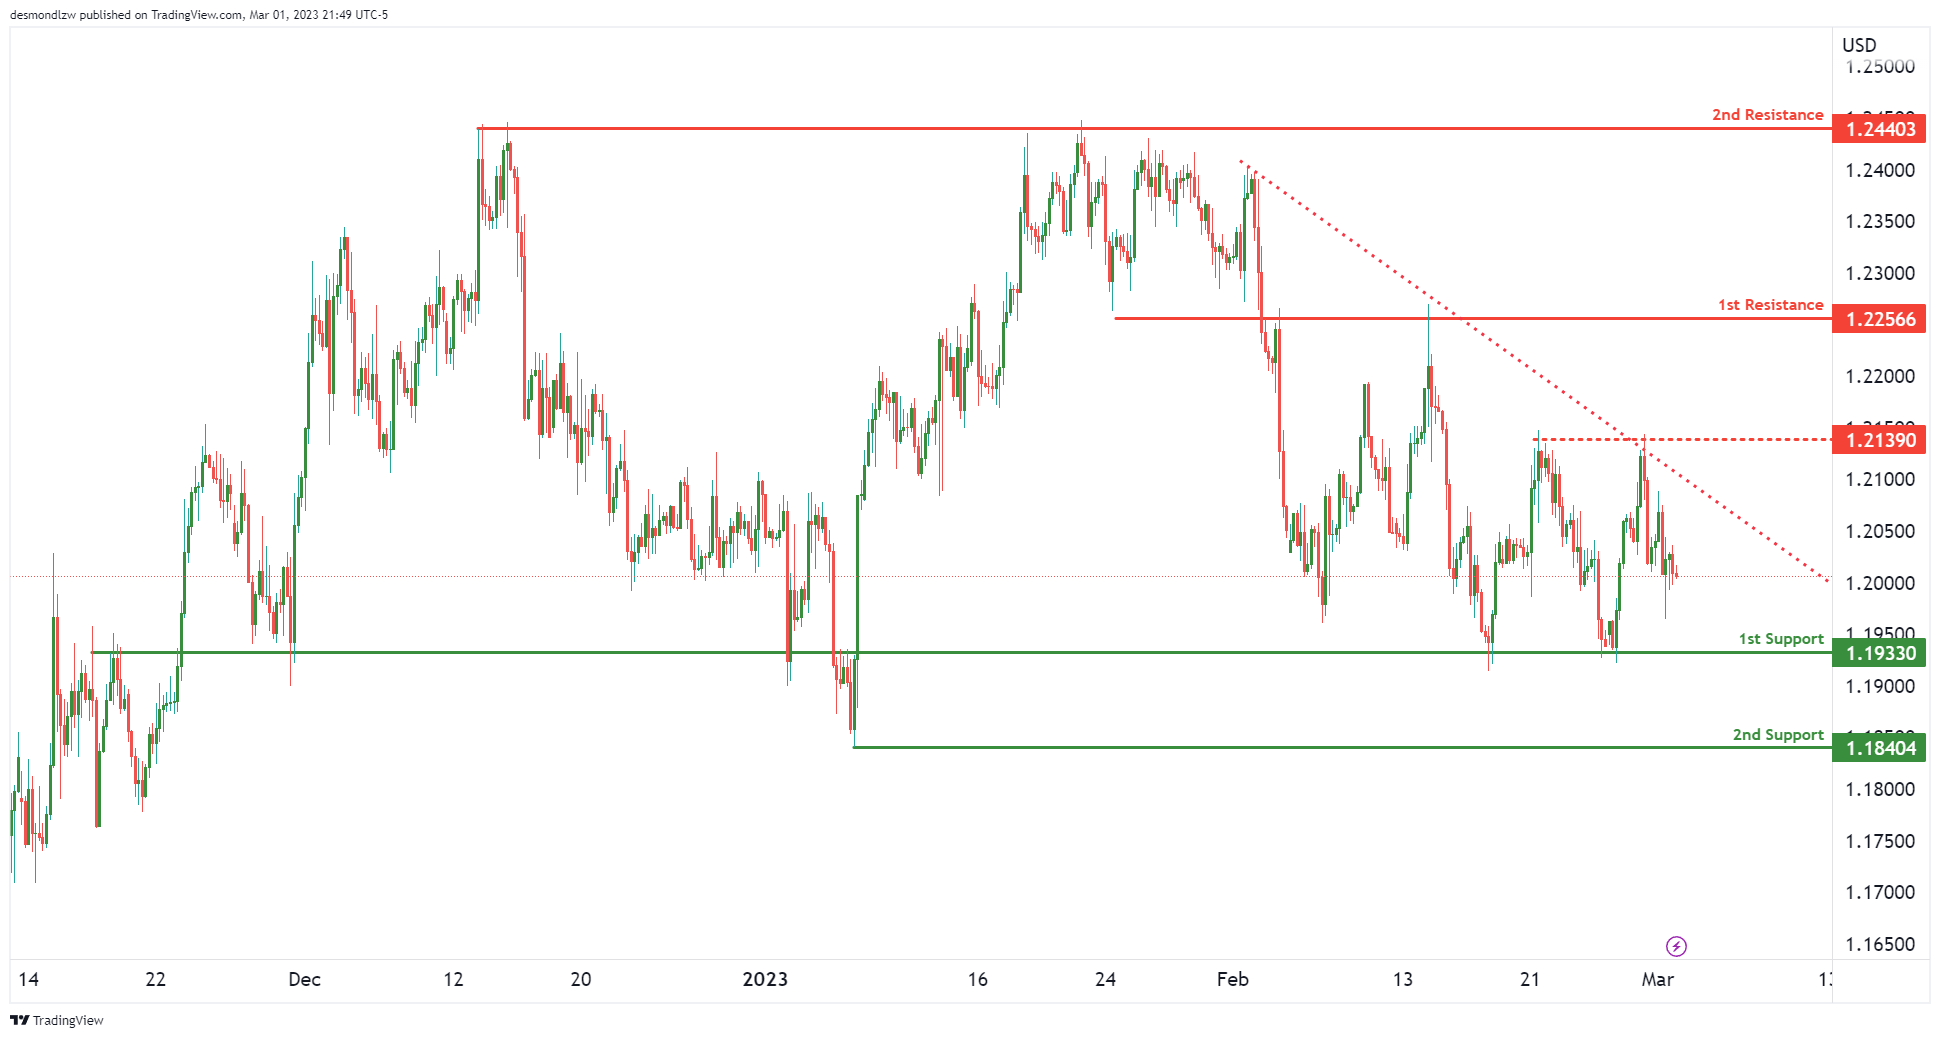
GBP/USD:
Price is seeing a descending resistance line squeeze it against our 1st support at 1.1933 which is a strong overlap support. If prices were to break this 1st support, the next key support to watch out for is the recent swing low at 1.1840.
In terms of resistance, our intermediate resistance is at 1.2139 which is a double swing high resistance. Breaking this, along with the descending resistance trend line, could trigger a move up to 1.2256 which is our 1st resistance.
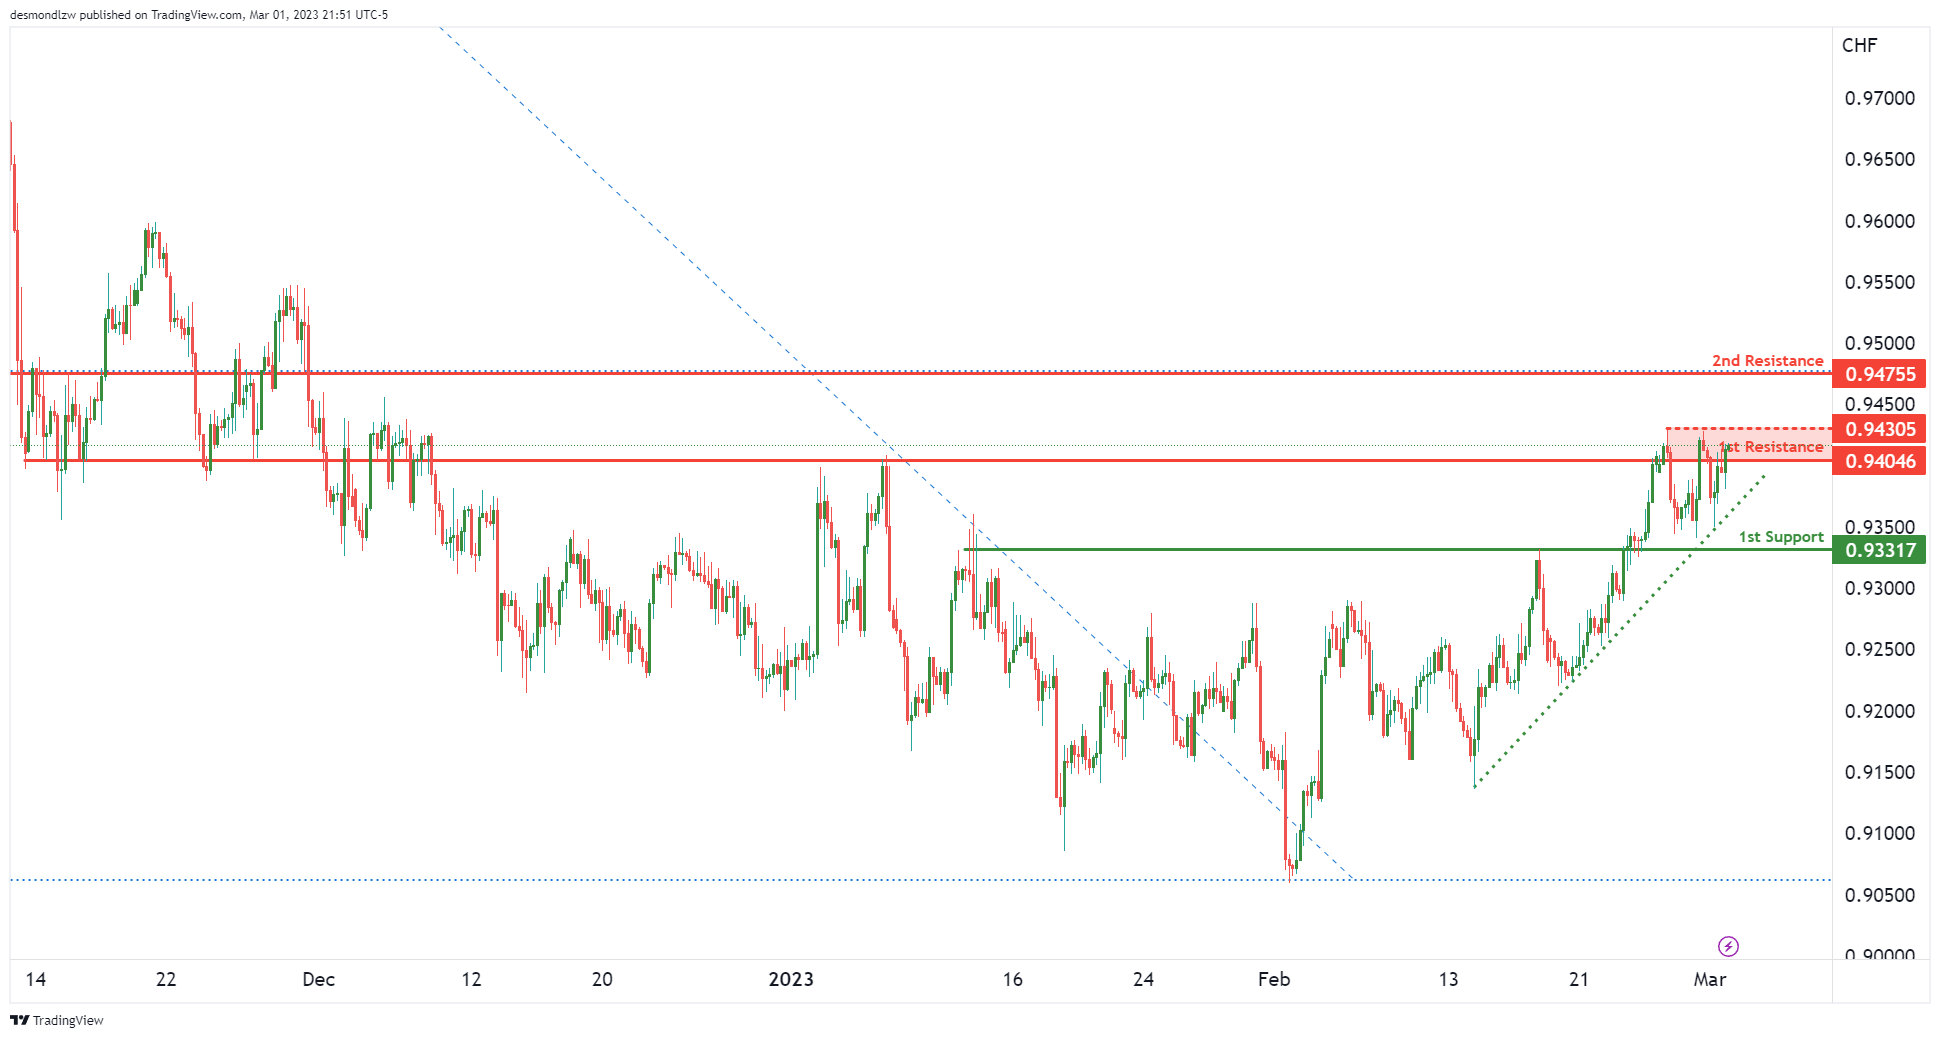
USD/CHF:
Price is seeing an ascending support line continue to push it up against our 1st resistance area of 0.9430. If price were to break this level, we could see a further push u p to 0.9475 which lines up with the larger 38.2% Fibonacci retracement.
If prices fail to break the 1st resistance and instead reverse, we could see it drop to the 1st support at 0.9331 which is a strong overlap support.
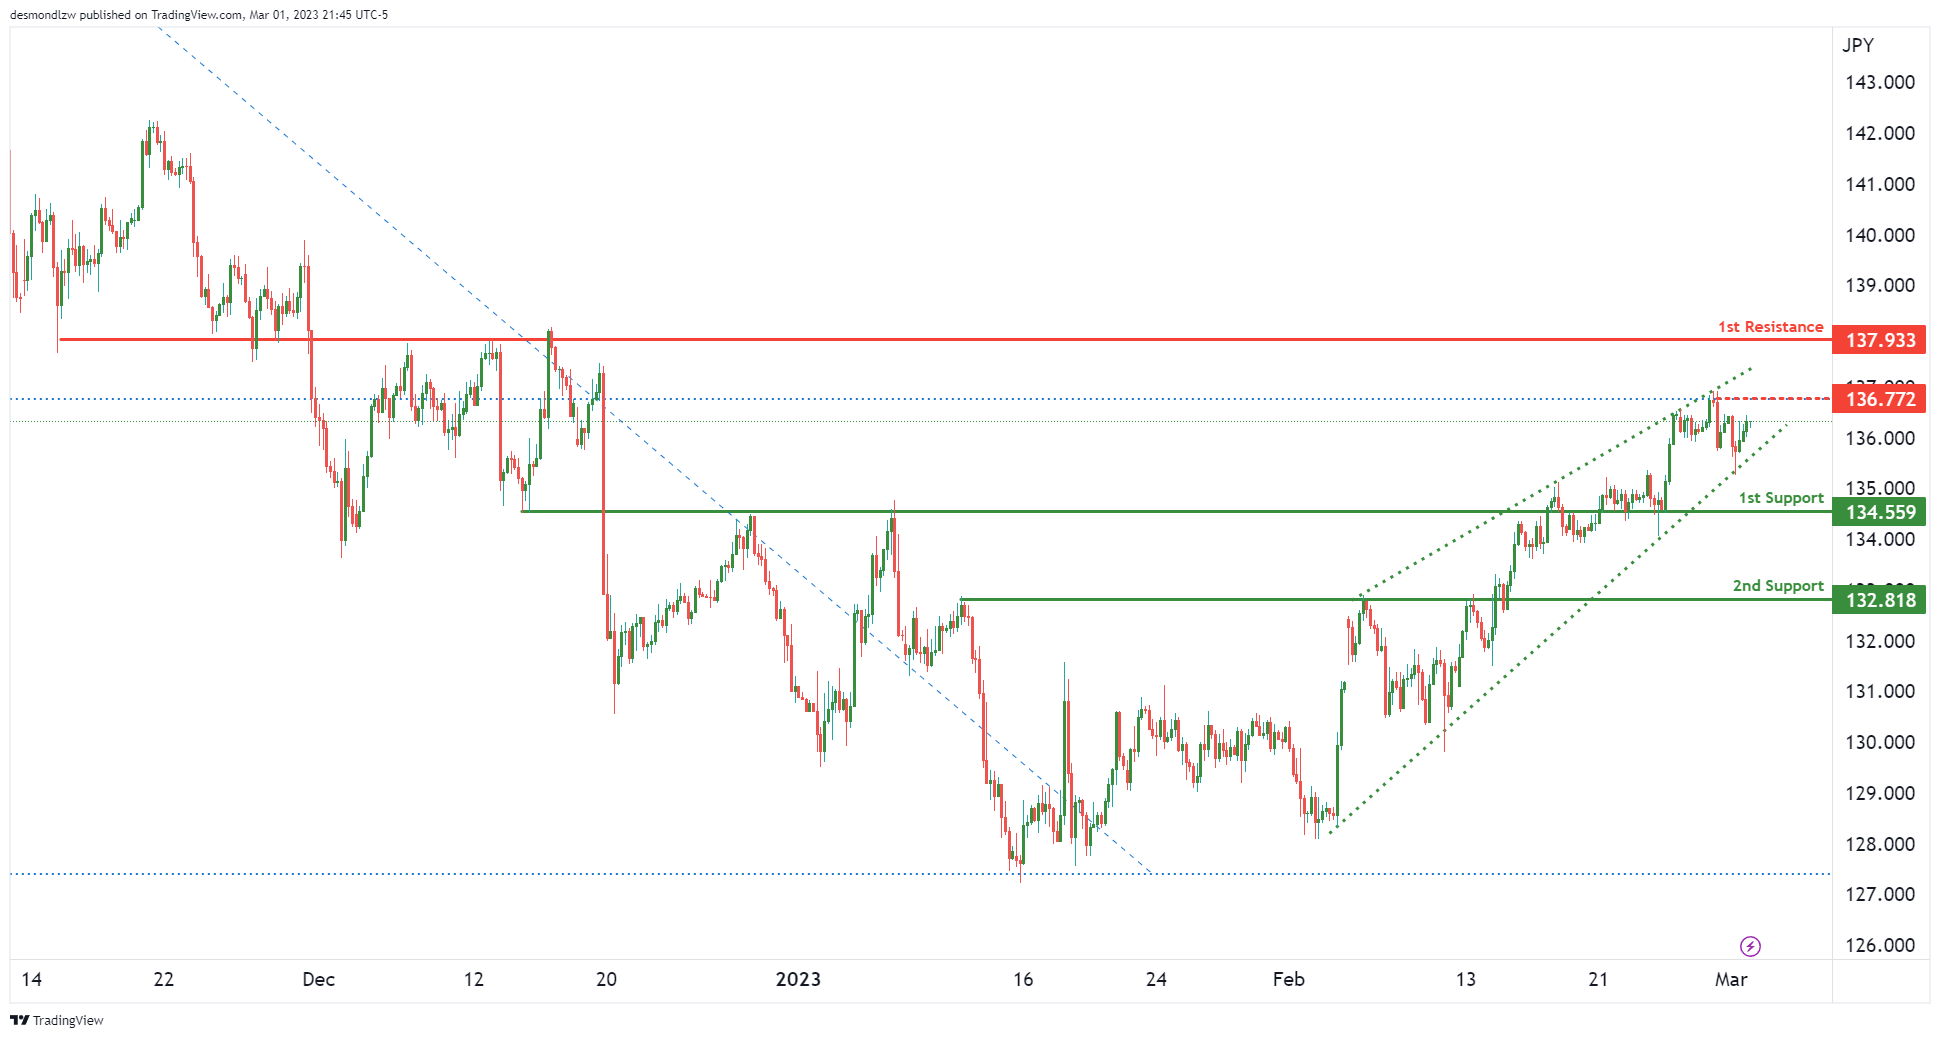
USD/JPY:
We’re seeing price rise nicely within our ascending wedge with the first intermediate resistance at 136.77 which is a 38.2% Fibonacci retracement. If it breaks this level, then the 1st resistance is at 137.93 which is a strong overlap resistance.
In terms of support, we can see an overlap support at 134.55 which is our 1st support. Breaking that could trigger a drop to 2nd support at 132.81.
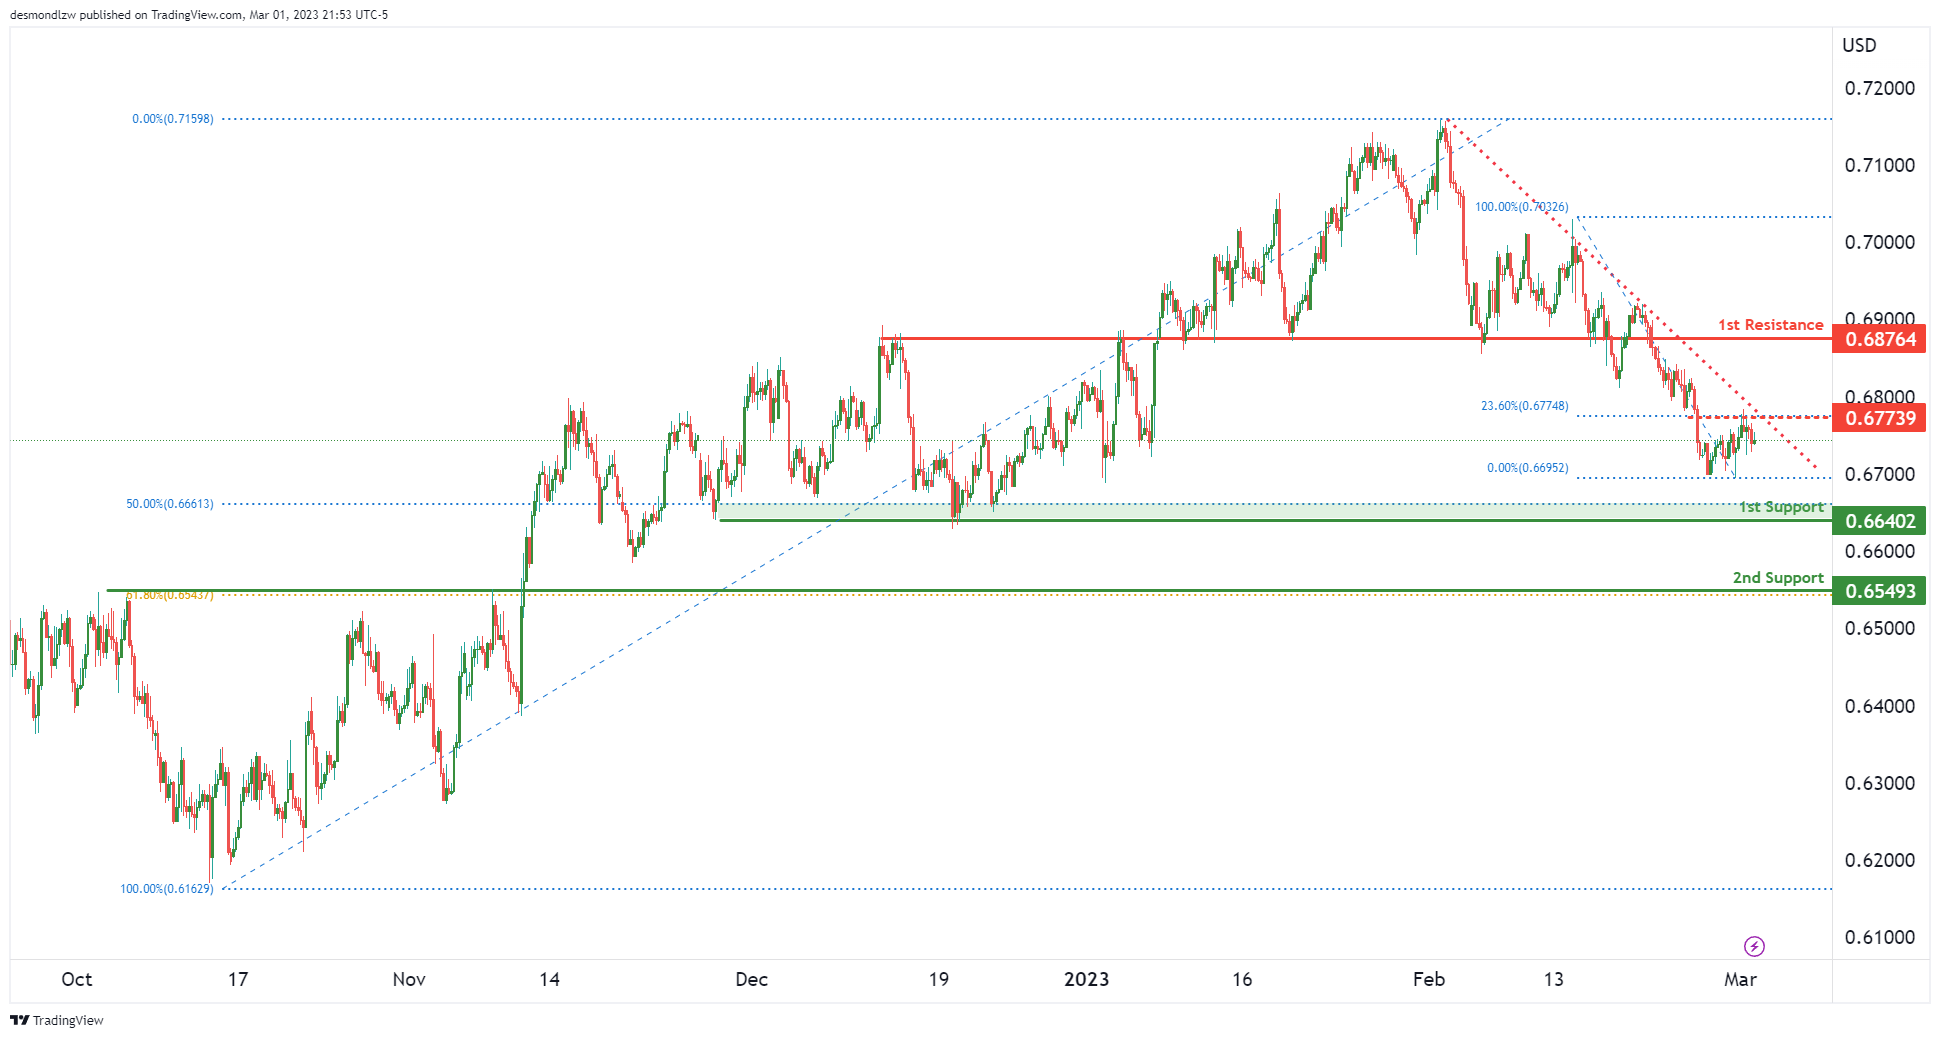
AUD/USD:
Price is seeing a descending resistance line push prices down towards our 1st support at 0.6640 which is a multiple swing low support + 50% Fibonacci retracement. It’s worth noting that price has also reacted off the intermediate resistance at 0.6773 which is an overlap resistance along with a 23.6% Fibonacci retracement.
If prices were to break the 1st support, we could see a bigger drop to 0.6549 which is a pullback support that lines up with the 61.8% Fibonacci retracement.
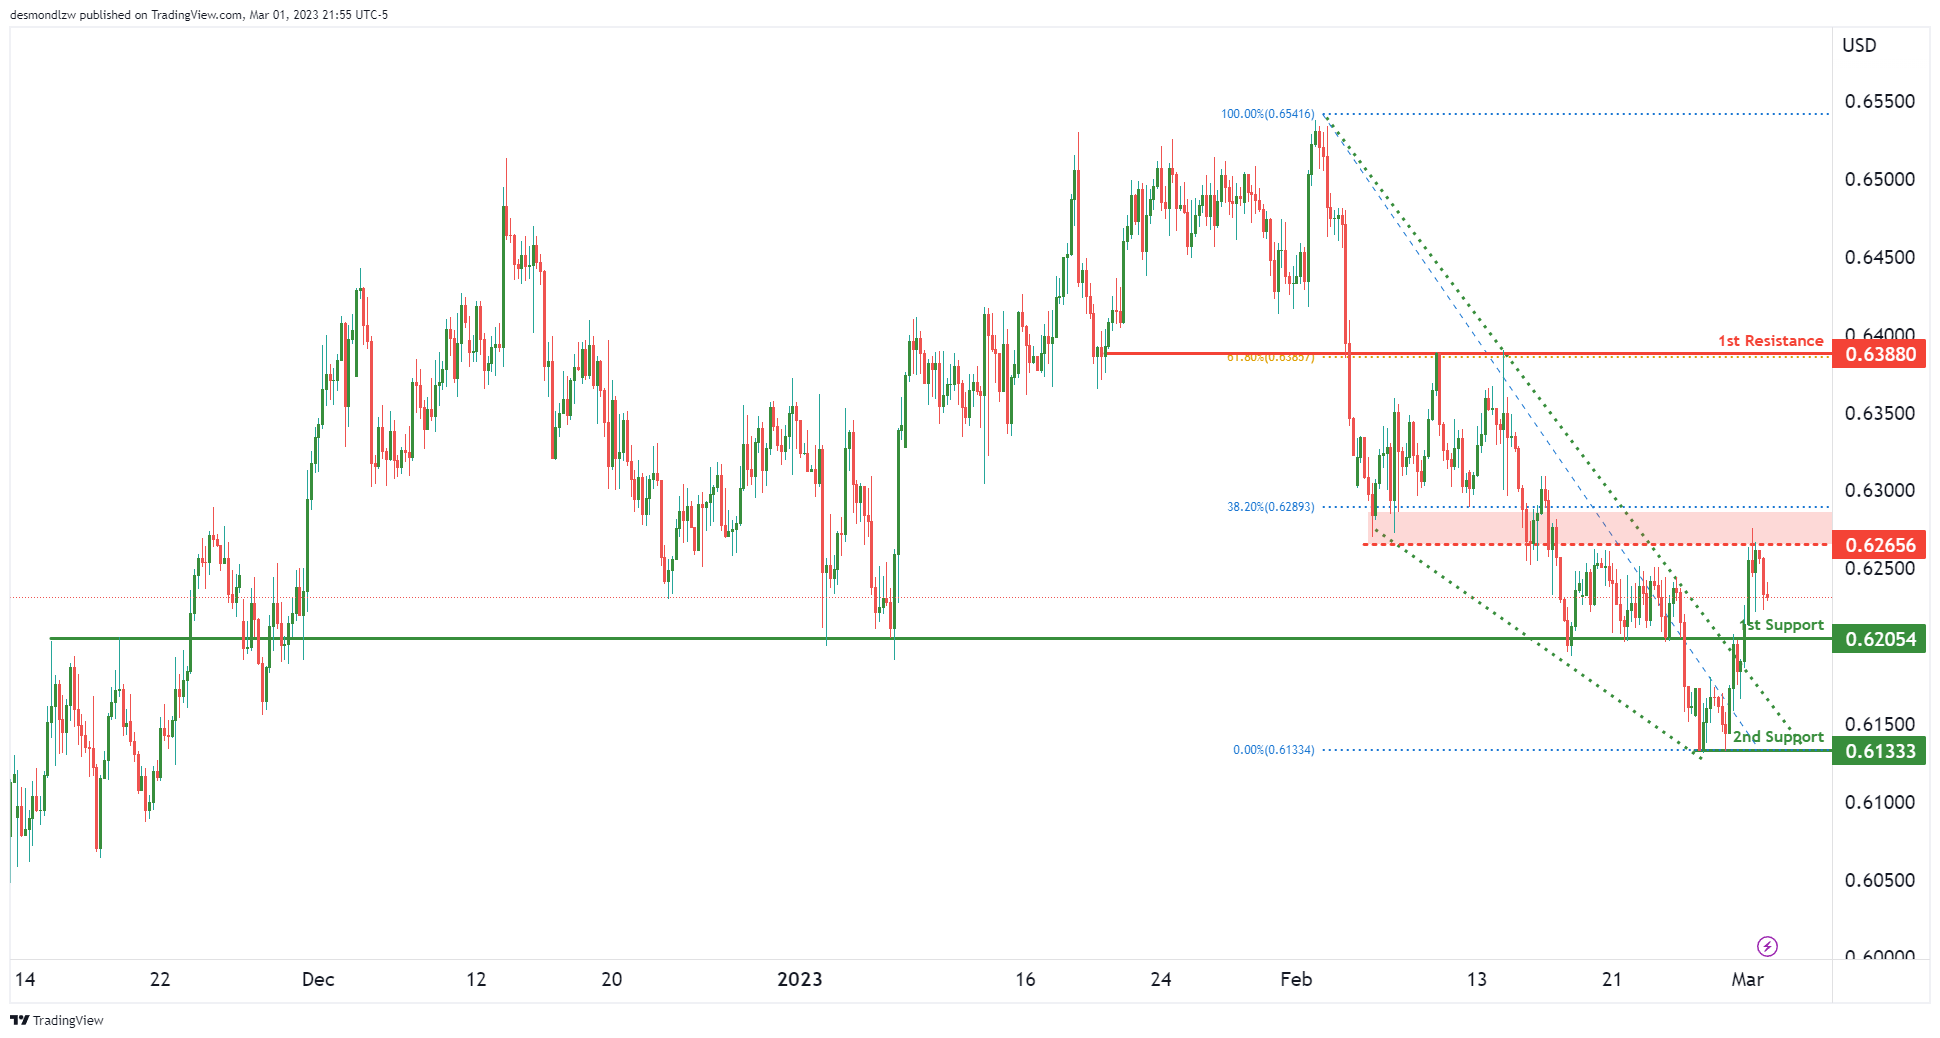
NZD/USD:
Price is seeing a strong overlap support at 0.6205 which is our 1st support. Ir prices were to rise from here, the first intermediate resistance it would face is at 0.6265 which is an overlap resistance that lines up with a 38.2% Fibonacci retracement. Breaking this intermediate resistance could trigger a bigger move up to 1st resistance at 0.6388 that is a 61.8% Fibonacci retracement and an overlap resistance.
If price were to reverse and break our 1st support instead, then we could see a drop towards 0.6133 which is our most recent swing low support.
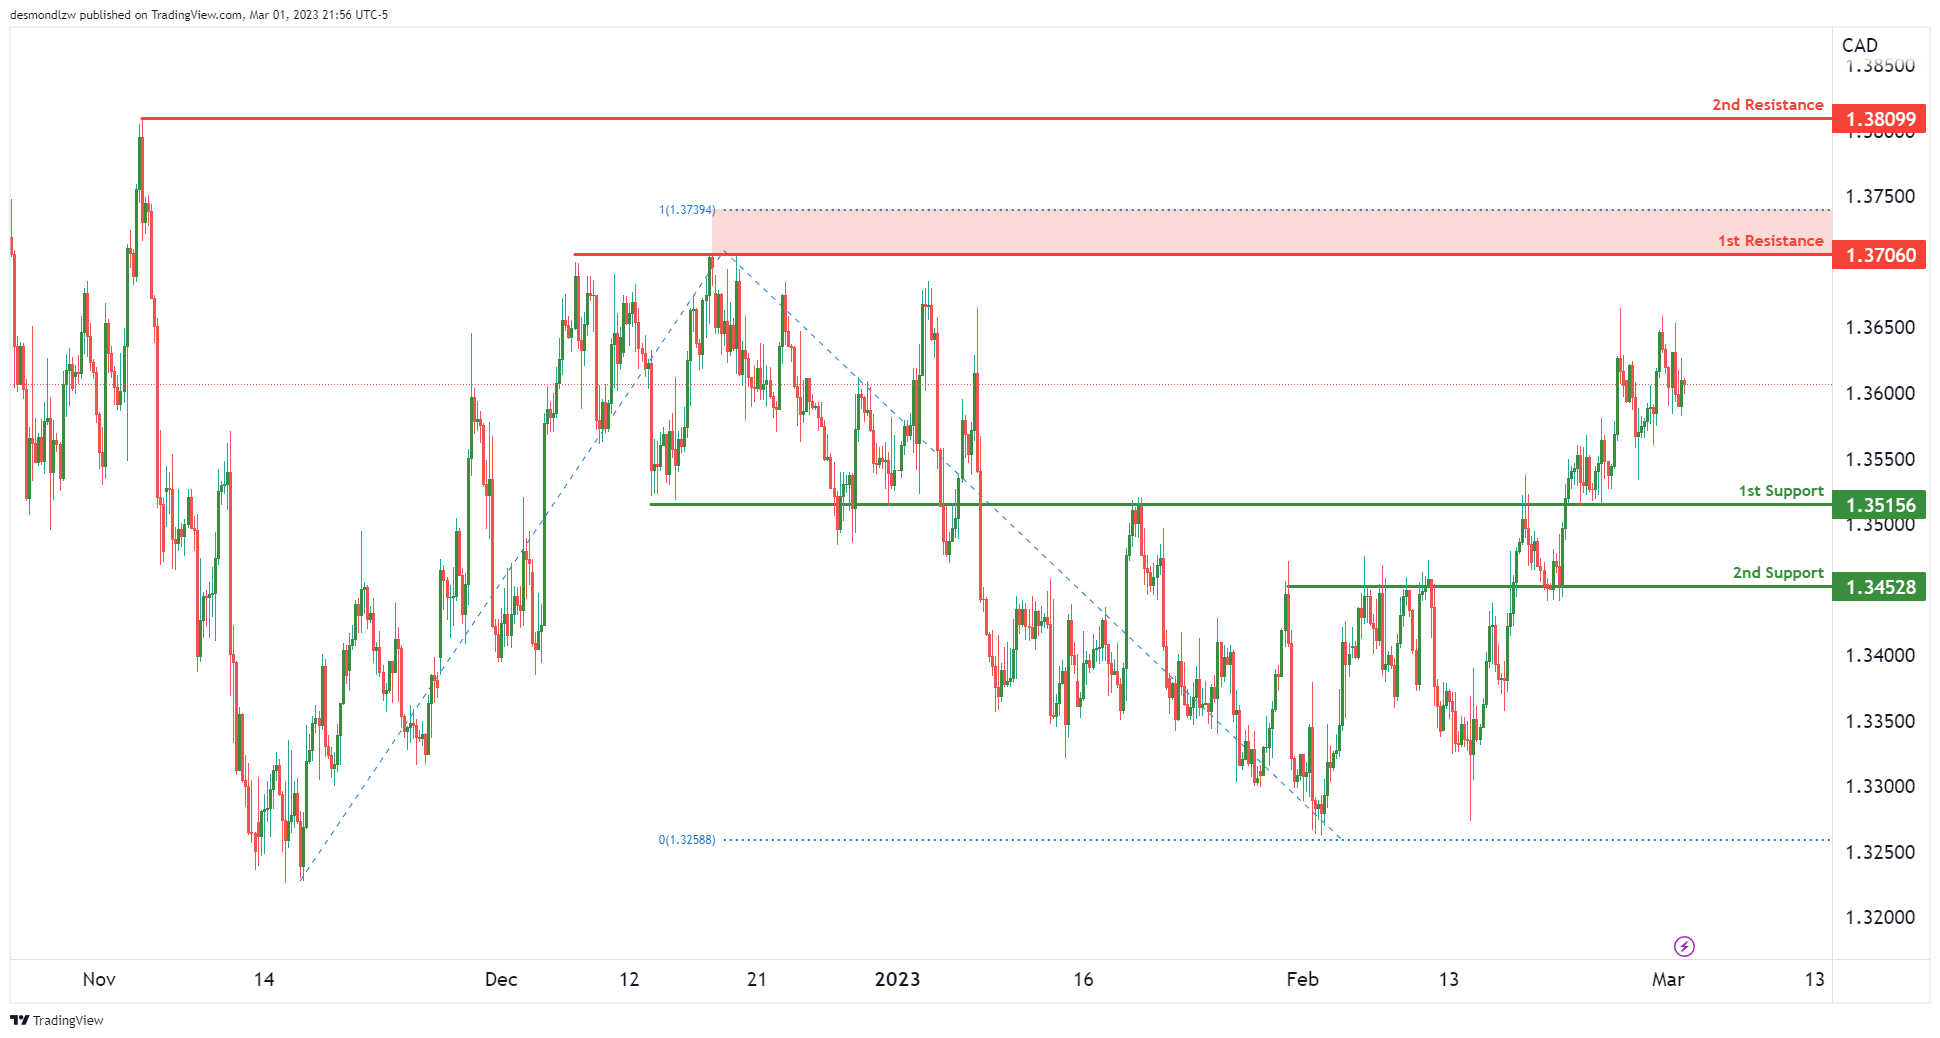
USD/CAD:
We’re seeing prices hover between two major levels. The 1st resistance of 1.3706 which is a multiple swing high resistance level and the 1st support of 1.3515 that is a strong overlap support level. Breaking either of these levels could trigger moves up to the 2nd resistance at 1.3809 or the 2nd support at 1.3452 which is another overlap support.
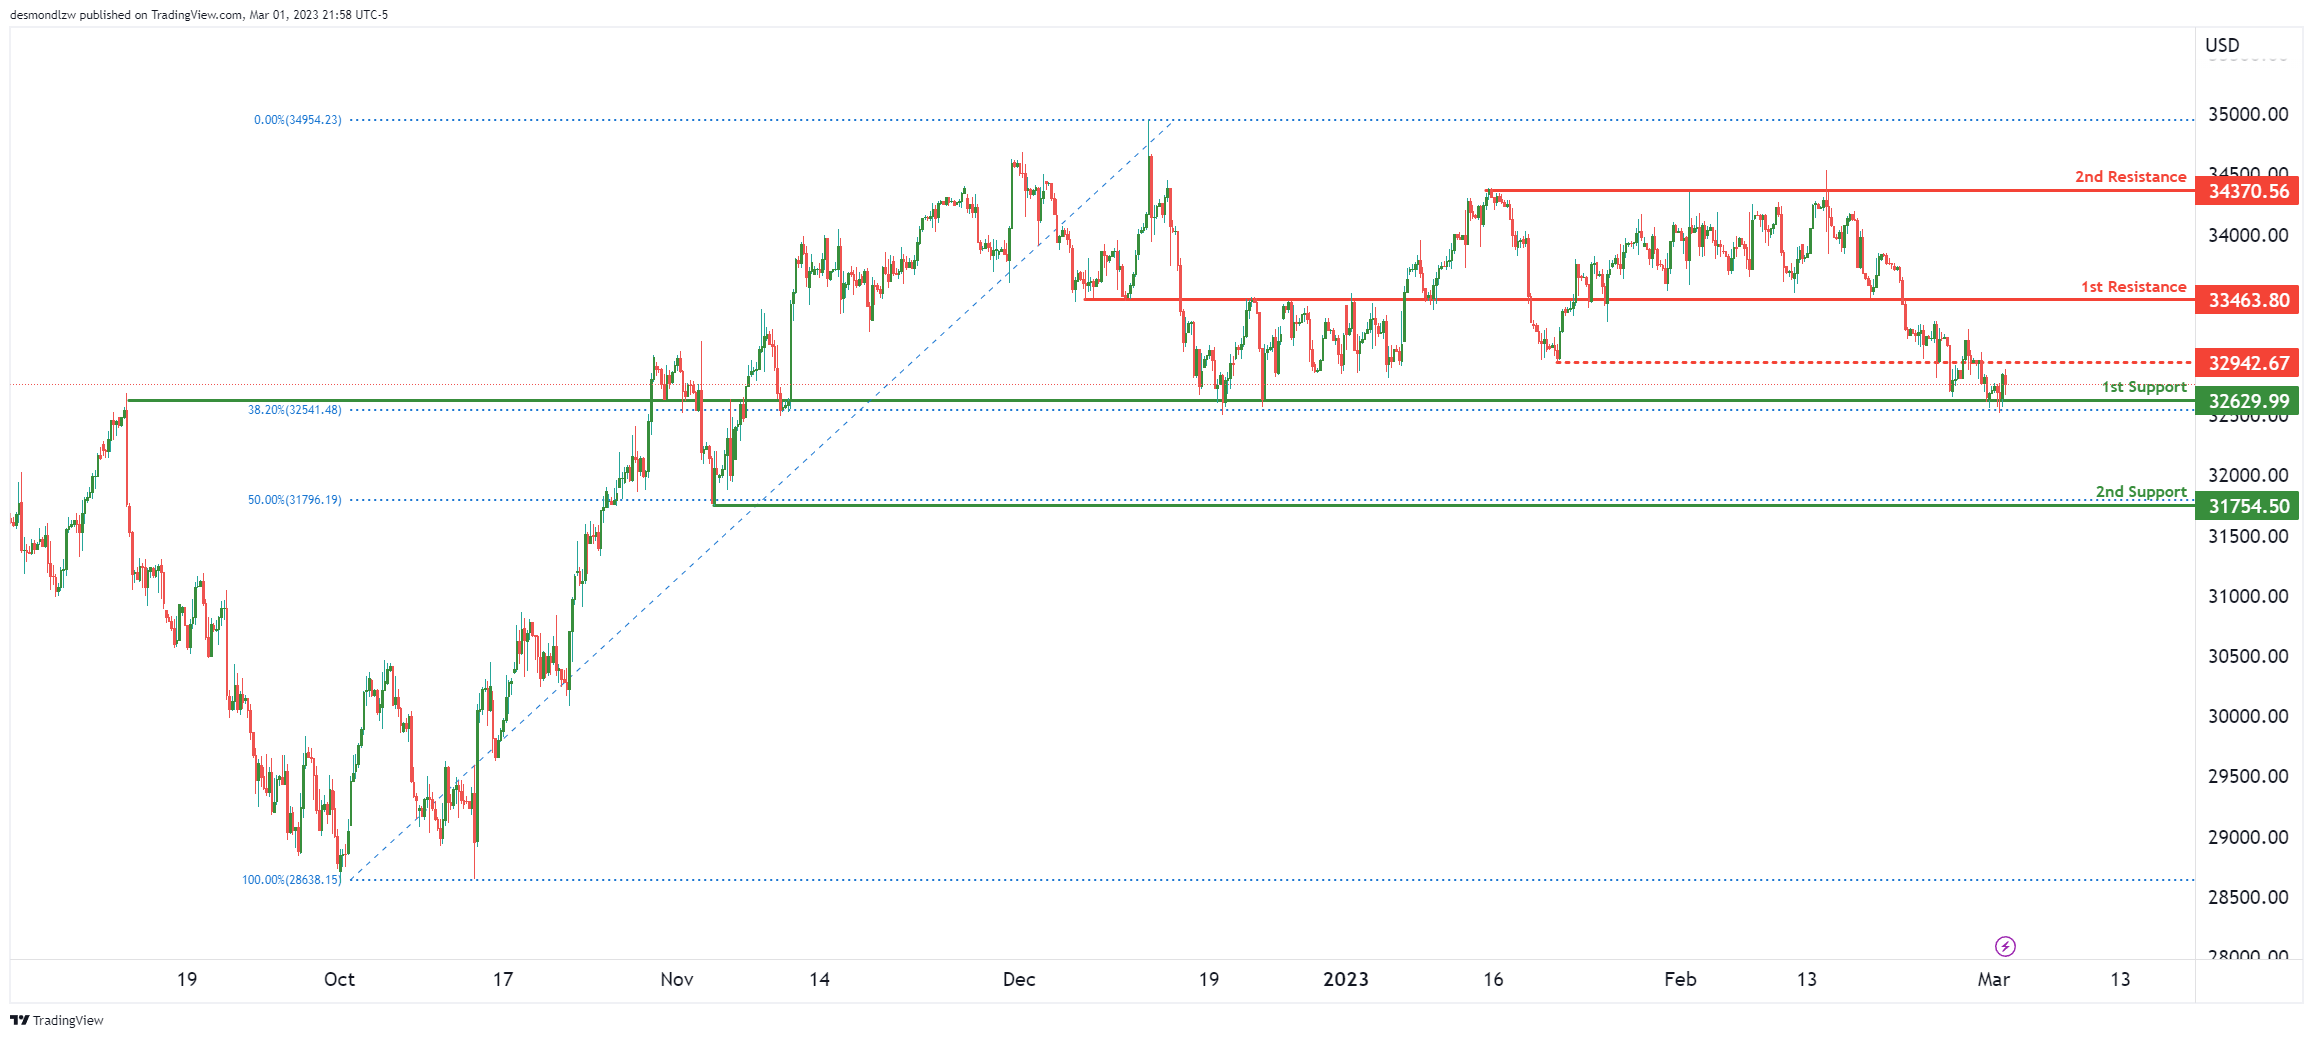
DJ30:
Price is testing our 1st support at 32629 that happens to be an overlap support and a major 38.2% Fibonacci retracement. If price were to bounce from here, it first needs to celar the intermediate resistance at 32942 which is a pullback resistance before it can make a further push up to 1st resistance at 33463 that is a overlap resistance.
Were prices to break the 1st support, the next key level to watch out for is the 2nd support at 31754 which is a smaller swing low support that lines up with the 50% Fibonacci retracement.
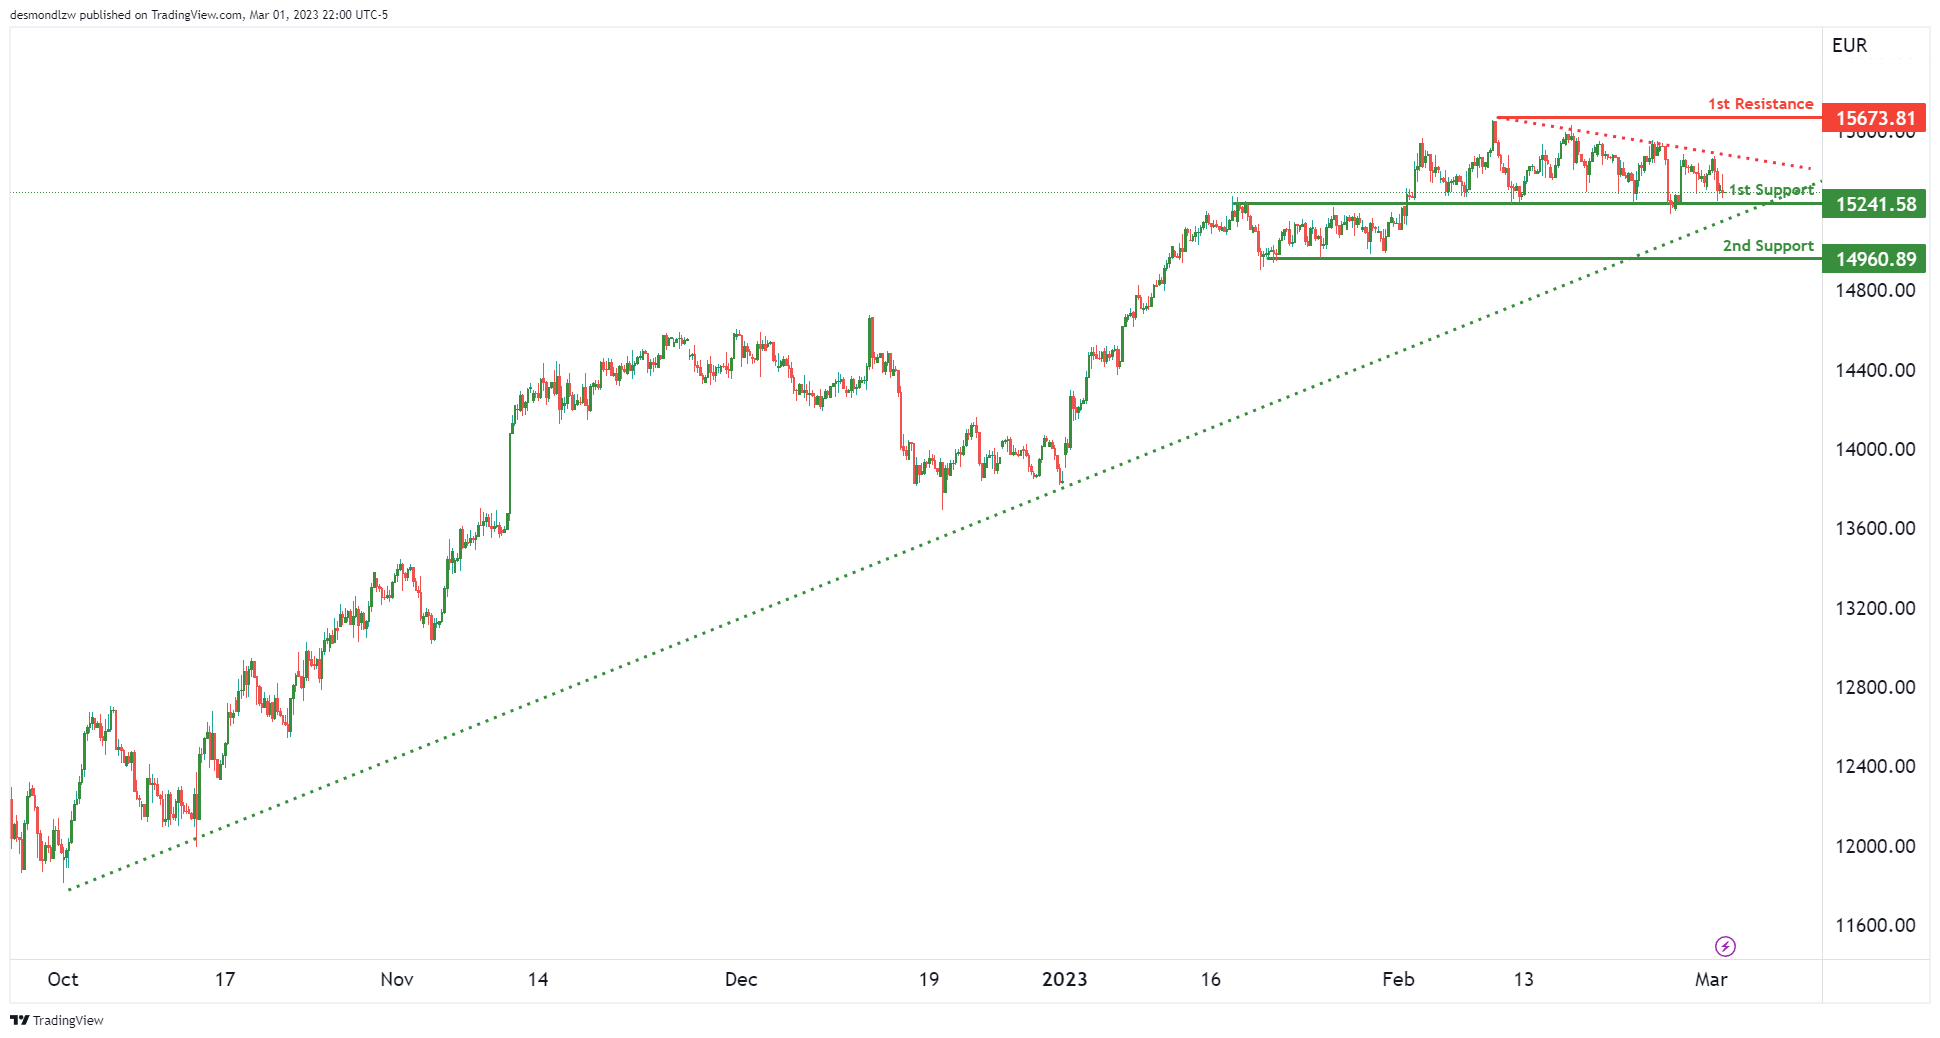
DAX:
We can see a long term ascending support line and a short term descending resistance line squeeze prices. The 1st support is at 15241 which is an overlap support. If prices were to break this level along with the ascending support line, we could see a drop down to 2nd support at 14960 which is a recent swing low support.
However, if prices were to bounce from here and break the descending resistance line, the next key resistance to watch out for is 15673 which is the most recent swing high resistance.
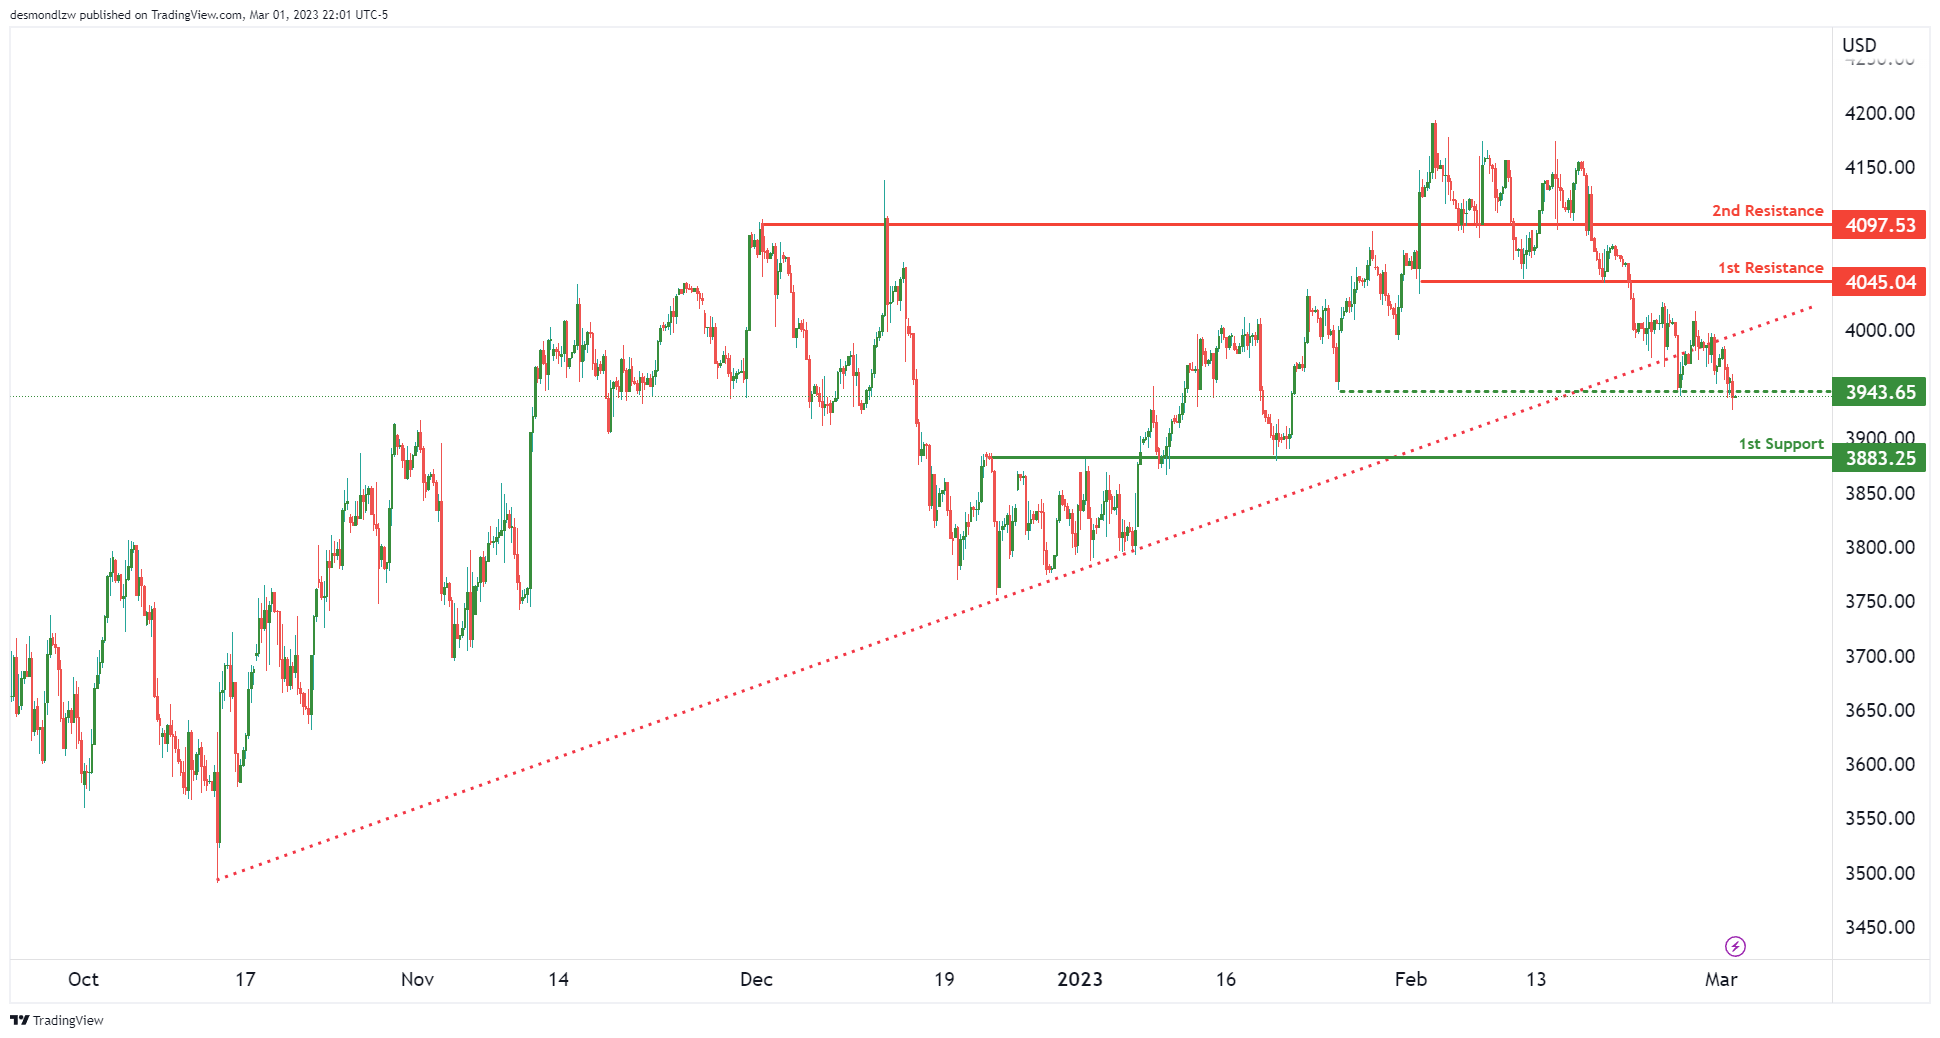
S&P500:
Price has recently broken an ascending support-turned-resistance line and is testing an intermediate support at 3943. If price were to break this intermediate support, we could see a push down to 1st support at 3883 which is a strong overlap support.
However, if prices were to bounce from here and rally upwards, the 1st resistance to watch out for is 4045 which is a pullback resistance. Breaking that, the next key resistance would be at 4097 which is an overlap resistance.
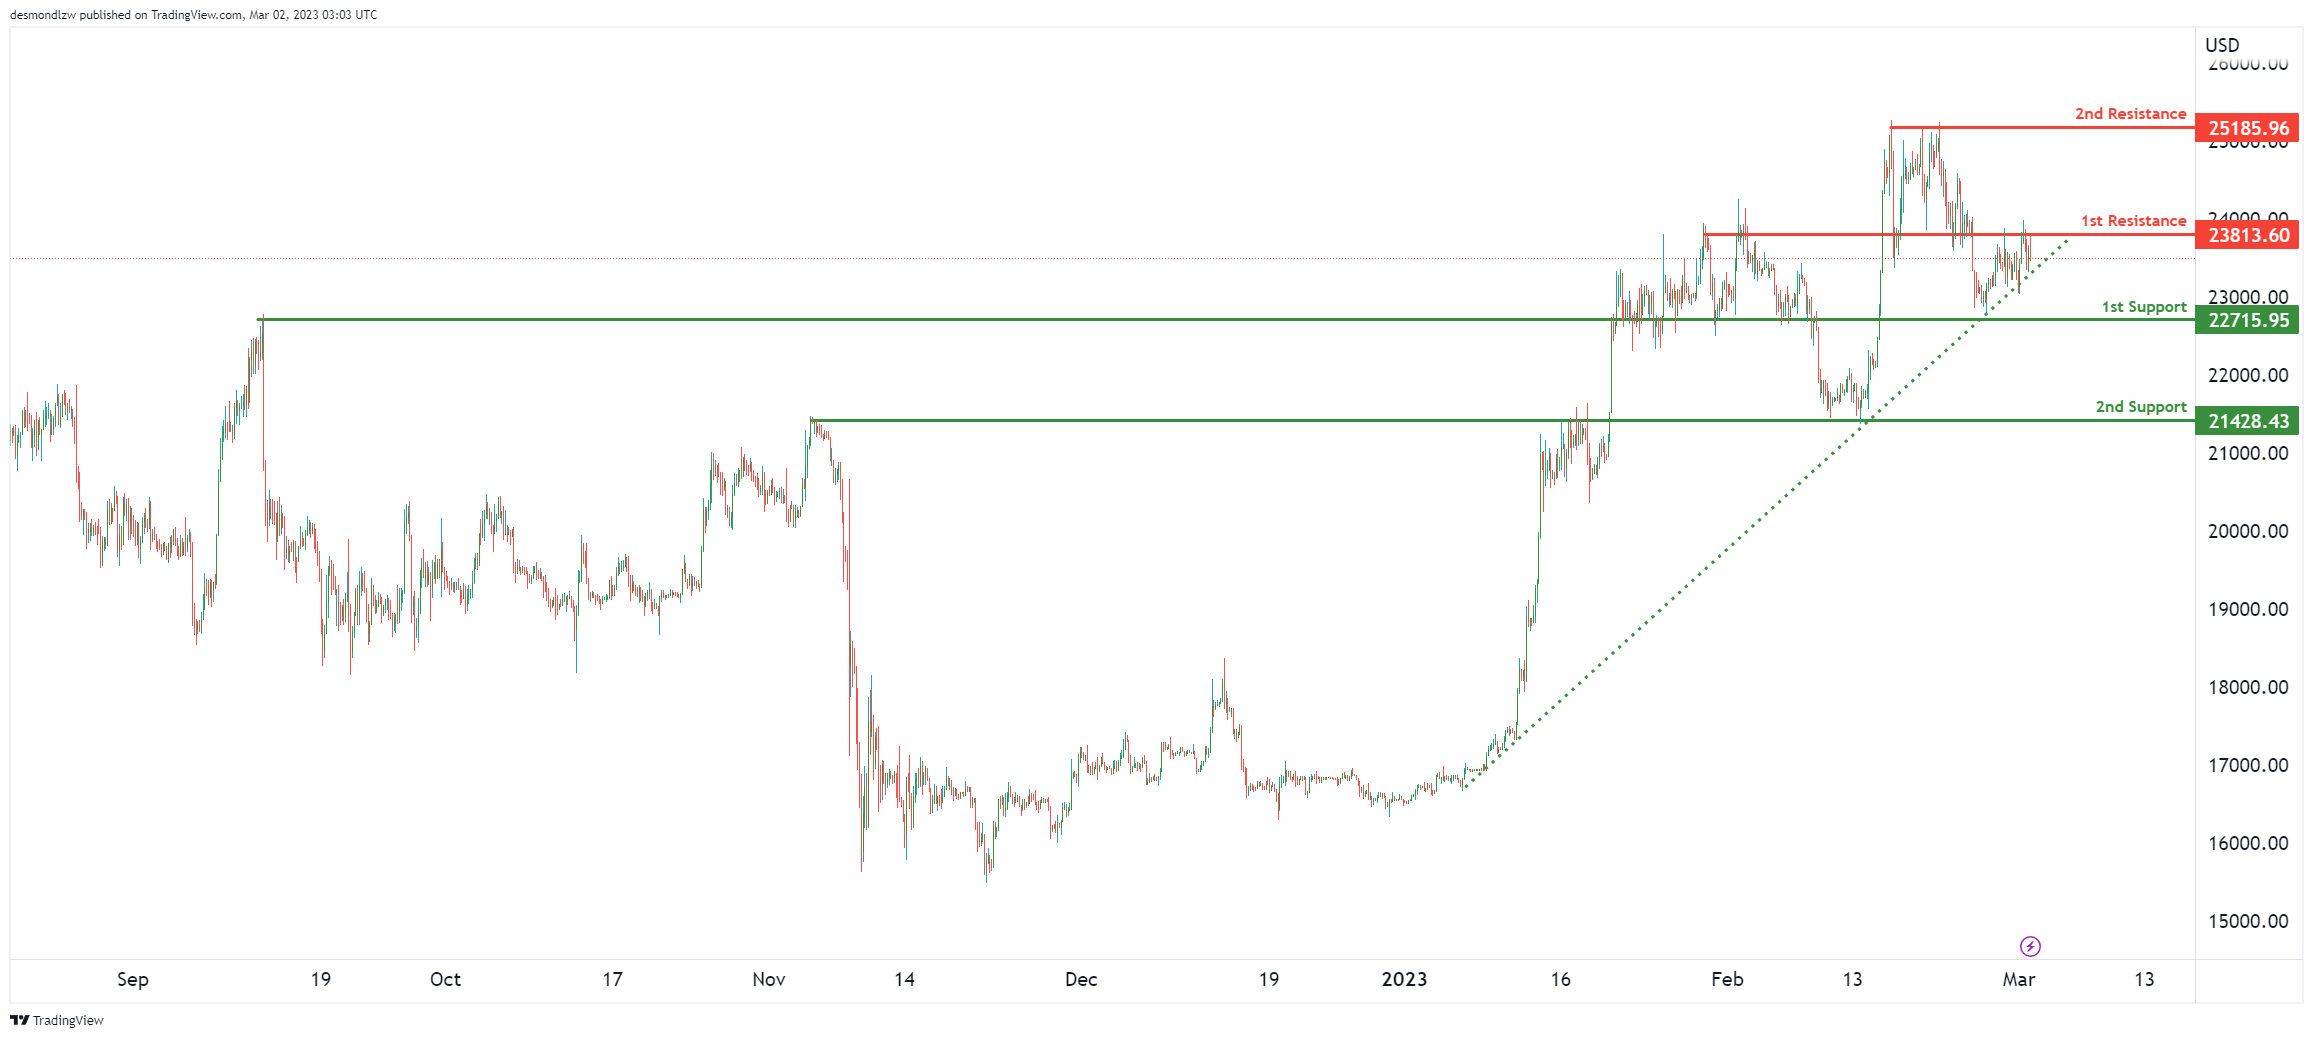
BTC/USD:
Price is seeing an ascending support line squeeze prices against the 1st resistance at 23813 which is an overlap resistance. If prices were to break past the 1st resistance, we could see a rally up to recent swing high resistance at 25185.
However, if prices were to break the ascending support line, we could see a drop to 1st support at 22715 which is a long-term overlap support.
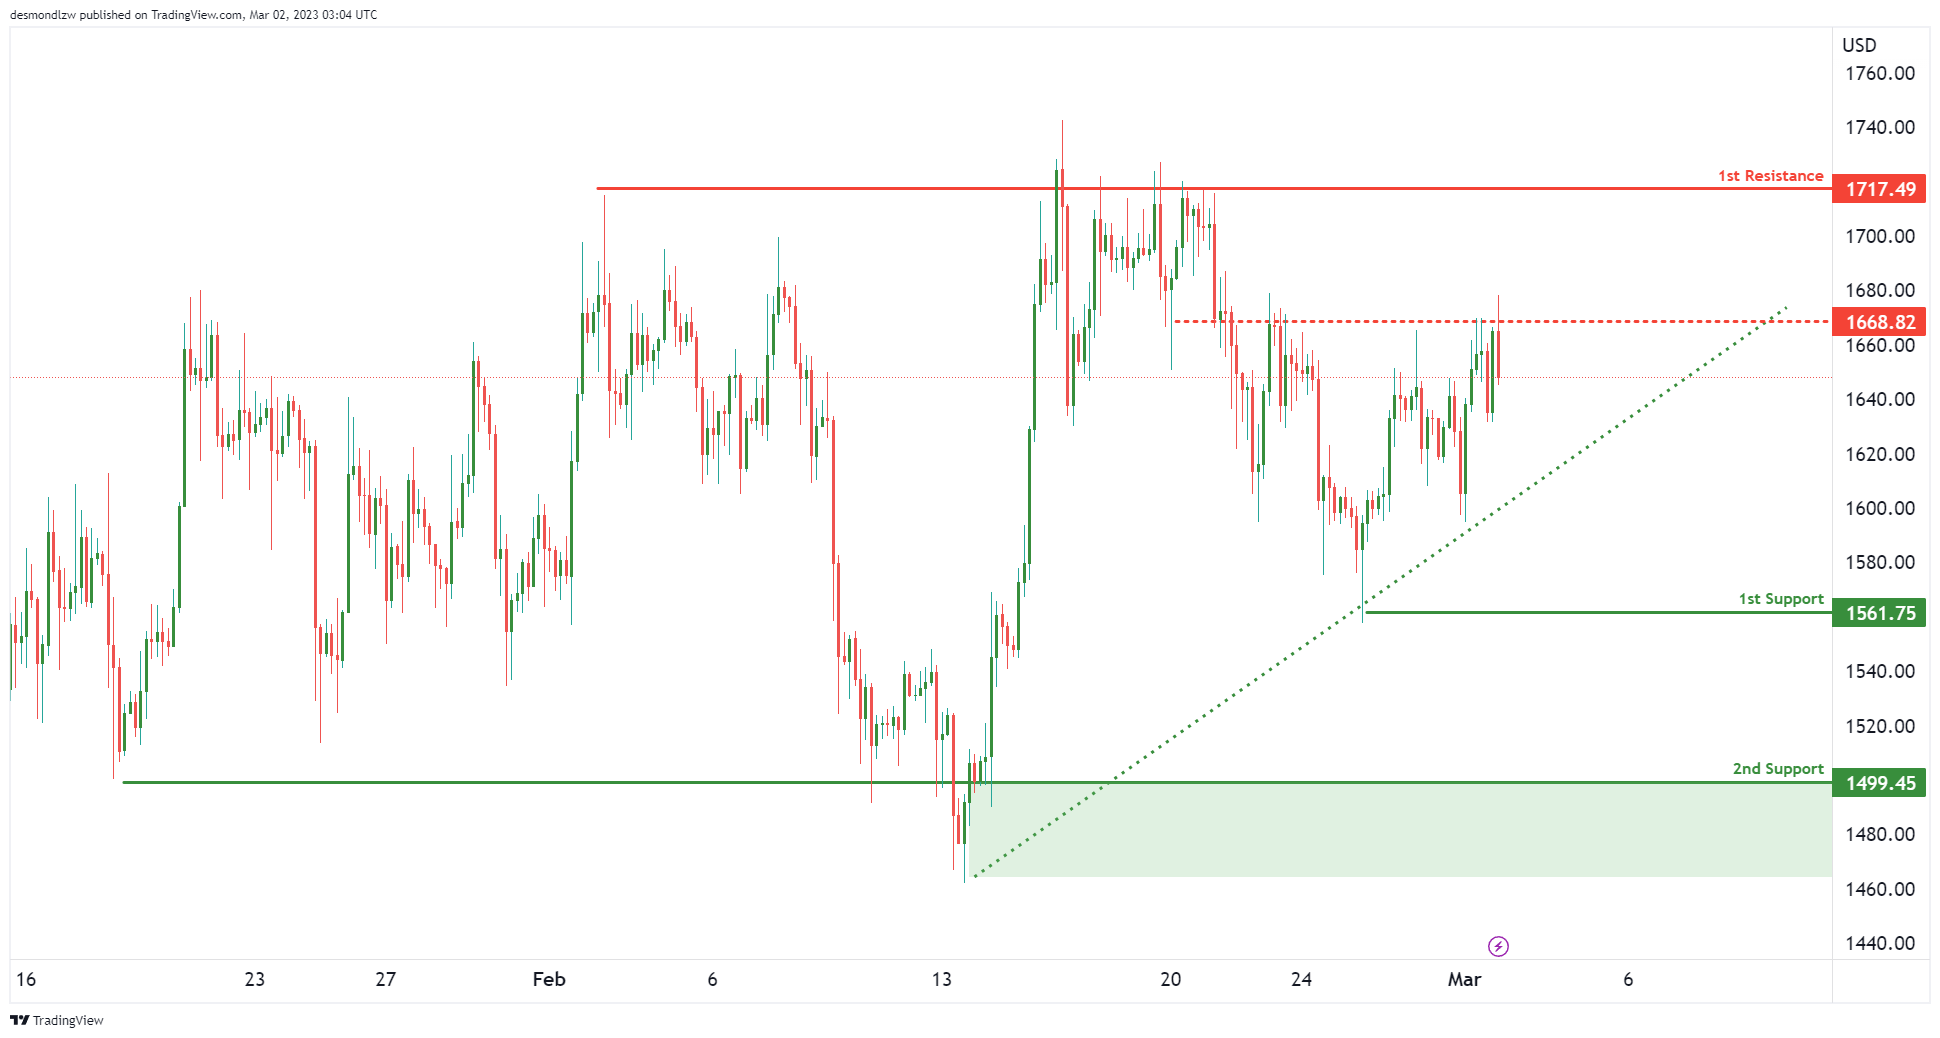
ETH/USD:
Price is testing an intermediate overlap resistance at 1668 and at the same time, is being pushed up by our ascending support trend line. If prices were to break the intermediate resistance, we could see a bigger push up to 1st resistance at 1717.
However, if prices were to break the ascending support line, we could see a drop to 1561 which is our 1st support that coincides with the swing low support.
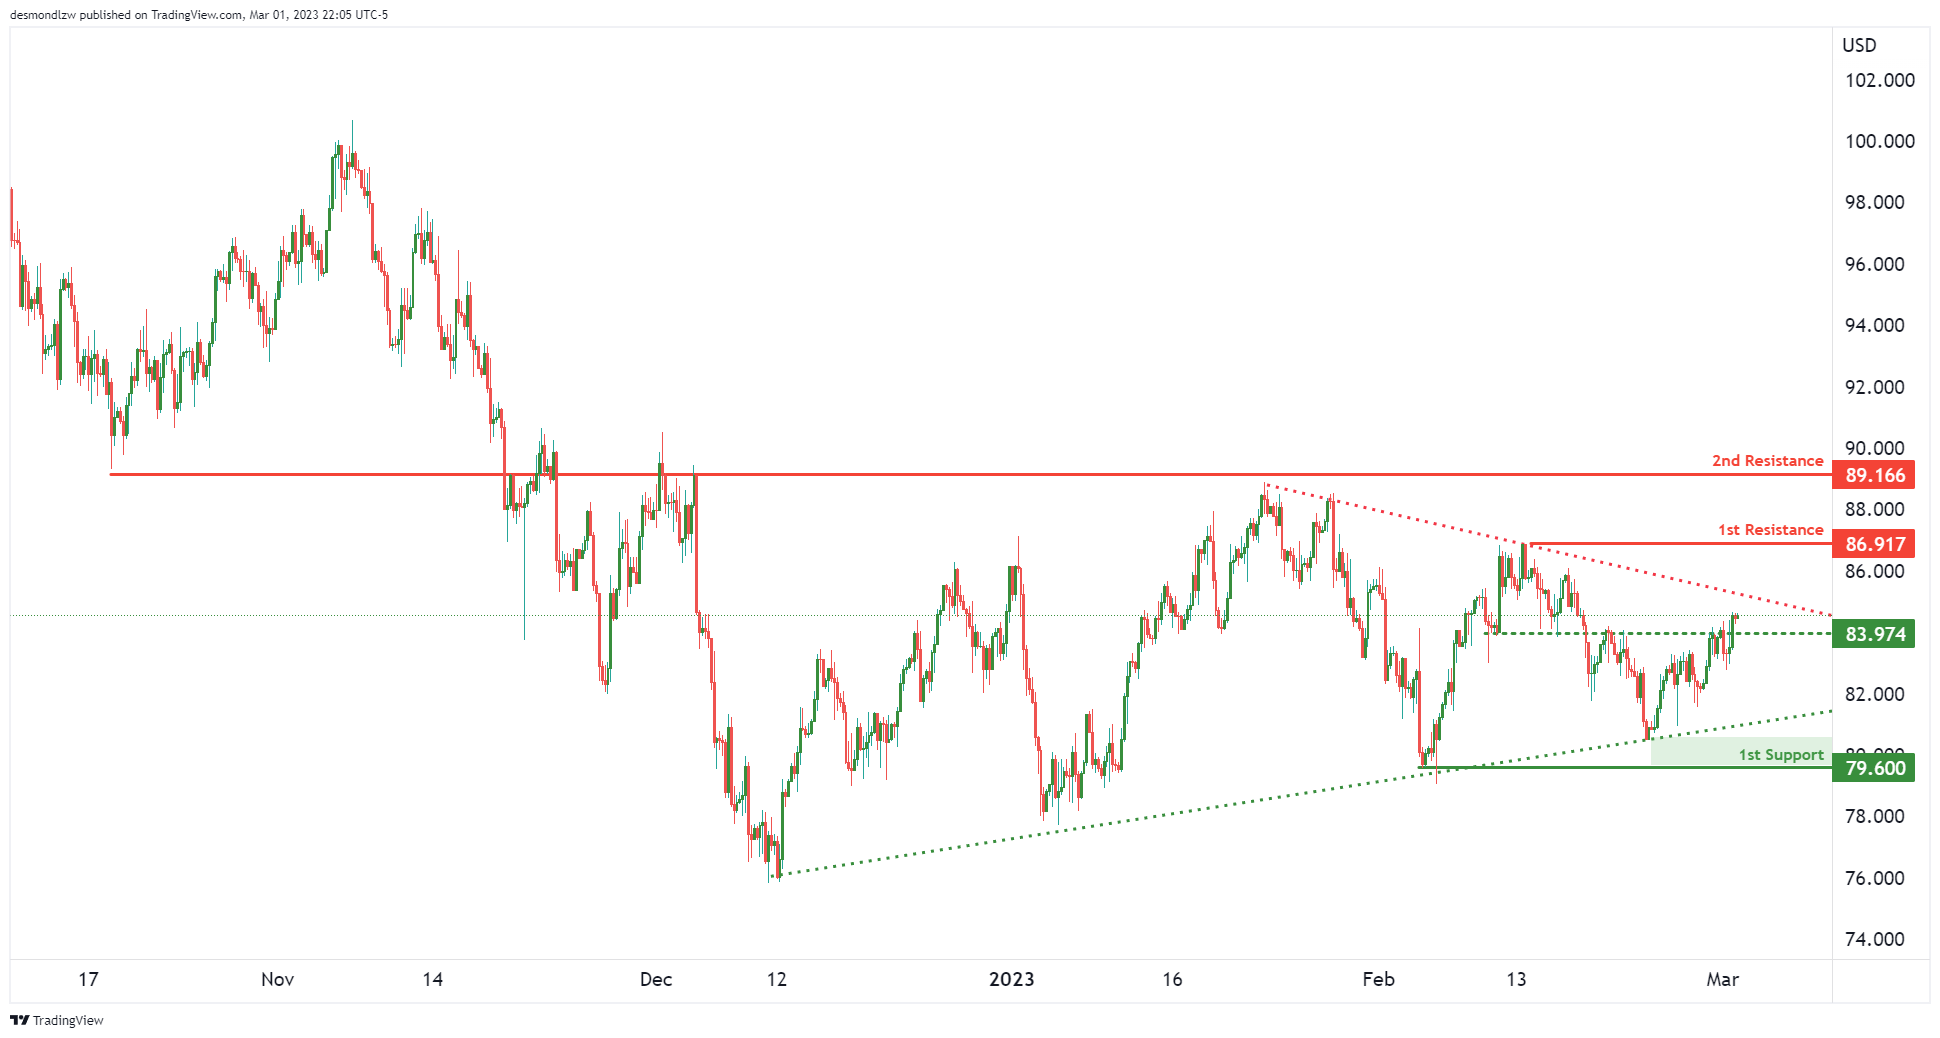
BCO/USD:
We’re seeing a long term ascending support line and a descending resistance line squeeze prices together. There is an intermediate support at 83.97 which is pushing prices up against the descending resistance line. If prices were to break that descending resistance line, we could see a bigger push up to 86.81 which is our 1st swing high resistance. Breaking that level, a bigger push up to 89.16 is possible which is a big overlap resistance.
However, if prices were to react off the descending resistance and make a push down, the 1st support is at 79.60 which is a recent swing low support.
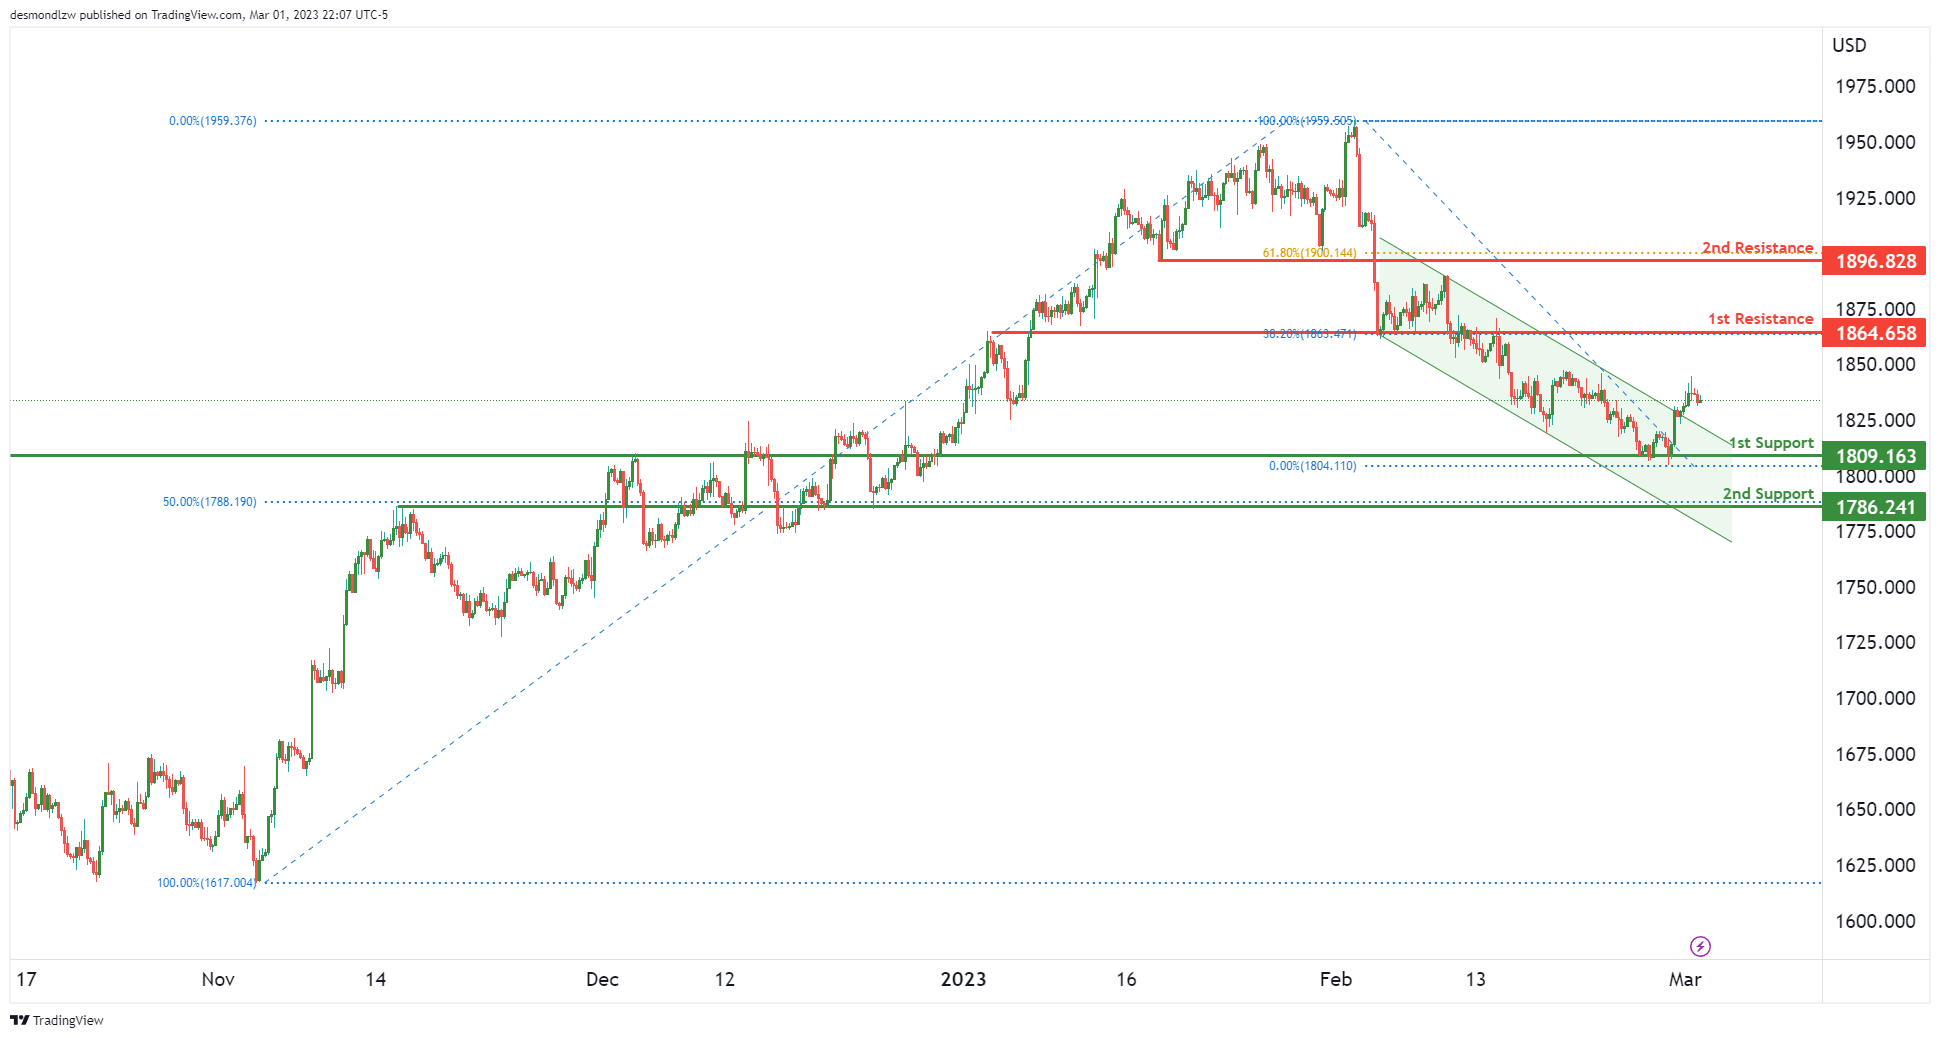
XAU/USD (GOLD):
Price has broken out of a recent bearish channel suggesting a bullish move might be on the cards. We’re seeing the 1st resistance at 1864 which is an overlap resistance that lines up with the 38.2% Fibonacci retracement. If prices were to break that level, the next key resistance is at 1896 which ia a pullback resistance lining up with the 61.8% Fibonacci retracement.
In terms of support, we have an overlap support at 1809 and a further 2nd support at 1786 which lines up nicely with our 50% Fibonacci retracement.


