
DXY:
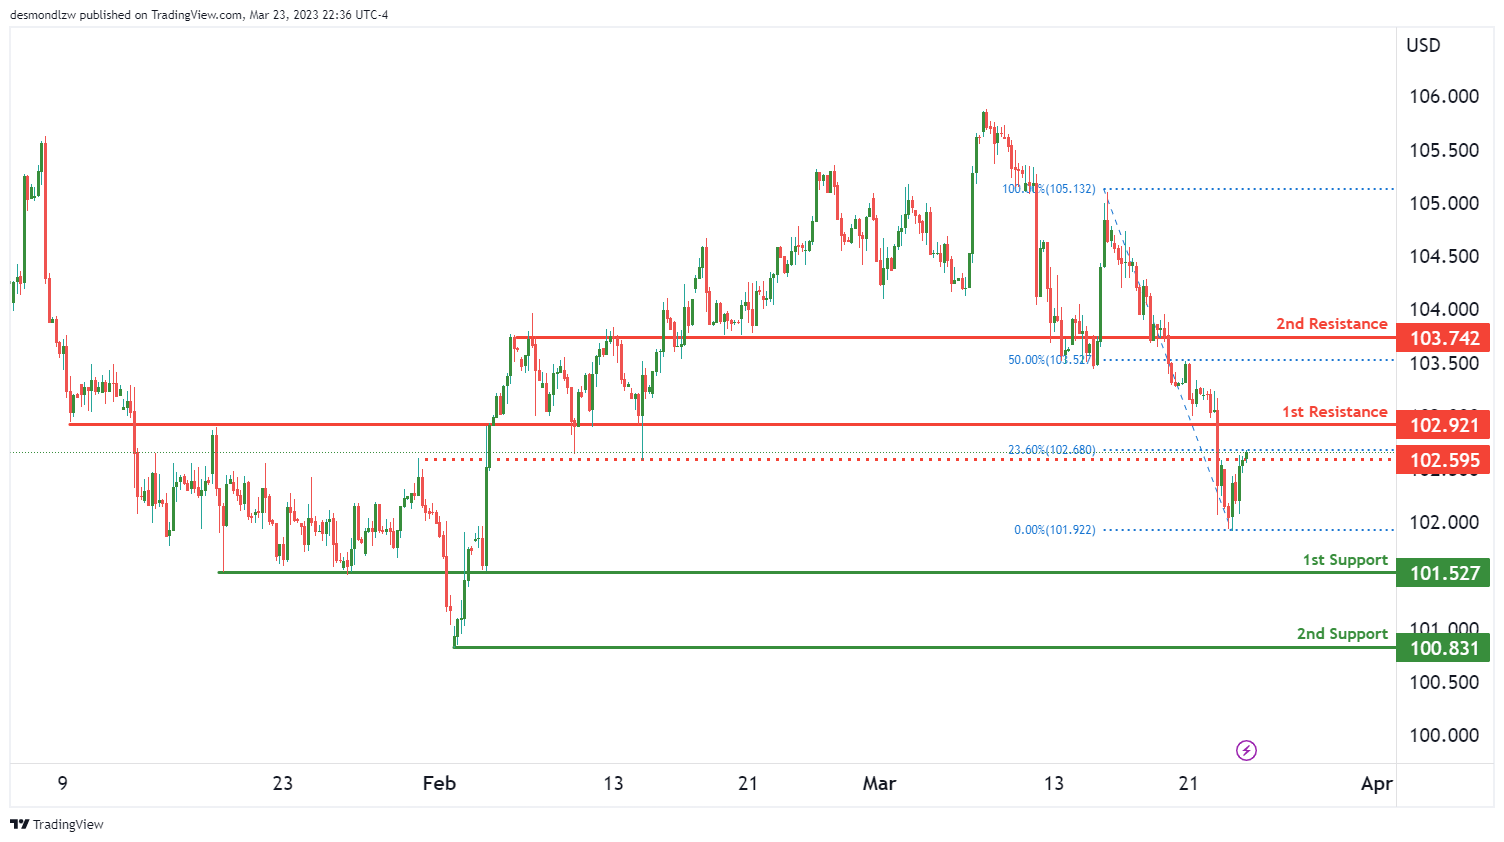
Based on the analysis of the DXY chart, the overall momentum of the chart is currently bullish. In the short term, price could potentially continue its bullish trend towards the 1st resistance level at 102.92.
The 1st support level at 101.52 is a good level of support as it is an overlap support. Additionally, the 2nd support level at 100.83 is a swing low support, making it another good level of support.
On the resistance side, the 1st resistance level at 102.92 is also an overlap resistance, making it a significant level of resistance. There is also an intermediate resistance level at 103.74, which is an overlap resistance and coincides with a 50% Fibonacci retracement level. Another intermediate resistance level can be found at 102.59.
It’s worth noting that the overall momentum of the chart is bullish, suggesting potential for prices to continue rising towards the 1st resistance level. If price were to drop below the 1st support level, the next support level would be the 2nd support at 100.83.
EUR/USD:
Looking at the EUR/USD chart, the overall momentum is currently bearish, indicating that prices may continue to drop in the near term. There is a potential for a bearish continuation towards the 1st support level at 1.0768.
The 1st support level is a strong level of support as it is an overlap support and coincides with a 38.20% Fibonacci retracement level. The 2nd support level at 1.0694 is also an overlap support, making it another strong level of support.
On the resistance side, the 1st resistance level at 1.0925 is an overlap resistance and coincides with a 78.60% Fibonacci retracement level. Additionally, there is an intermediate resistance level at 1.1027, which is a swing high resistance level.

GBP/USD:
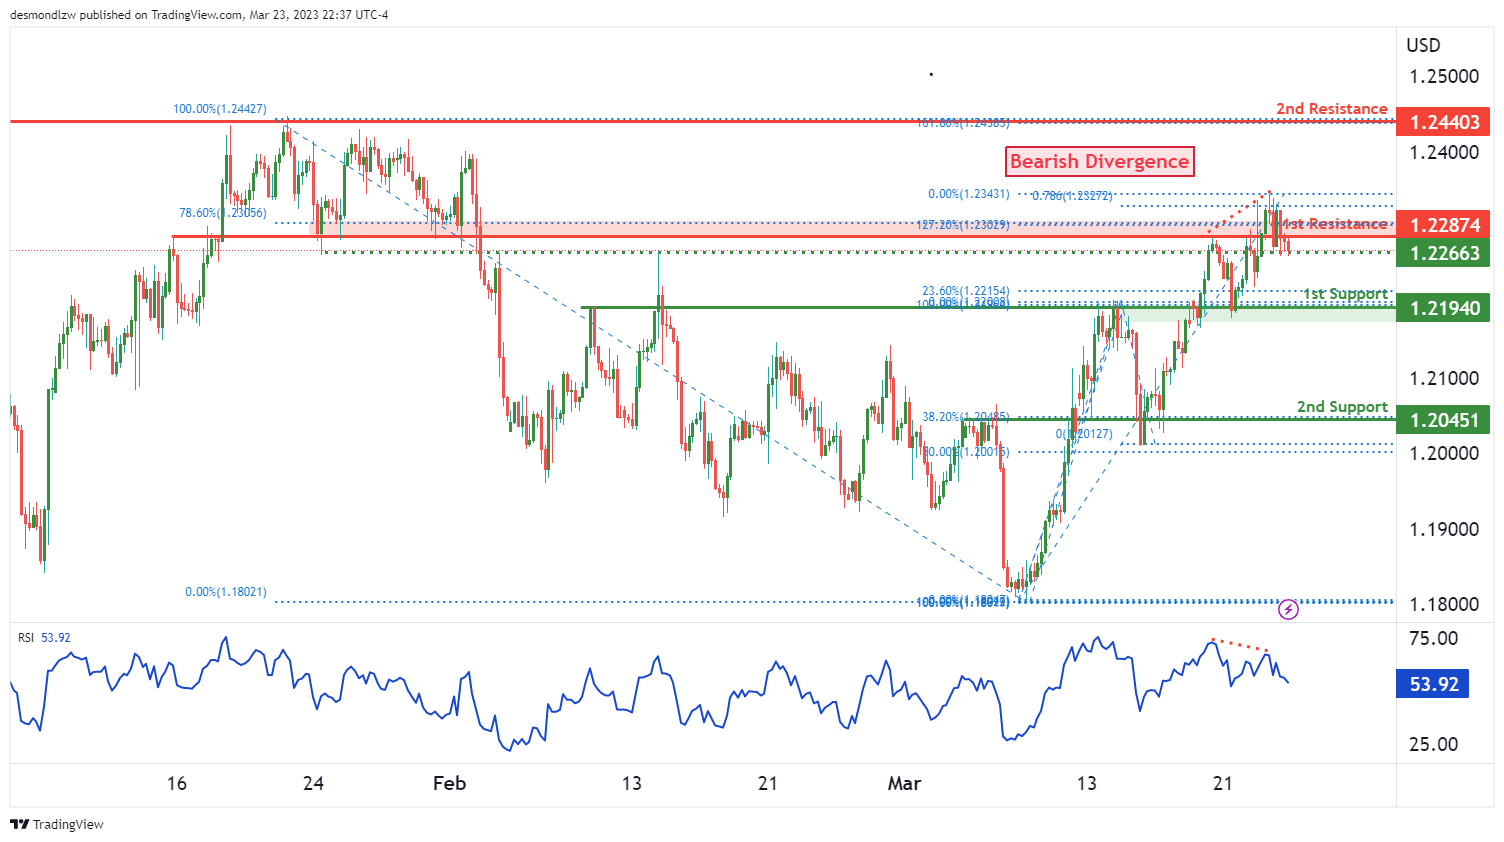
The GBP/USD chart currently shows a strong bearish momentum with high confidence. There is a potential for a bearish continuation towards the 1st support at 1.2194, which is a strong overlap support level and has a 23.60% Fibonacci retracement lining up with it. Additionally, the 2nd support at 1.2045 is another good level of support, being an overlap support level and also coinciding with a 38.20% Fibonacci retracement.
On the resistance side, the 1st resistance level at 1.0925 is an overlap resistance and also happens to be at a 127% Fibonacci extension. There is also an intermediate resistance level at 1.2440, which is a swing high resistance and a 161.80% Fibonacci extension.
It’s worth noting that the RSI is displaying bearish divergence versus price, suggesting that a reversal might occur soon. This adds to the bearish bias of the chart and supports the potential for a bearish continuation towards the 1st support level.
USD/CHF:
The USD/CHF chart is showing bullish momentum with potential for further upward movement. The current price is testing the pivot point at 0.9136, which is an overlap support level and also has a 78.60% Fibonacci retracement lining up with it. If the price were to reverse, it could drop to the 1st support level at 0.9071, a multi-swing low support level.
On the resistance side, the 1st resistance level is at 0.9240, which is an overlap resistance level and coincides with a 50% Fibonacci retracement. There is also an intermediate resistance level at 0.9300, which is another overlap resistance level. A further intermediate resistance level is located at 0.9207, which is between the current price and the 1st resistance level and has a 38.20% Fibonacci retracement.
Overall, the bias is bullish, with the potential for a bullish continuation towards the 1st resistance level. If the price were to break above the pivot point, it could push to the 1st resistance level at 0.9240. However, if the price were to break below the pivot point, it could drop to the 1st support level at 0.9071.

USD/JPY:
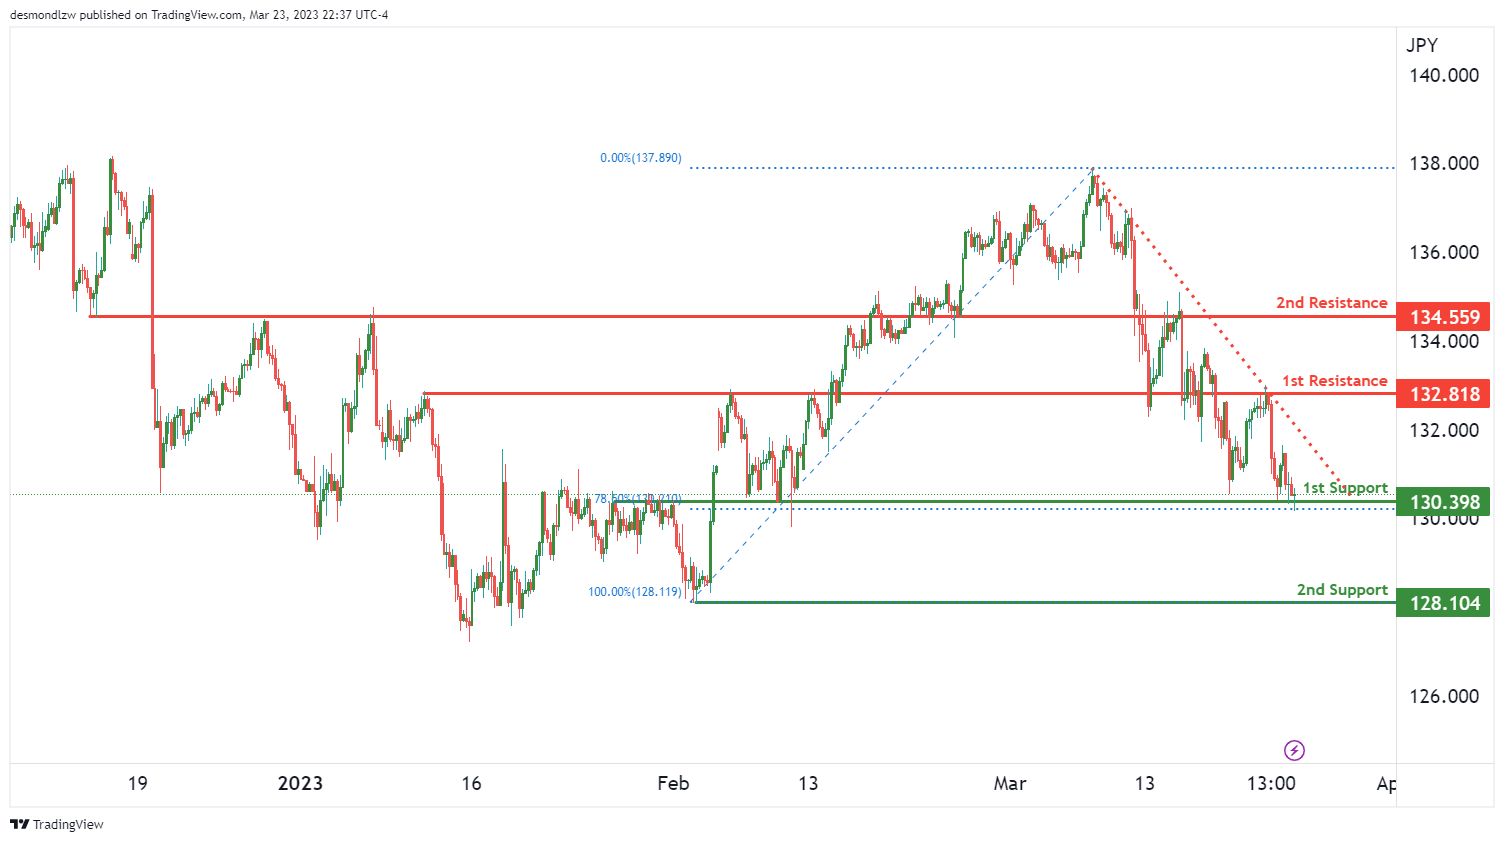
USD/JPY has a weak momentum with low confidence. The factors contributing to the momentum is that the price is below a major descending trend line, suggesting that bearish momentum is on the cards.
If price were to break off from the 1st support at 130.39, it could potentially drop towards the 2nd support at 128.10. The 1st support level is a good level as it is an overlap support with a 78.60% Fibonacci retracement lining up with it. Meanwhile, the 2nd support level is a multi-swing low support level.
On the resistance side, the 1st resistance level is at 132.81, which is an overlap resistance. There is also an intermediate resistance level at 134.55, which is another overlap resistance.
As the overall momentum is weak with low confidence, it’s difficult to predict whether the price will break above or below these levels. We’ll have to keep a close eye on how the price behaves around these levels to make an informed decision.
In conclusion, USD/JPY has a weak momentum with low confidence. While the 1st support and 1st resistance levels provide good opportunities for traders to enter the market, the overall momentum makes it difficult to predict whether the price will break above or below these levels.

AUD/USD:
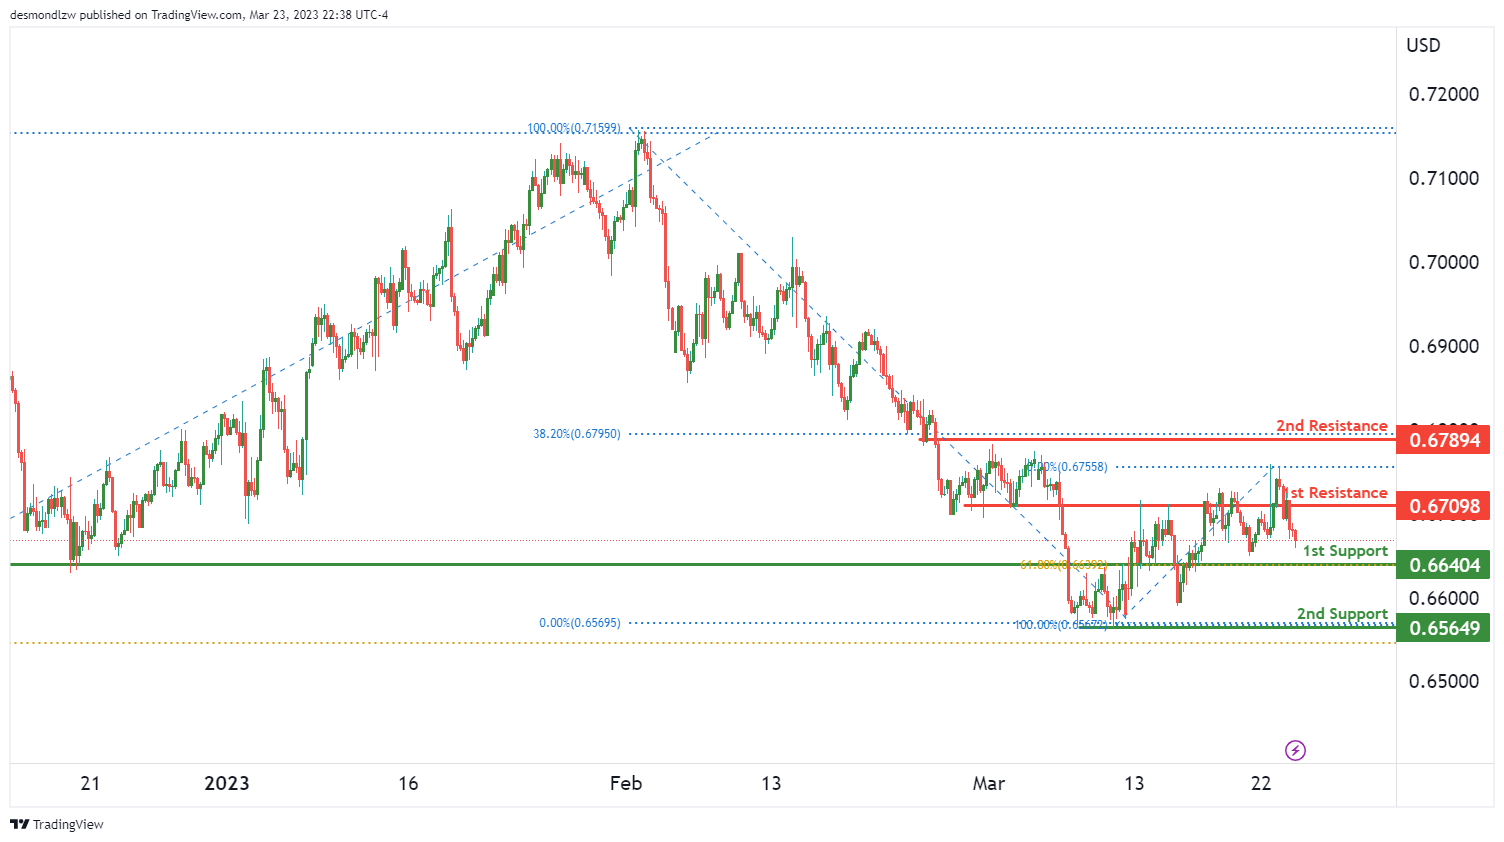
The AUD/USD chart is currently displaying a bearish momentum with potential for a continuation towards the 1st support level at 0.6640. This level is a strong overlap support and has a 61.80% Fibonacci retracement lining up with it, making it a reliable support level. In addition, there is a multi-swing low support at 0.6564, which could serve as a second support level if price were to break through the 1st support.
On the resistance side, the 1st resistance level is at 0.6709, which is also an overlap resistance level. The 2nd resistance level at 0.6789 coincides with a 38.20% Fibonacci retracement, making it a strong level of resistance.
It’s important to note that the overall momentum of the chart is bearish, indicating a potential for further downside. A break of the 1st support could trigger a drop towards the 2nd support level, while a break of the 1st resistance could lead to a rise towards the 2nd resistance level.
NZD/USD:
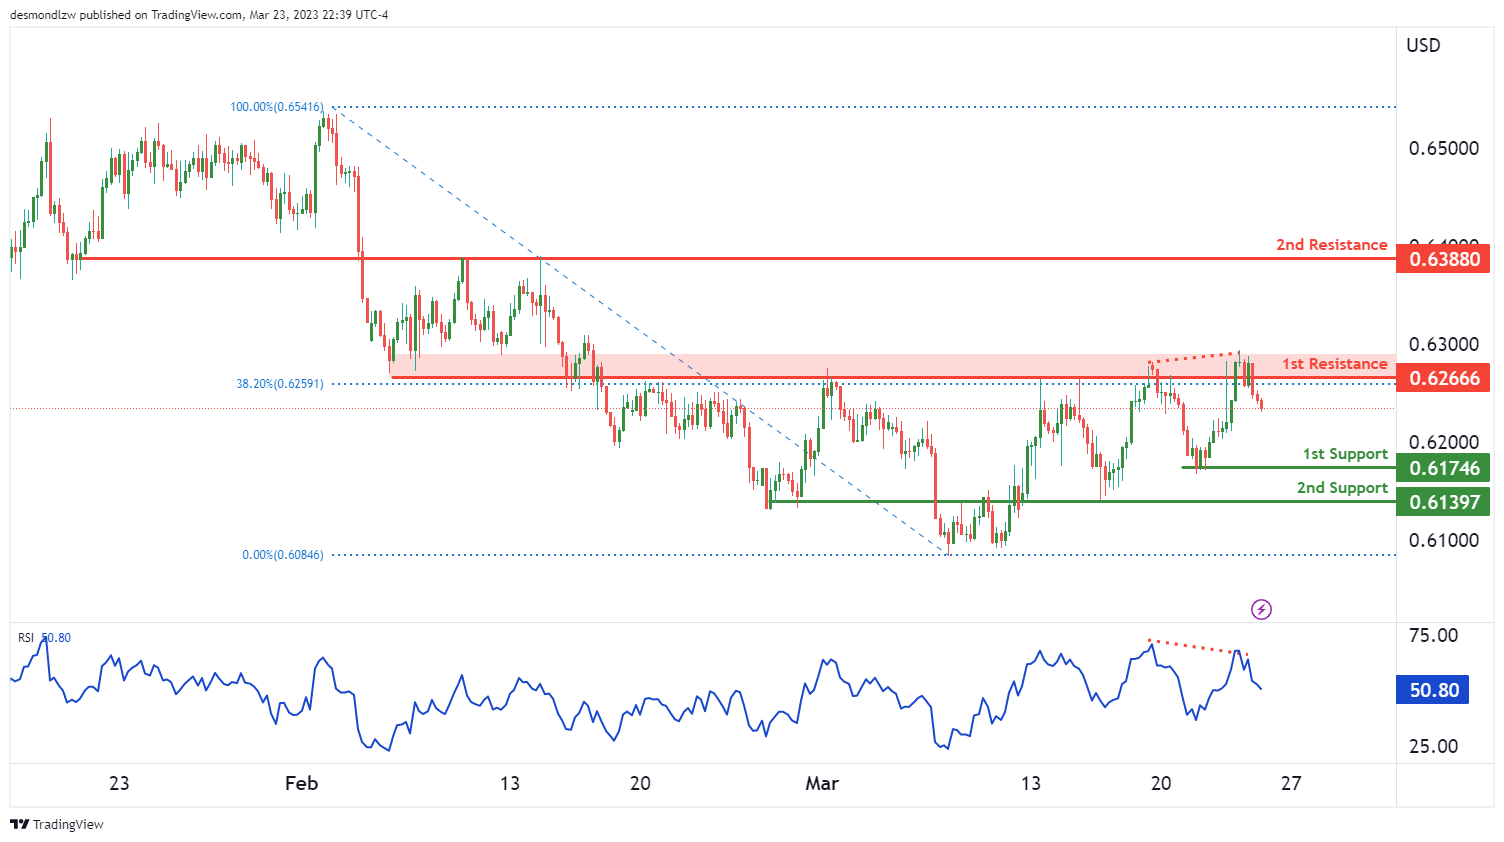
The NZD/USD chart is currently showing a bearish momentum. Price could potentially make a bearish continuation towards the first support level at 0.6174. This support level is a swing low support and could provide a strong level of buying interest. If price were to break through this level, it could drop further towards the second support level at 0.6139, which is an overlap support and has held prices up in the past.
On the resistance side, the first resistance level is at 0.6266. This level is an overlap resistance and has a 38.20% Fibonacci retracement lining up with it. If price were to rise from the current level, it could face selling pressure at this level. If price were to break through this resistance, it could potentially rise towards the second resistance level at 0.6388, which is also an overlap resistance level.
USD/CAD:
The USD/CAD chart is currently showing a bullish momentum, triggered by a break above a descending resistance line. Price could potentially make a bullish break through the first resistance level at 1.3743 and rise towards the second resistance level at 1.3815, which is an overlap resistance level.
On the support side, the first support level is at 1.3645. This level is an overlap support and has a 38.20% Fibonacci retracement lining up with it, which could provide a strong level of buying interest. If price were to break through this level, it could drop further towards the second support level at 1.3569, which is also an overlap support level and has held prices up in the past.
Overall, with the bullish momentum and the potential for a break through the first resistance level, it suggests that prices may continue to rise in the short term. However, it’s worth noting that the support and resistance levels are relatively close to each other
DJ30:
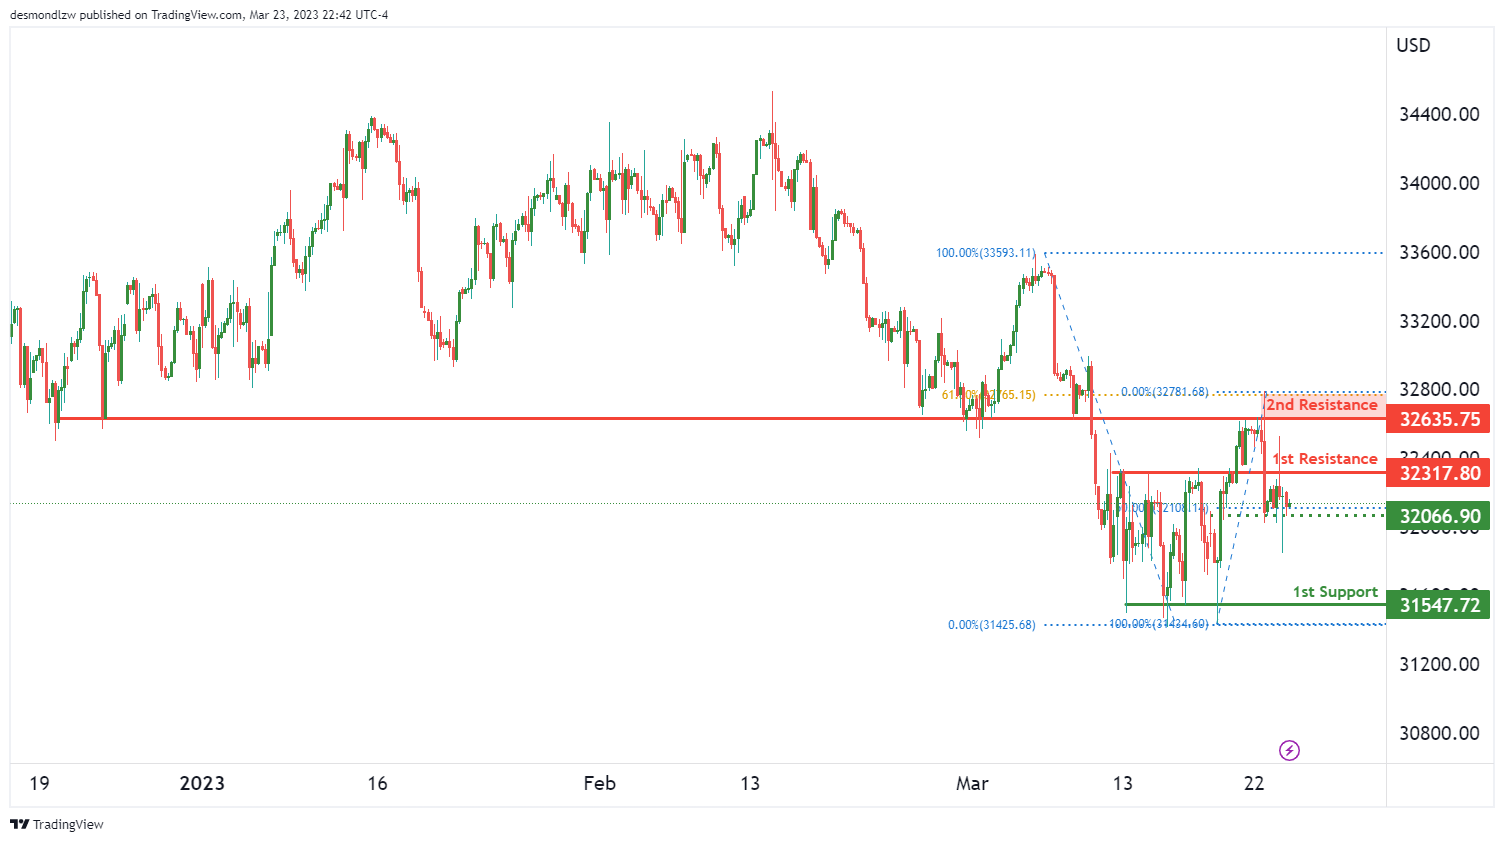
The DJ30 chart is currently showing a bearish momentum, but there is a possibility of a bullish continuation towards the first resistance level. The first support level is at 31547, which is a multi-swing low support level that has held prices up in the past. If the price were to bounce from this support level, it could potentially rise towards the intermediate support level at 32066, which is an overlap support level.
On the resistance side, the first resistance level is at 32317, which is an overlap resistance level that could provide a strong level of selling interest. If the price were to break through this resistance level, it could potentially rise towards the second resistance level at 32635, which is also an overlap resistance level and has a 61.80% Fibonacci retracement lining up with it.
GER30:
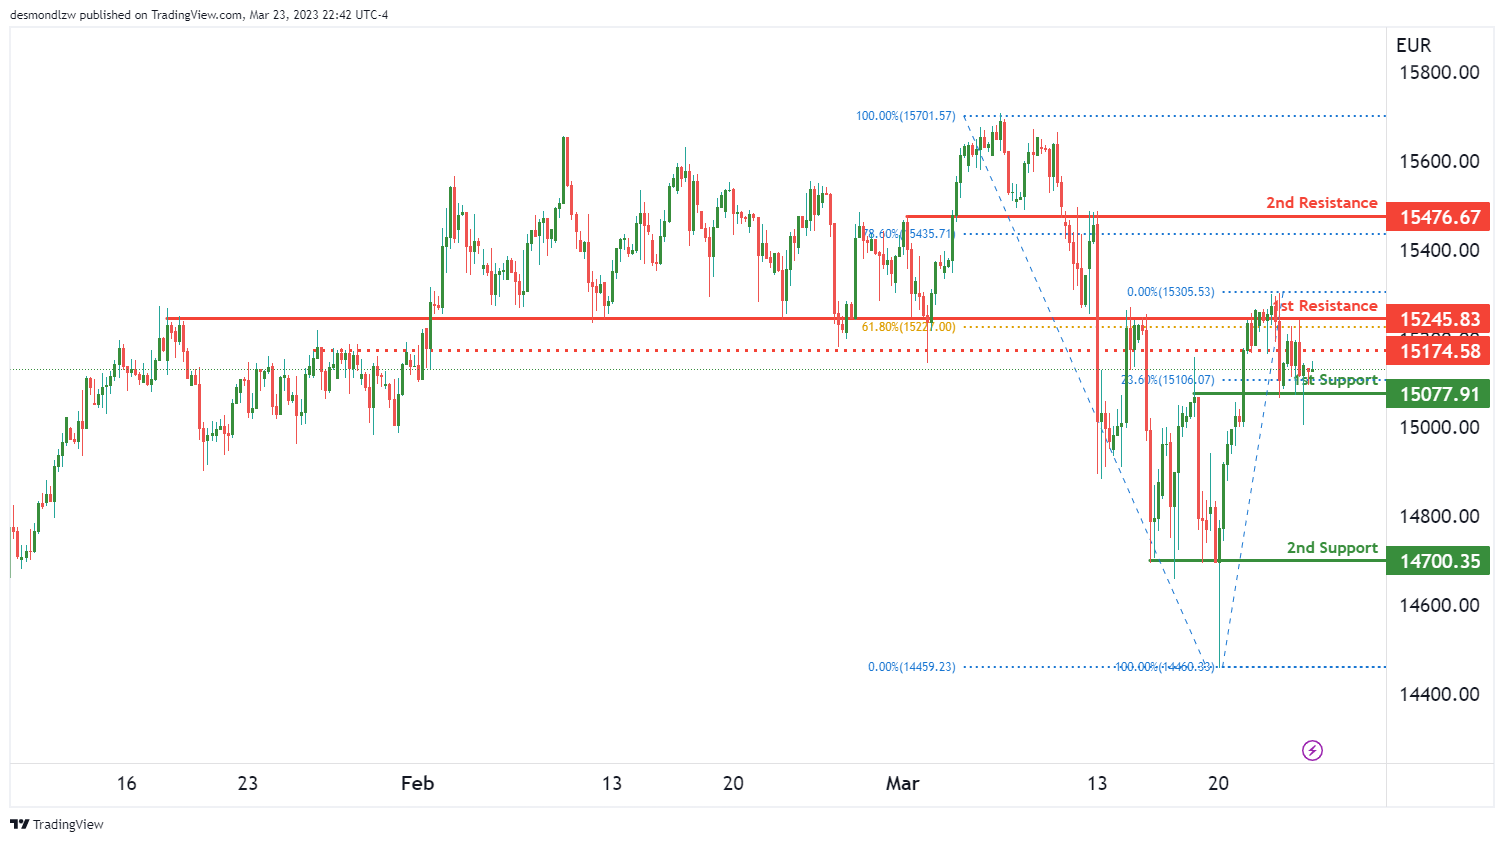
The GER30 chart is currently showing bearish momentum and price could potentially make a bearish break off the first support level at 15077 and drop towards the second support level at 14700, which is a multi-swing low support level that has held prices up in the past. The first support level is an overlap support and has a 23.60% Fibonacci retracement lining up with it.
On the resistance side, the first resistance level at 15245 is an overlap resistance level and has a 61.80% Fibonacci retracement lining up with it. If price were to rise from the current level, it could face selling pressure at this level. If price were to break through this resistance, it could potentially rise towards the second resistance level at 15476, which is also an overlap resistance level and has a 78.60% Fibonacci retracement lining up with it.
There is an intermediate resistance at 15174 between where price is currently and the first resistance level. This level could also act as a selling pressure zone if price were to rise towards it.
BTC/USD:
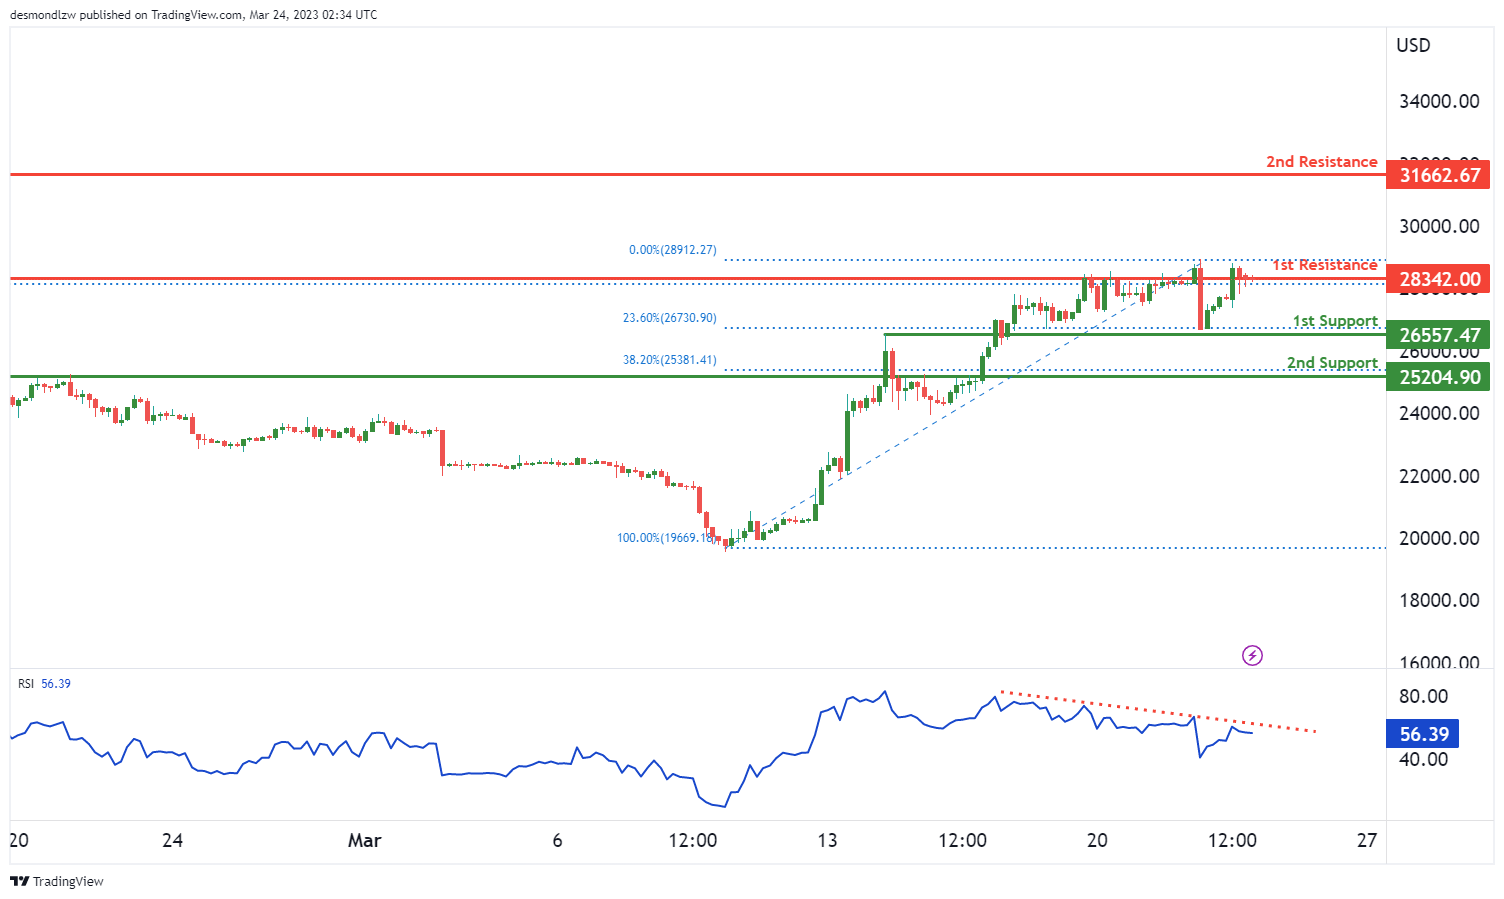
The BTC/USD chart is currently showing a bearish momentum, suggesting that prices may fall further. Price could potentially make a bearish reaction off the first resistance level at 28342 and drop towards the first support level at 26557. This support level is an overlap support and has a 23.60% Fibonacci retracement lining up with it, which could provide a strong level of buying interest. If the price were to break through this level, it could drop further towards the second support level at 25204, which is also an overlap support and has a 38.20% Fibonacci retracement lining up with it.
On the resistance side, the first resistance level is at 28342. This level is a multi-swing high resistance and could provide a strong level of selling pressure. If the price were to break through this resistance, it could potentially rise towards the second resistance level at 31662, which is a swing high resistance.
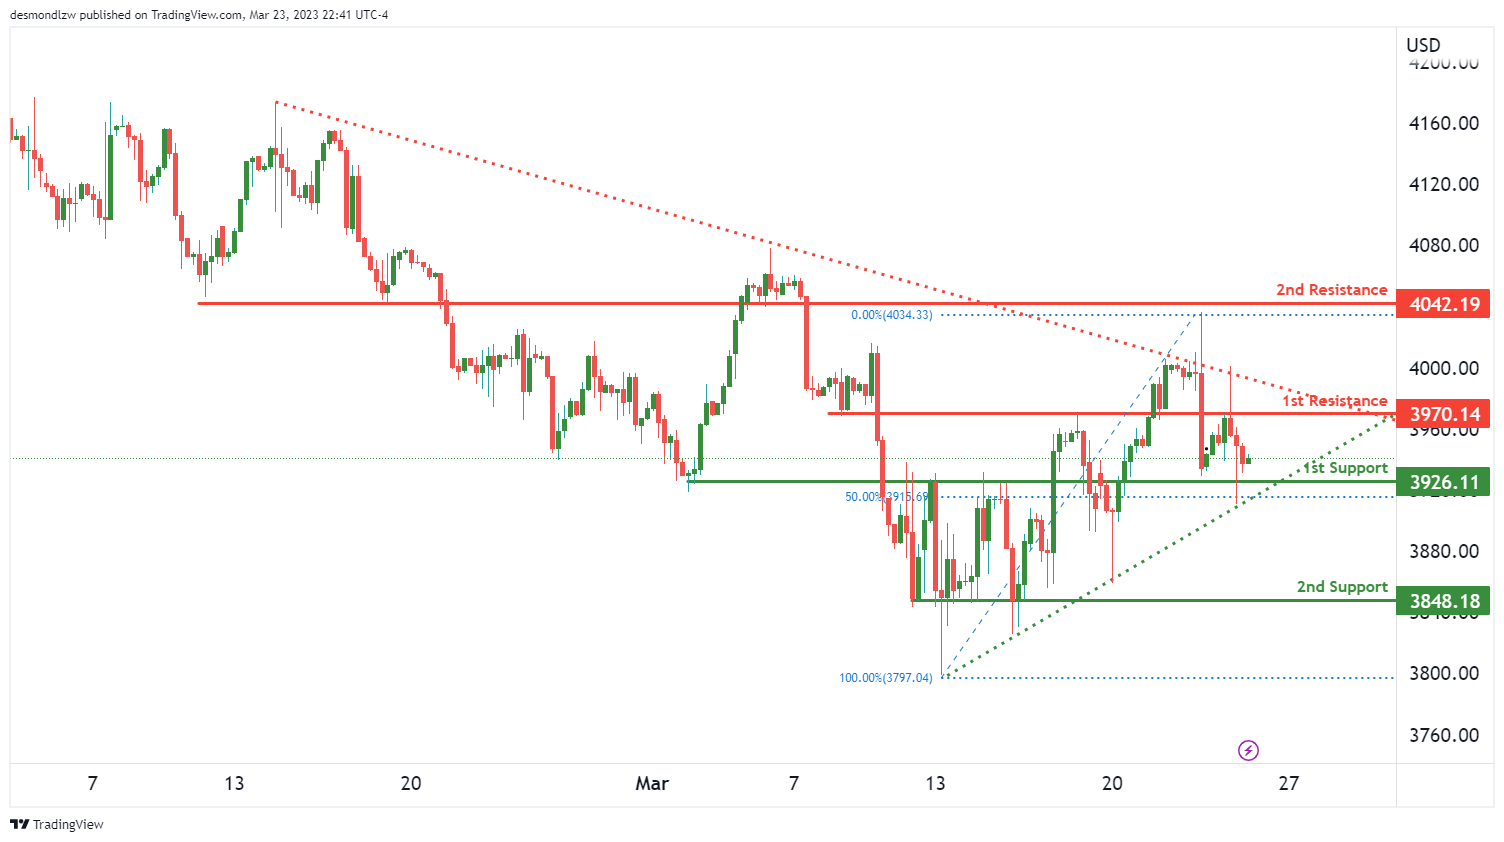
US500
The US500 chart is currently showing a neutral momentum as it is below a major descending trend line which suggests bearish momentum, while also being above a major ascending trend line indicating further bullish momentum. Price could potentially fluctuate between the first resistance level at 3970 and the first support level at 3926.
The first support level at 3926 is an overlap support and has a 50% Fibonacci retracement lining up with it, making it a strong level of buying interest. If price were to break through this level, it could potentially drop towards the second support level at 3848, which is a multi-swing low support and has held prices up in the past.
On the resistance side, the first resistance level at 3970 is an overlap resistance level. If price were to rise from the current level, it could potentially face selling pressure at this level. If price were to break through this resistance, it could potentially rise towards the second resistance level at 4042, which is also an overlap resistance level.
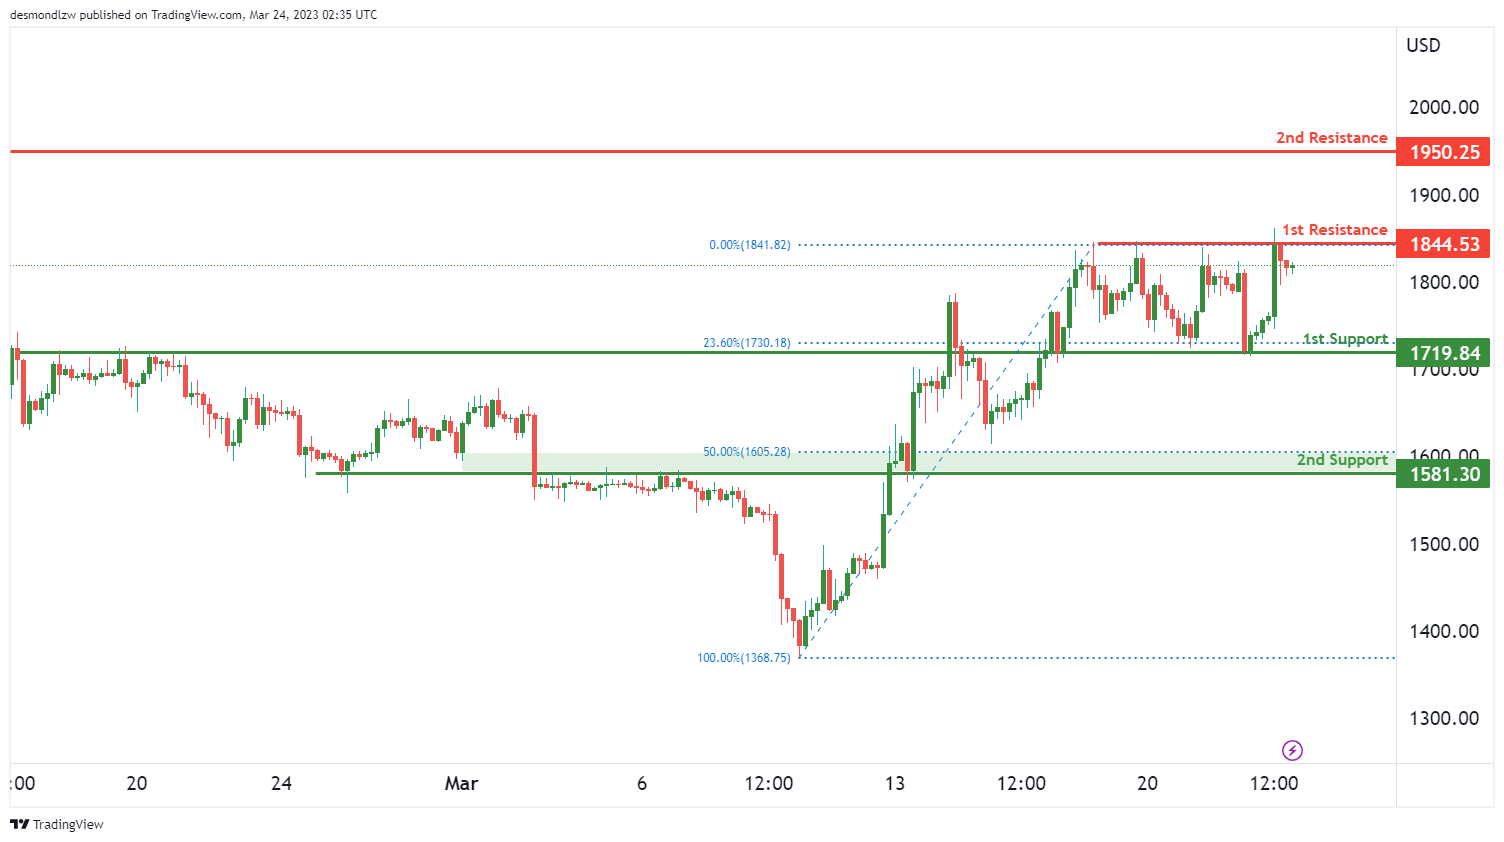
ETH/USD:
The ETH/USD chart is currently showing a bearish momentum, and price could potentially make a bearish reaction off the first resistance level at 1844.53 and drop towards the first support level at 1719.84. This support level is an overlap support and has a 23.60% Fibonacci retracement lining up with it. If price were to break through this level, it could potentially drop further towards the second support level at 1581.30, which is another overlap support and has a 50% Fibonacci retracement lining up with it.
On the resistance side, the first resistance level is at 1844.53, which is a multi-swing high resistance level. If price were to rise from the current level, it could face selling pressure at this level. If price were to break through this resistance, it could potentially rise towards the second resistance level at 1950.25, which is a swing high resistance level.
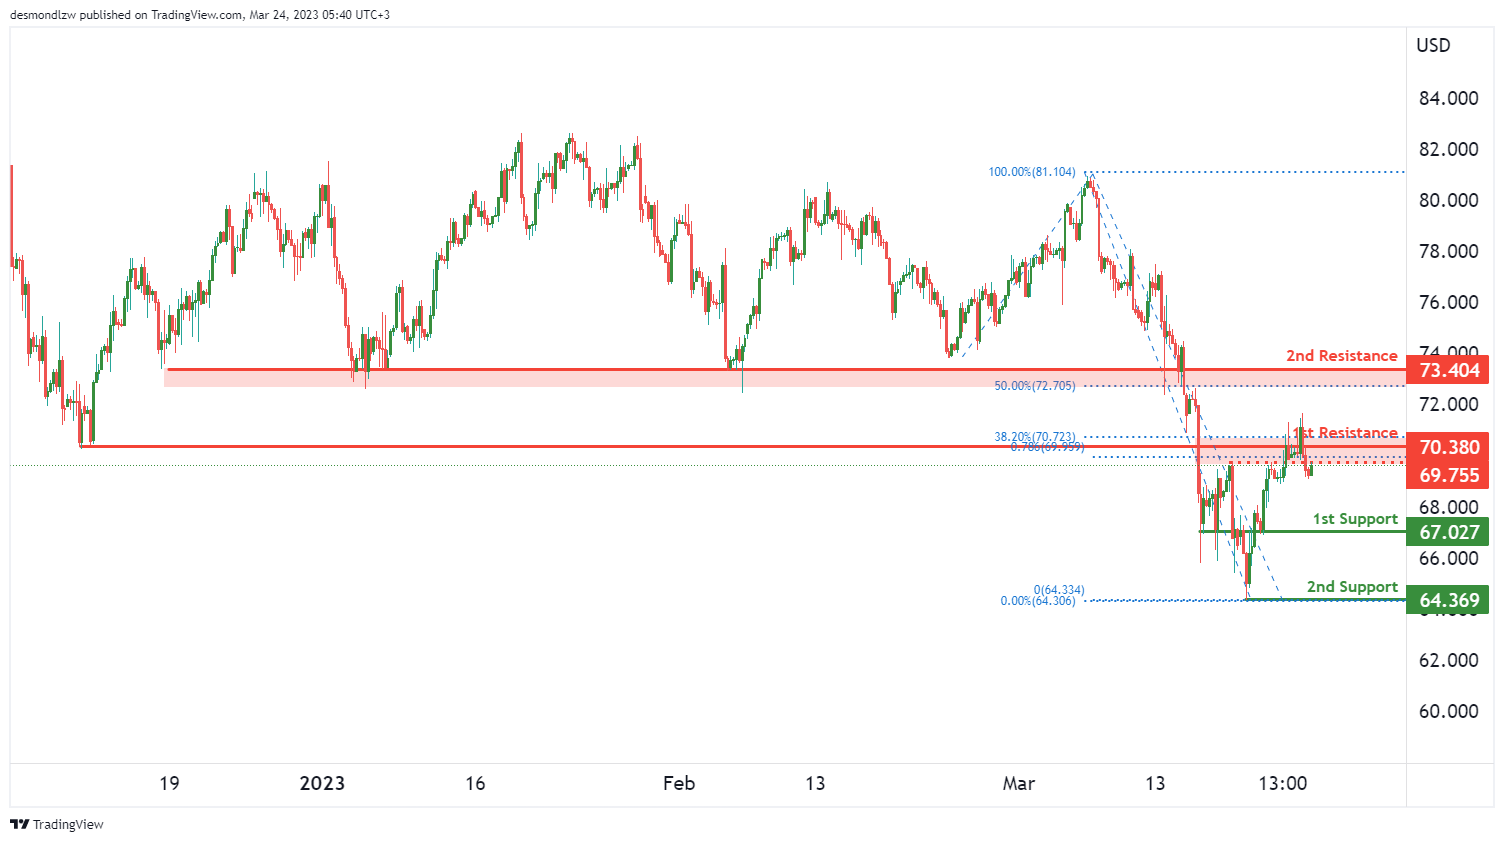
WTI/USD:
The WTI chart is currently showing a bearish momentum and price could potentially continue in a bearish direction towards the first support level at 67.02. This support level is an overlap support and could provide a strong level of buying interest. If price were to break through this level, it could drop further towards the second support level at 64.36, which is a swing low support and has held prices up in the past.
On the resistance side, the first resistance level is at 70.38, which is a pullback resistance level and has a 38.20% Fibonacci retracement lining up with it. If price were to rise from the current level, it could face selling pressure at this level. If price were to break through this resistance, it could potentially rise towards the second resistance level at 73.40, which is another pullback resistance level and has a 50% Fibonacci retracement lining up with it.
There is also an intermediate resistance at 69.75 between the current price and the first resistance level, which could provide a minor hurdle for prices to overcome before testing the first resistance.
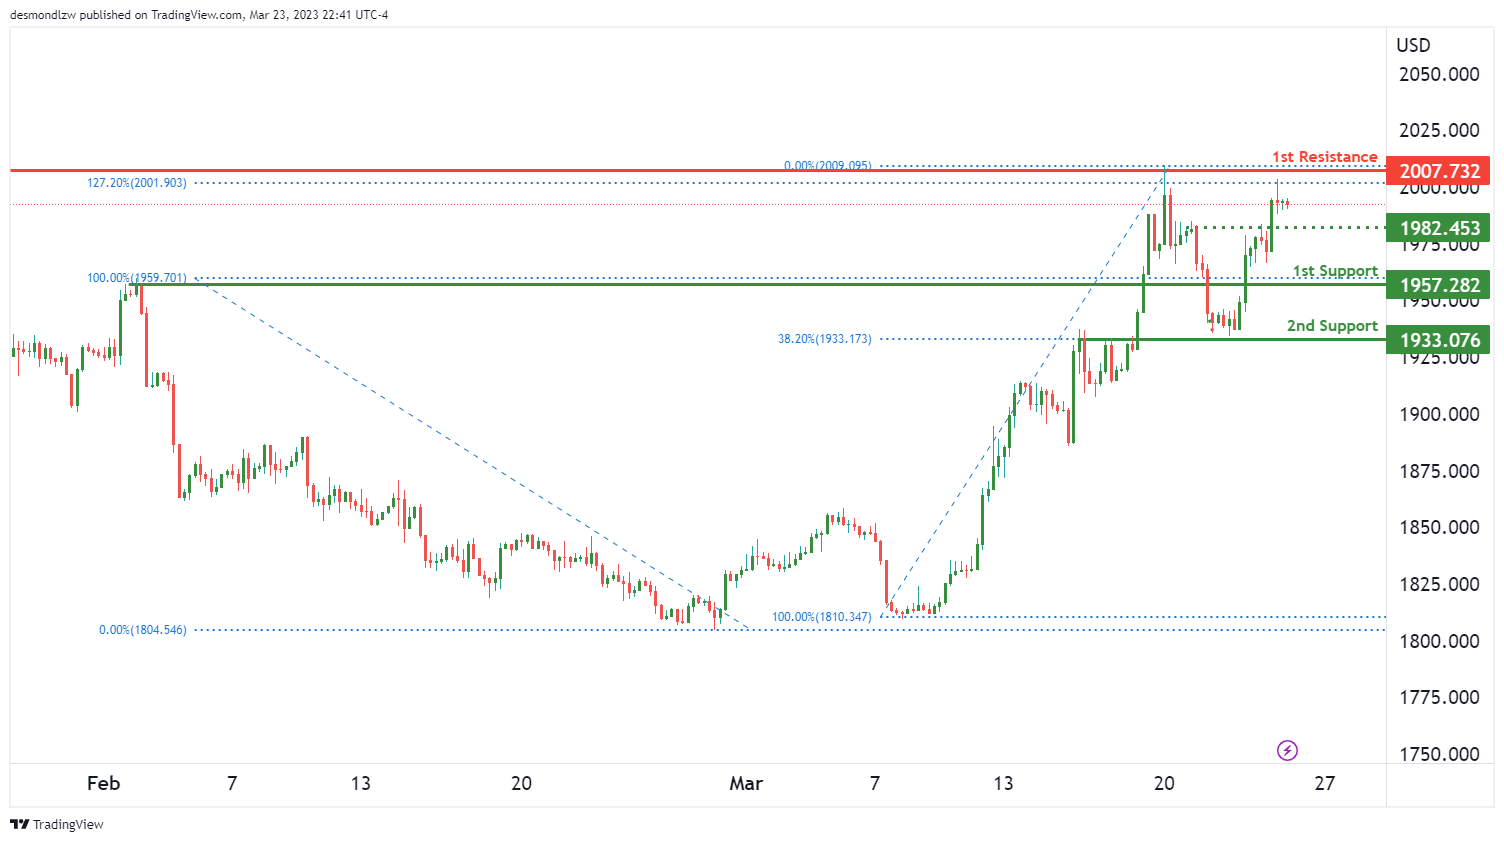
XAU/USD (GOLD):
The XAU/USD chart is currently showing a bearish momentum. Price could potentially make a bearish reaction off the first resistance level at 2007 and drop towards the first support level at 1957. This support level is an overlap support and has held prices up in the past. If price were to break through this level, it could drop further towards the second support level at 1933, which is also an overlap support level.
On the resistance side, the first resistance level is at 2007. This level is a swing high resistance and has a 127% Fibonacci extension lining up with it. If price were to rise from the current level, it could face selling pressure at this level. There is also an intermediate support level at 1982, which could act as a pullback support if price were to drop from the current level.


