
DXY:
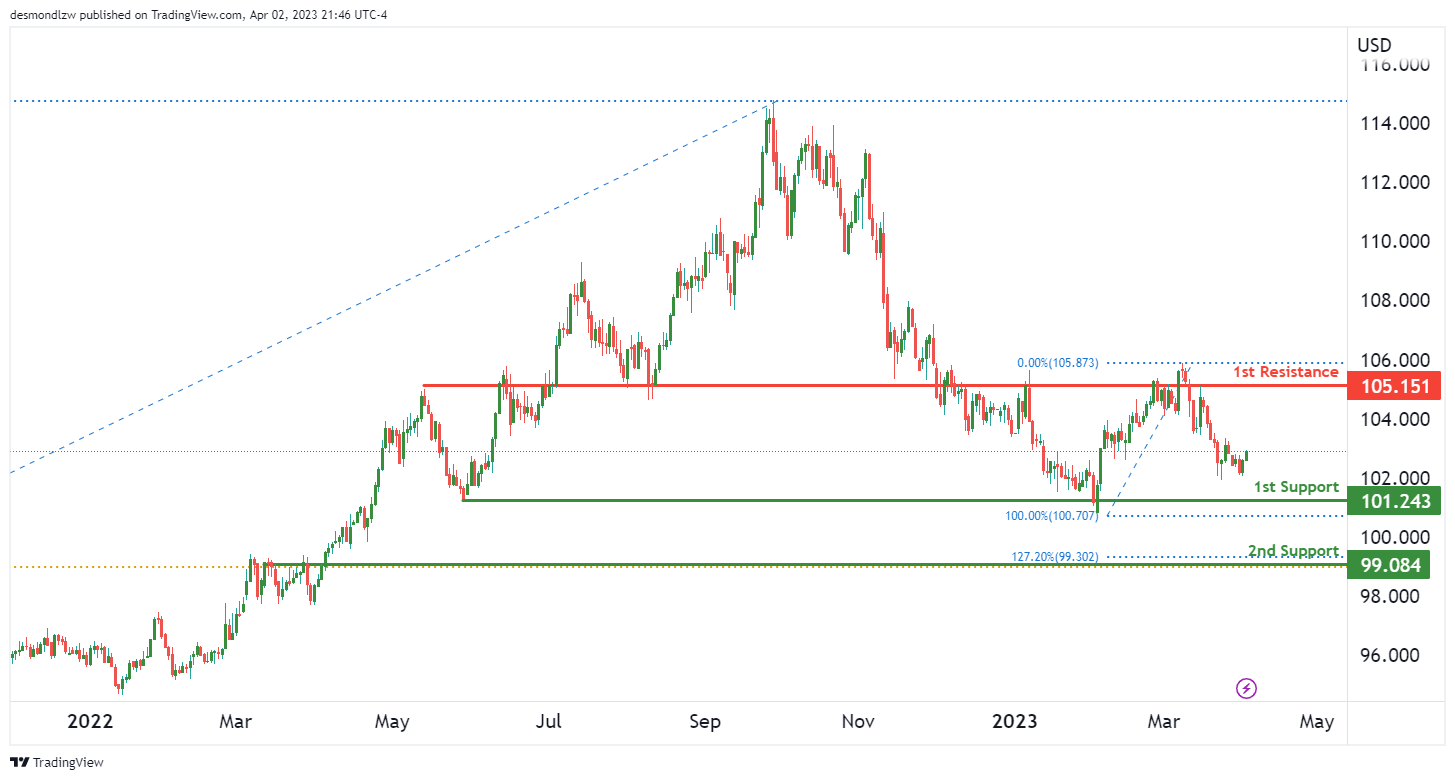
The overall momentum of the DXY chart is neutral, which means there is no clear trend direction. Price is likely to fluctuate between the 1st resistance and 1st support level.
The 1st support level for DXY is at 101.24. This is a multi-swing low support level, which means that price has bounced off this level multiple times in the past. This indicates that there is a strong demand for DXY at this level, and if price were to drop to this level, it could potentially bounce back up.
The 2nd support level for DXY is at 99.08. This is an overlap support level and coincides with the 127.20% Fibonacci extension, which adds additional weight to this level. If price were to drop below the 1st support level, it could potentially drop to this level next.
The 1st resistance level for DXY is at 105.15. This is an overlap resistance level, which means that it has served as a resistance level in the past. If price were to rise from the 1st support level, it could potentially rise to this level next.
It’s worth noting that since there is no clear trend or momentum, any breakouts of these support and resistance levels may not be highly significant.
EUR/USD:
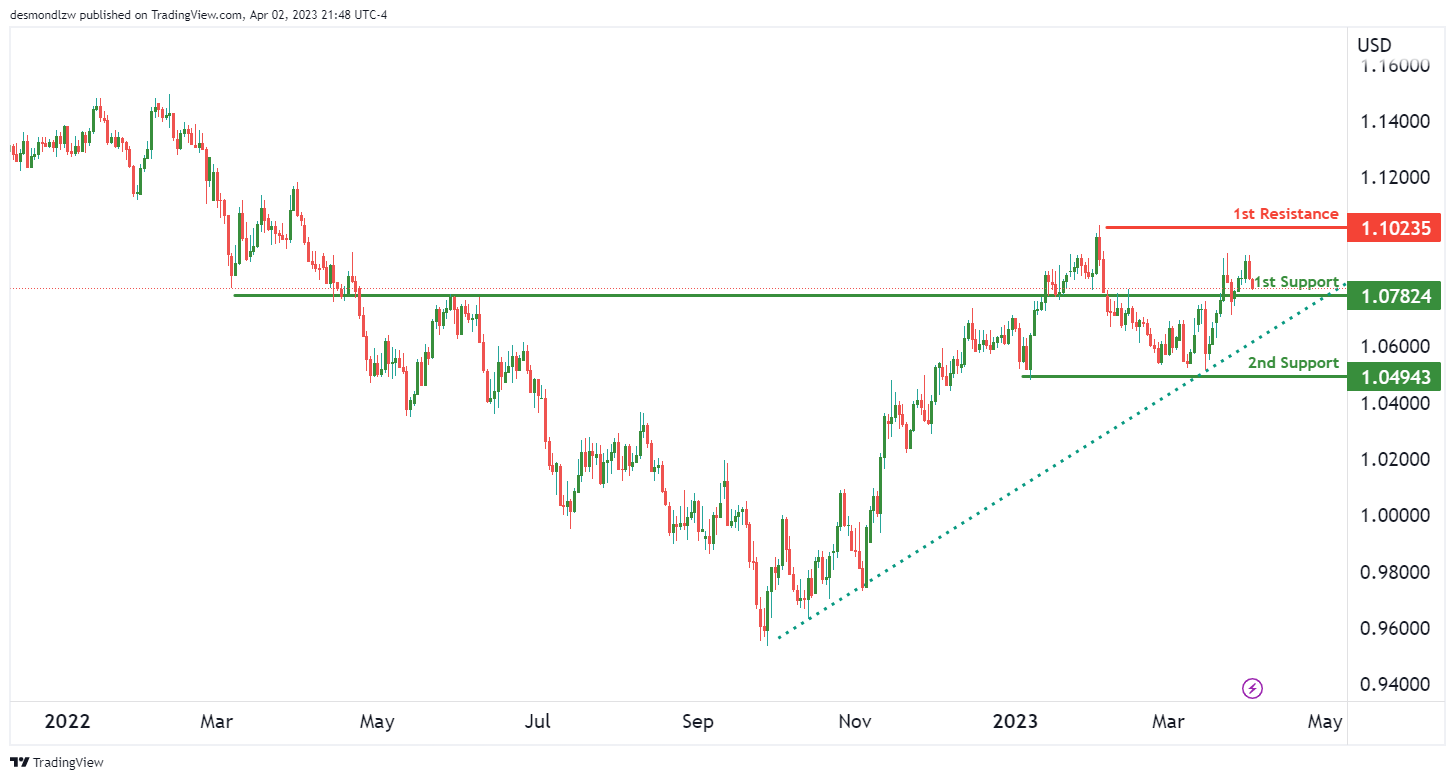
The overall momentum of the EUR/USD chart is bullish, indicating that the price is likely to continue rising. Price could potentially make a bullish continuation towards the 1st resistance level.
The 1st support level for EUR/USD is at 1.0782. This is an overlap support level, which means that it has served as a support level in the past. If the price were to drop to this level, it could potentially bounce back up, as there is a strong demand for EUR/USD at this level.
The 2nd support level for EUR/USD is at 1.0494. This is a multi-swing low support level, which means that price has bounced off this level multiple times in the past. This indicates that there is a strong demand for EUR/USD at this level, and if price were to drop to this level, it could potentially bounce back up.
The 1st resistance level for EUR/USD is at 1.1023. This is a swing high resistance level, which means that it has served as a resistance level in the past. If the price were to continue rising from the current level, it could potentially reach this level next.
It’s worth noting that since the overall momentum of the chart is bullish, any breakouts of these support and resistance levels are likely to be significant.
GBP/USD:
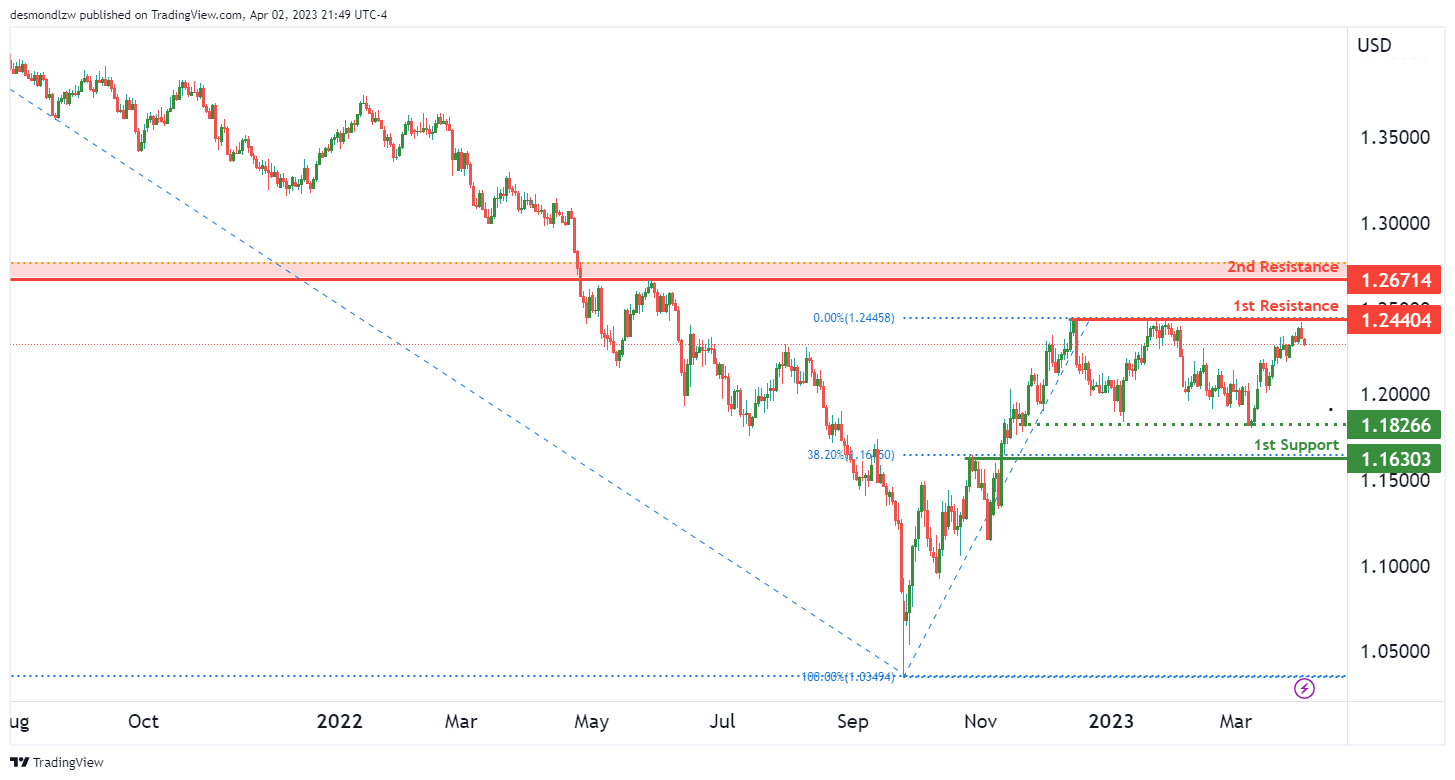
The GBP/USD currency pair. The overall momentum of the chart is bearish, indicating a potential for prices to move lower.
The first support level we have identified is at 1.163. This level is a significant overlap support that has historically been respected by the market. Additionally, it aligns with a 38.20% Fibonacci retracement level, providing further support for its significance.
The intermediate support level we have identified is at 1.1826. This level is a multi-swing low support and provides an additional level of support for the GBP/USD currency pair.
On the resistance side, we have identified the first resistance level at 1.2440. This level is a swing high resistance and has historically been a strong level of resistance for the currency pair.
The second resistance level we have identified is at 1.2671. This level is an overlap resistance that aligns with other technical indicators, providing additional support for its significance as a resistance level.
Overall, the chart’s momentum is bearish, indicating a potential for prices to continue moving lower. If the price were to break below the first support level at 1.163, it could trigger a move down towards the intermediate support level at 1.1826. On the other hand, if prices were to break above the first resistance level at 1.2440, it could trigger a move towards the second resistance level at 1.2671.
USD/CHF:
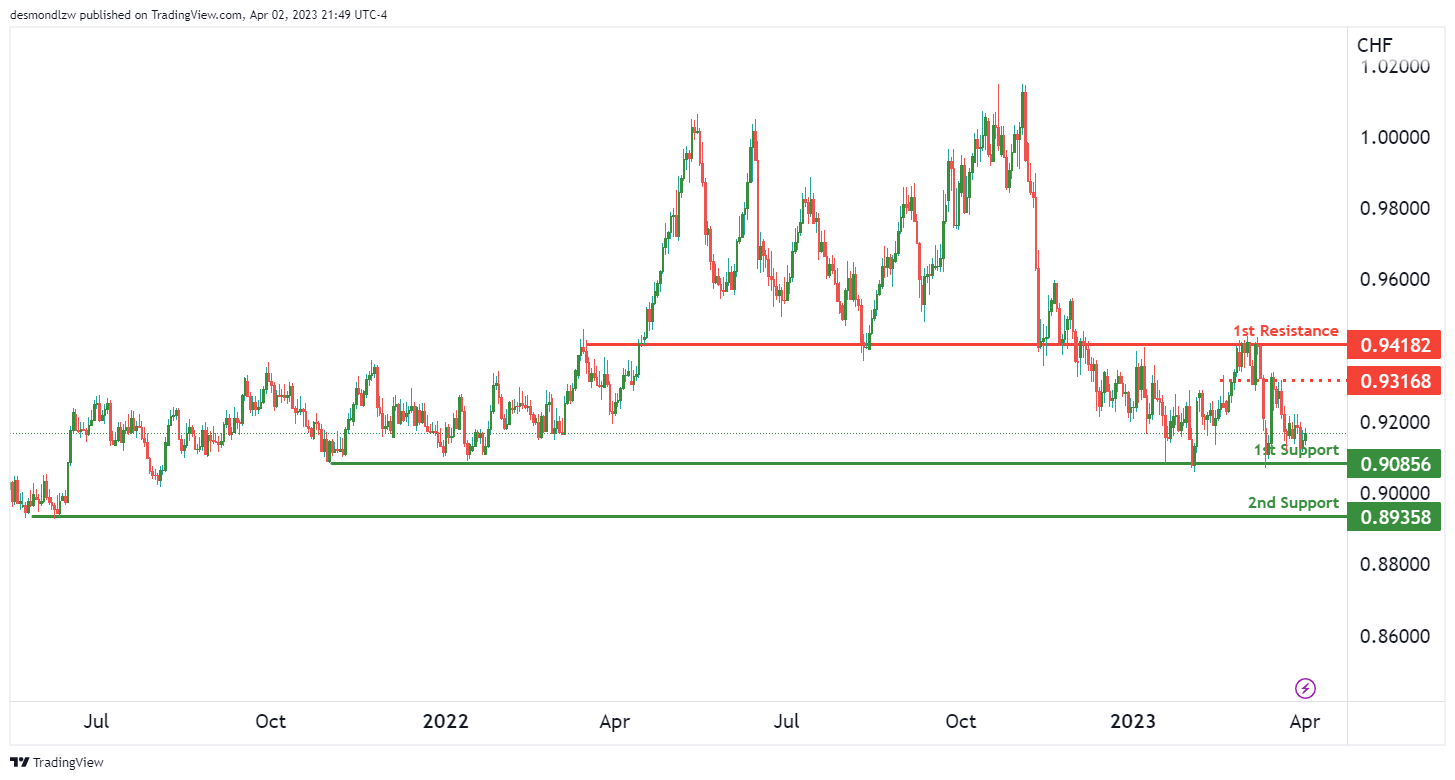
The overall momentum of USD/CHF is bullish, indicating a potential for prices to move higher.
The first support level we have identified is at 0.9085. This level is a significant multi-swing low support that has historically been respected by the market. It provides a strong level of support for the currency pair.
The second support level we have identified is at 0.8935. This level is also a multi-swing low support that has historically been respected by the market, providing an additional layer of support for the currency pair.
On the resistance side, we have identified the first resistance level at 0.9418. This level is an overlap resistance and has historically been a strong level of resistance for the currency pair. It aligns with other technical indicators, providing additional support for its significance.
The intermediate resistance level we have identified is at 0.9316. This level is an overlap resistance and has historically been a strong level of resistance for the currency pair.
USD/JPY:
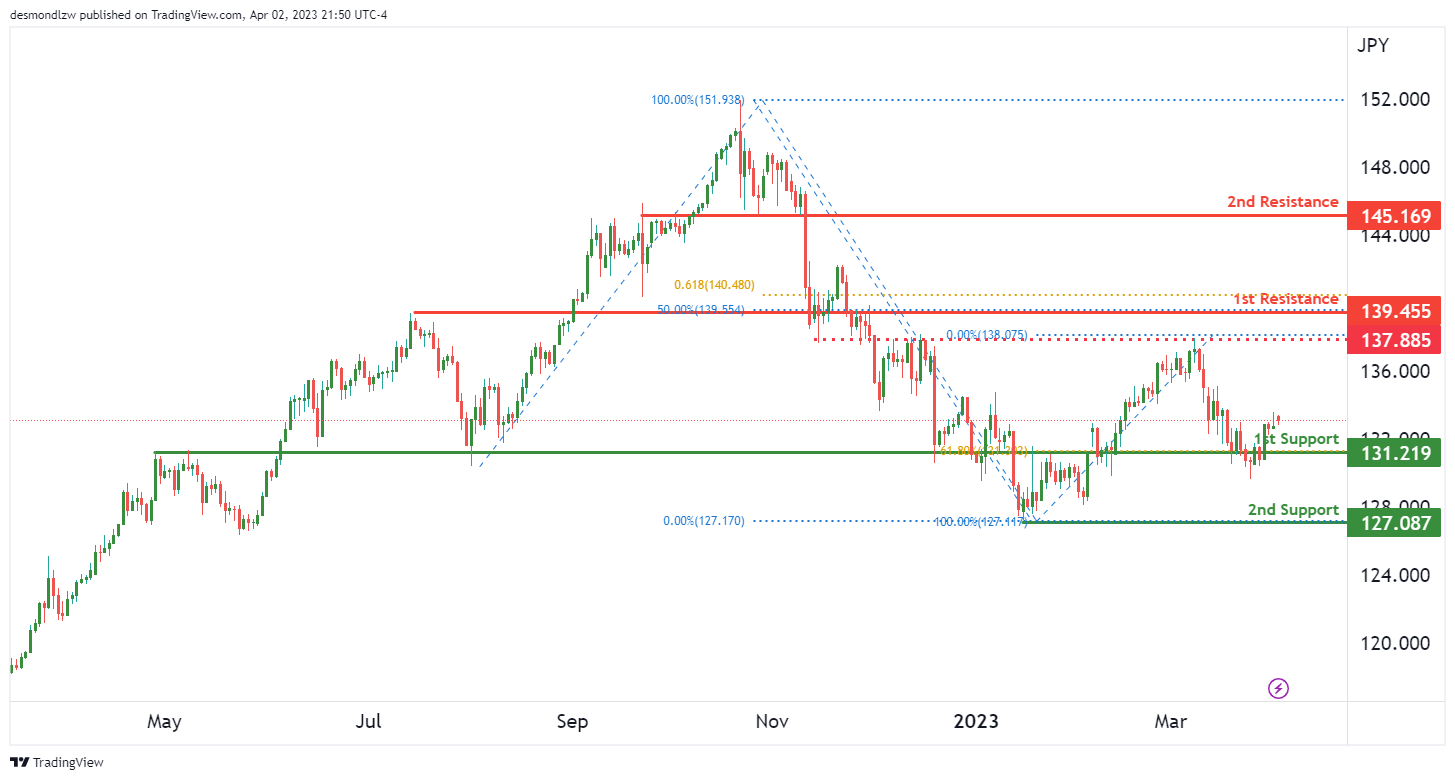
The USD/JPY chart is bullish. The price has the potential to continue its upward movement towards the 1st resistance level of 139.45.
The 1st support level at 131.21 is a good level for the price to potentially bounce off from, as it is an overlap support and is aligned with the 61.80% Fibonacci retracement. The 2nd support level at 127.08 is also a good level, being a swing low support.
On the other hand, the 1st resistance level at 139.45 is a strong overlap resistance, which coincides with the 50% Fibonacci retracement, making it a crucial level to watch out for. The 2nd resistance level at 245.16 is another good resistance level, being an overlap resistance as well.
There is an intermediate resistance level at 137.88, which also acts as a good level of resistance. If the price manages to break this intermediate resistance, it could potentially trigger a stronger bullish acceleration towards the 1st resistance level.
AUD/USD:
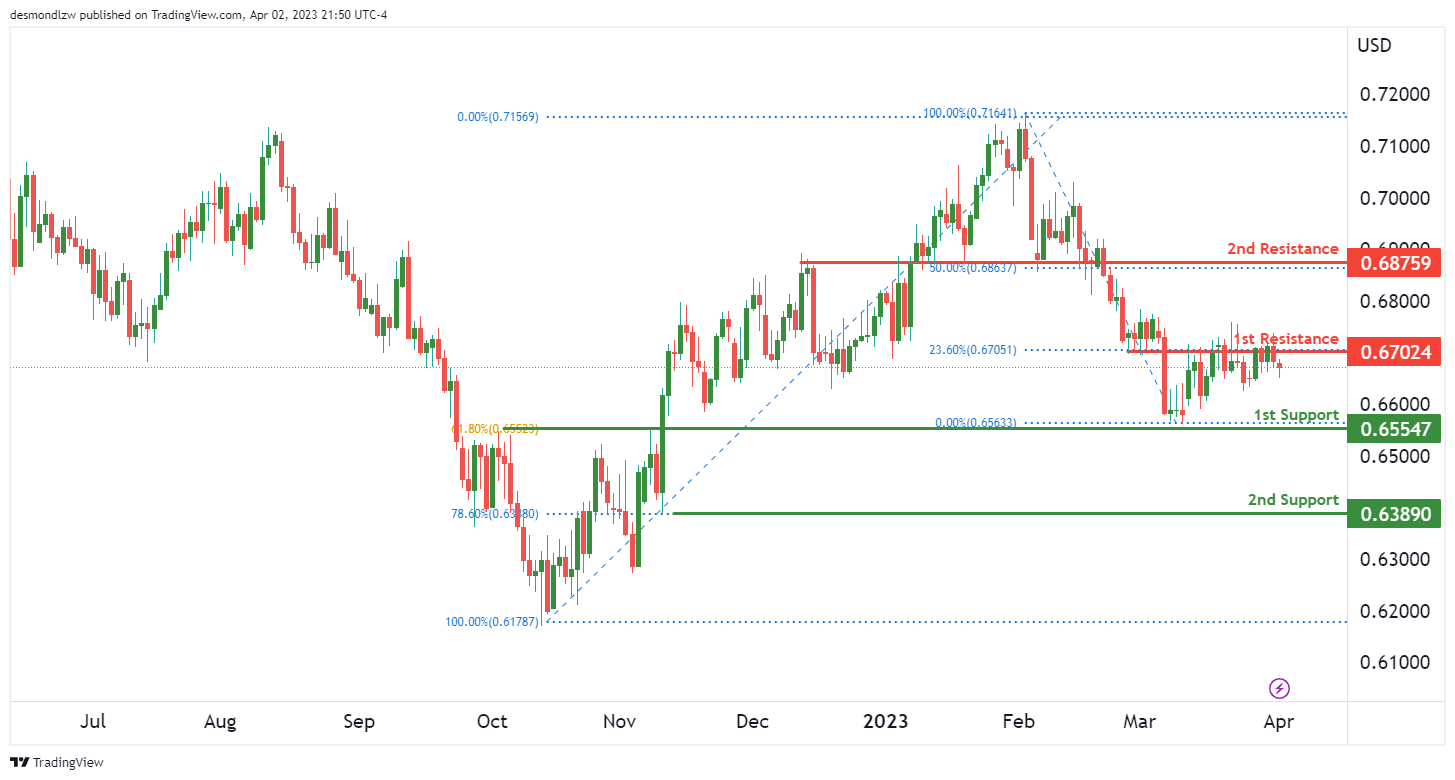
The AUD/USD currency pair remains bearish as it struggles to gain momentum against the US dollar. With an overall momentum of the chart indicating a bearish bias, it is possible that the pair could see a continuation towards the 1st support level.
At present, the 1st support is at 0.6554, which is a good level of support for the AUD/USD pair as it is an overlap support with a 61.80% Fibonacci retracement. The 2nd support at 0.6389 is also a noteworthy support level, as it is an overlap support with a 78.60% Fibonacci retracement.
On the resistance side, the 1st resistance at 0.6702 is an overlap resistance with a 23.60% Fibonacci retracement. The 2nd resistance level at 0.6875 is also an overlap resistance with a 50% Fibonacci retracement. If the price manages to break above these levels, it could potentially signal a bullish reversal. However, the current momentum suggests that the pair may continue its bearish trend.
It is worth noting that the AUD/USD pair is displaying a bearish trend as the overall momentum of the chart is bearish. This suggests that price could potentially make a bearish continuation towards the 1st support level. If the pair does break below the 1st support level, the next level of support could be the 2nd support at 0.6389.
NZD/USD:
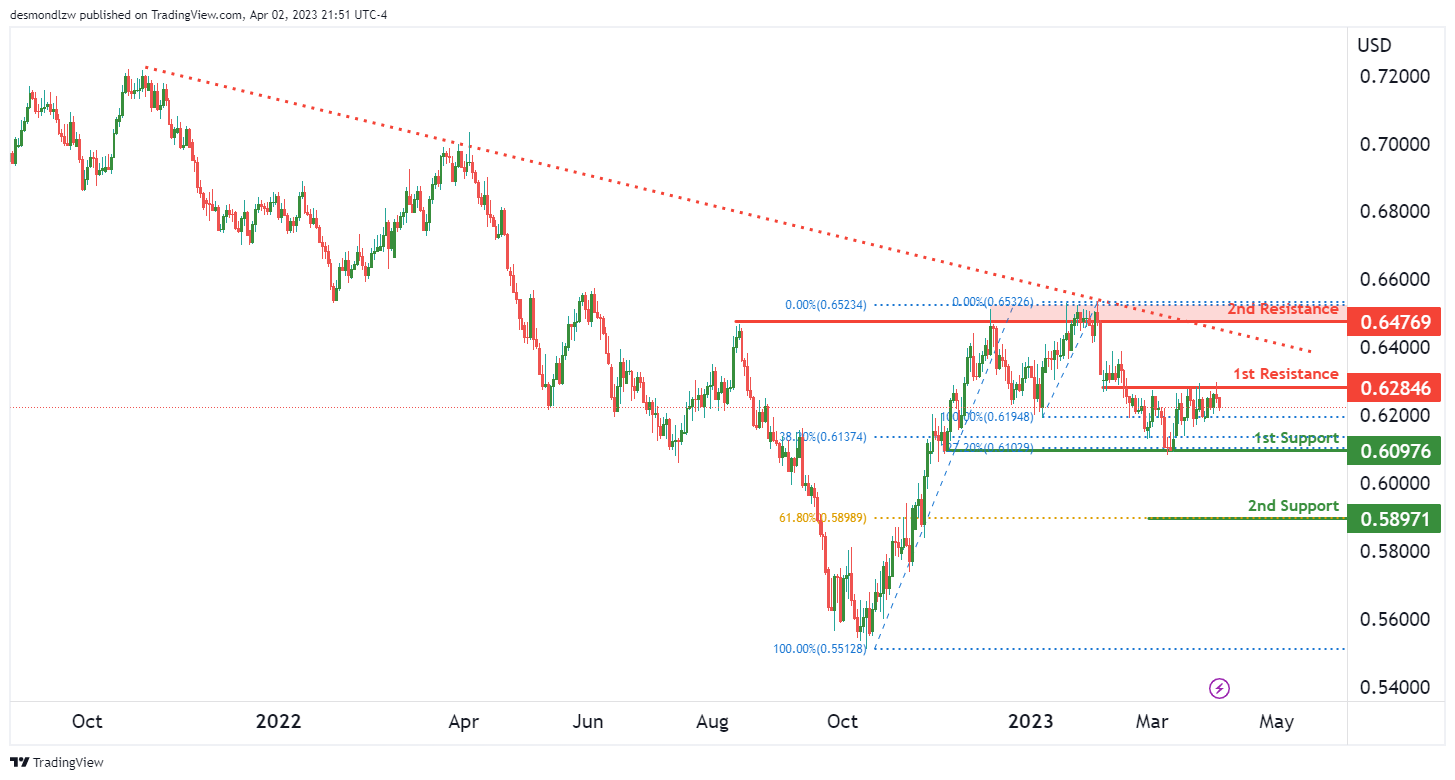
The NZD/USD chart is showing bearish momentum, as the price has potential to continue its downward trend towards the 1st support level. The overall momentum of the chart is bearish, suggesting that the pair could face selling pressure in the near future.
The 1st support level is at 0.6097, which is a multi-swing low support and coincides with a 38.20% Fibonacci retracement. If the price were to break this support level, it could drop towards the 2nd support level at 0.5897, which is a swing low support and coincides with a 61.80% Fibonacci retracement.
On the resistance side, the 1st resistance level is at 0.6284, which is an overlap resistance. If the price were to rise, it could face resistance at the 2nd resistance level of 0.6476, which is a multi-swing high resistance.
USD/CAD:
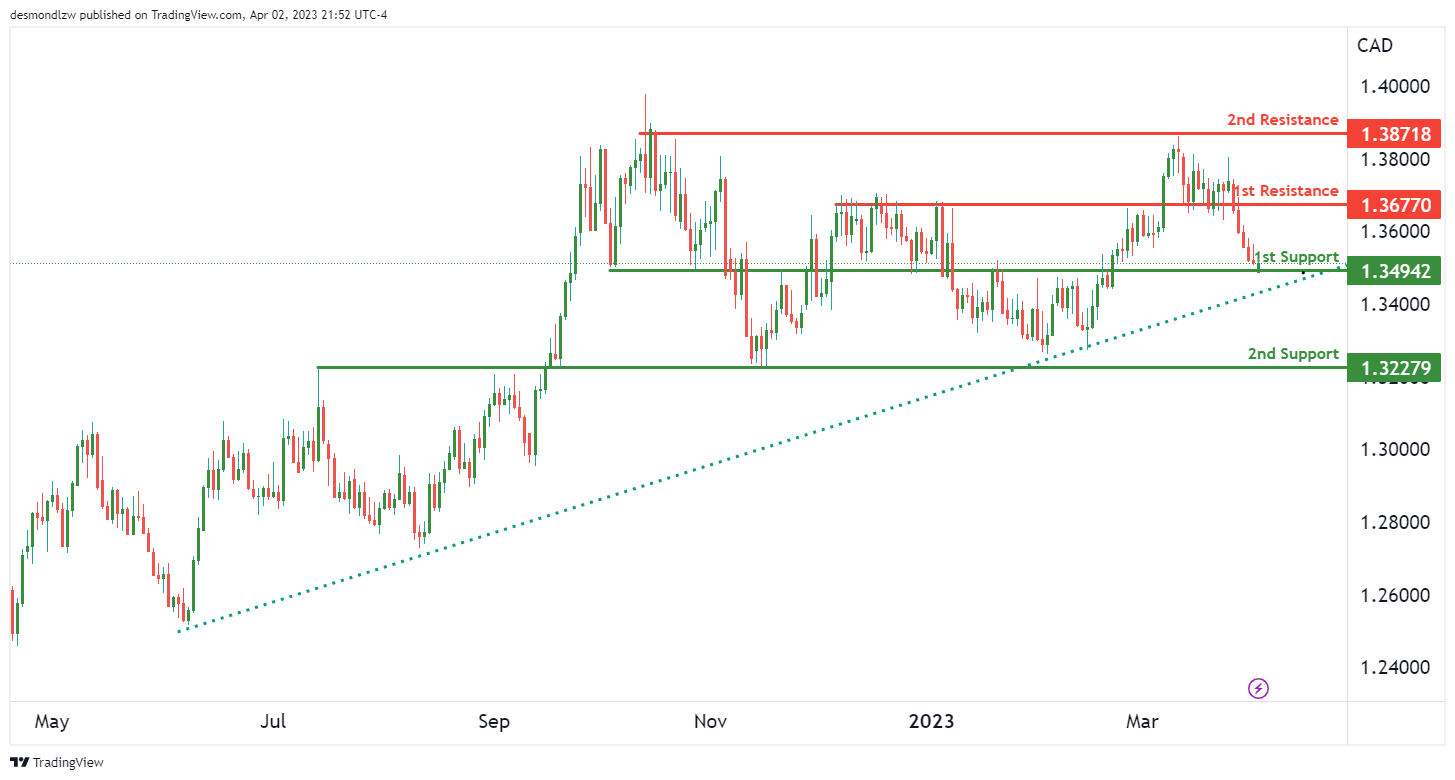
USD/CAD has seen a bullish momentum, driven by a major ascending trend line suggesting further bullish momentum is on the cards.
Looking at the support and resistance levels, the 1st support level is at 1.3494. This level is a strong overlap support that has held the price previously. The 2nd support level is at 1.3227, which is also an overlap support level.
On the other hand, the 1st resistance level is at 1.3677, which is an overlap resistance level. If the price manages to break above this resistance level, it could potentially reach the 2nd resistance level at 1.3871, which is a multi-swing high resistance level.
In case the price bounces off the 1st support level, it could head towards the 1st resistance level. However, if it breaks below the 1st support level, the next support level is at 2nd support level at 1.3227.
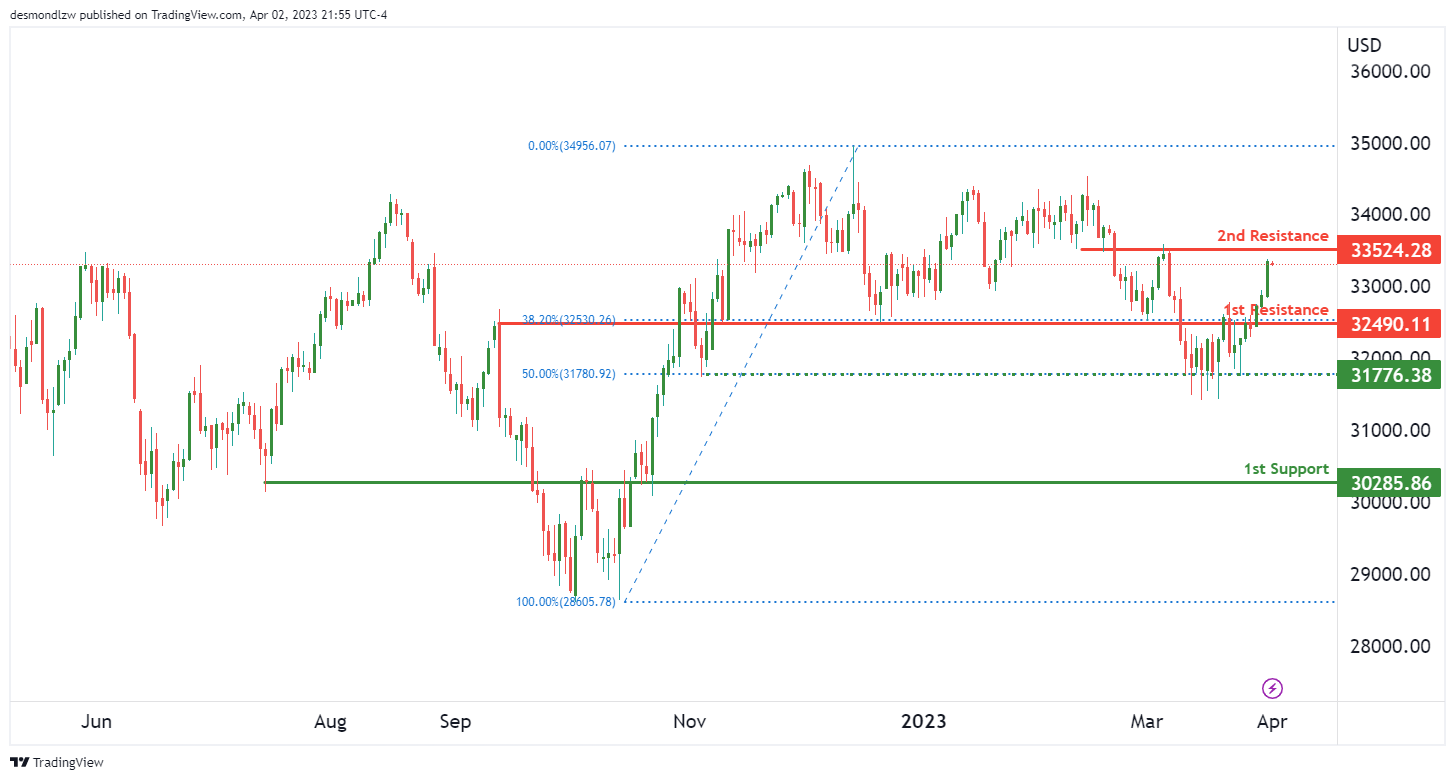
DJ30:
The DJ30 chart is currently showing bullish momentum as it is above a major ascending trend line. In the short term, price could potentially rise towards the 1st resistance before reversing off it and dropping towards the 1st support.
The 1st support level is at 30285.86 and is a strong overlap support. This level could provide a good level for buyers to enter the market. If price were to break below this support, it could head towards the intermediate support level at 31776.38 which also coincides with a 50% Fibonacci retracement level.
On the upside, the 1st resistance level is at 32490.11 and is also an overlap resistance, with a 38.20% Fibonacci retracement lining up with it. If price were to break above this resistance level, it could potentially rise towards the 2nd resistance level at 33524.28 which is also an overlap resistance.
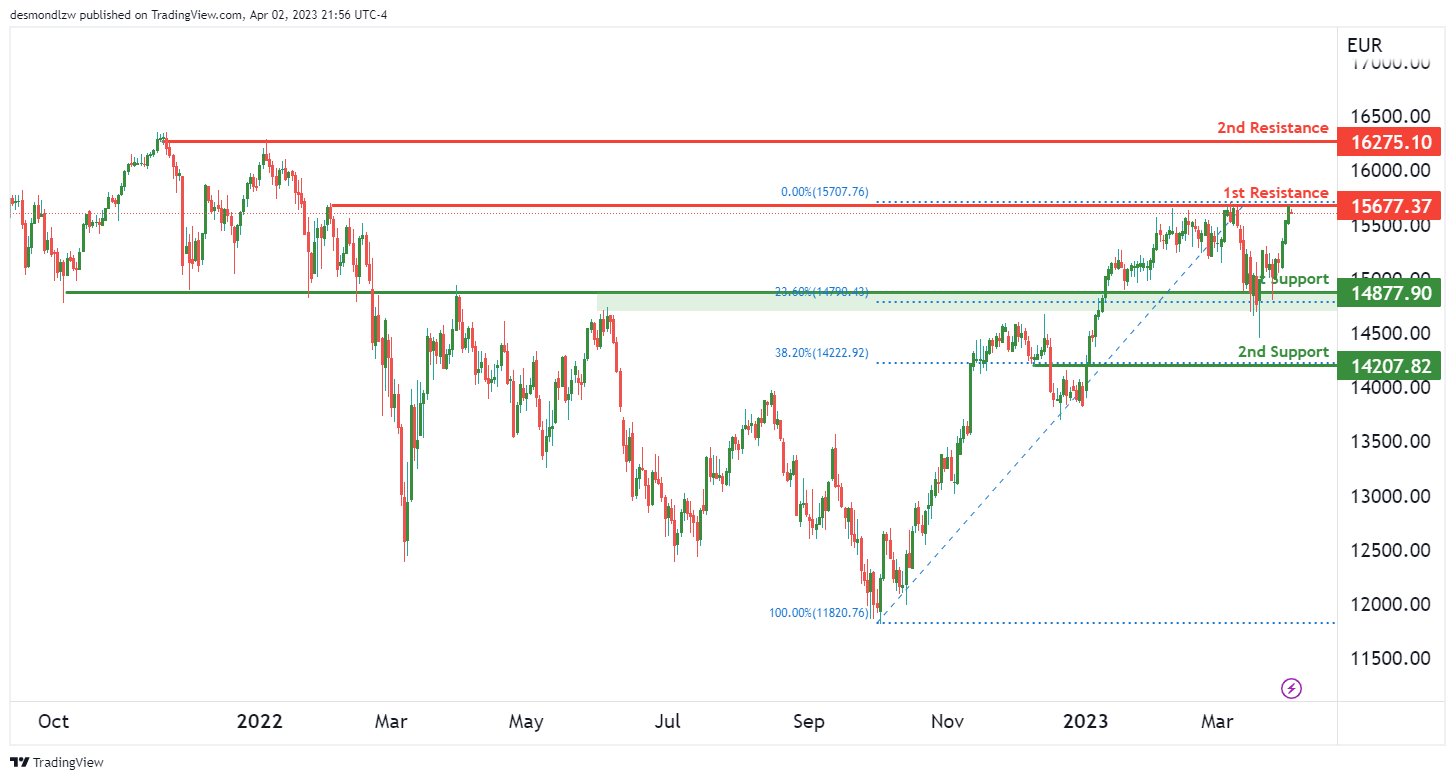
GER30:
The German DAX 30 index (GER30) is currently showing a bearish momentum, as prices have been trending lower over recent periods. However, there may be some potential for a short-term bullish move before a possible continuation of the downtrend.
Looking at the chart, the price is currently testing the 1st resistance level at 15,677.37, which is a multi-swing high resistance level. If the price reacts bearishly to this resistance, we may see a drop towards the 1st support at 14,877.90, which is an overlap support level and a 23.60% Fibonacci retracement level.
If the price bounces off the 1st support level, it could potentially rise towards the 1st resistance level, before reversing again and continuing the downtrend. The intermediate support at 14,207.82, which is an overlap support level and a 38.20% Fibonacci retracement level, may also act as a support level on the way down.
On the upside, the 2nd resistance level at 16,275.10, which is a multi-swing high resistance level, may act as a strong resistance level in case of a strong bullish move.
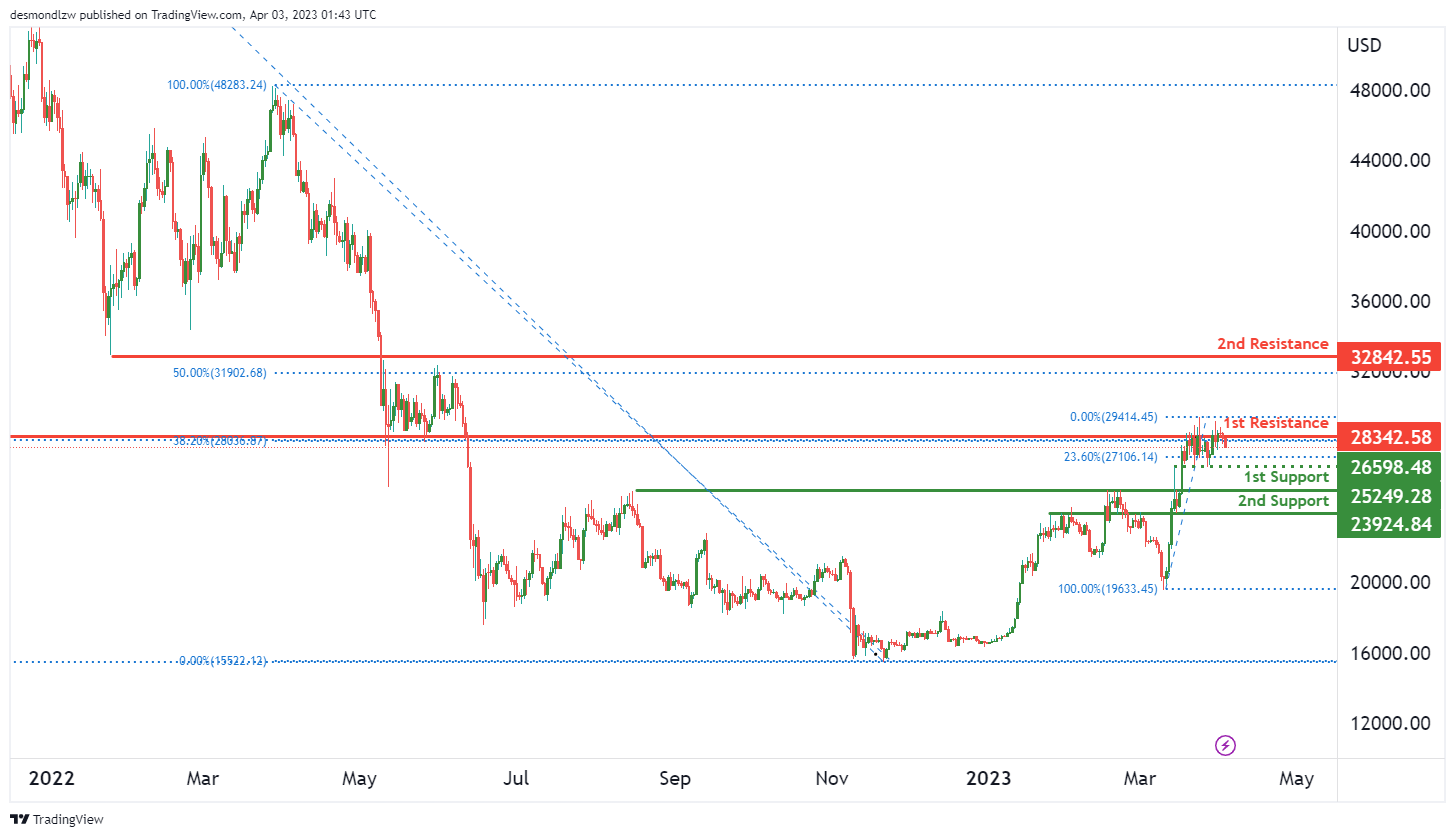
BTC/USD:
BTC/USD Shows Bearish Momentum with Potential Drop to Support
The overall momentum of the BTC/USD chart is bearish, with potential for a bearish continuation towards the 1st support level. The price is currently below the Ichimoku cloud, indicating bearish momentum.
The 1st support level is at 25249.28, which is a strong overlap support level. If the price were to drop from its current level, it could potentially reach this support level. The 2nd support level is at 23924.84 and is another overlap support level.
On the resistance side, the 1st resistance level is at 28342.58, which is a major overlap resistance level and coincides with a 38.20% Fibonacci retracement. The 2nd resistance level is at 32842.55, which is another overlap resistance level and coincides with a 50% Fibonacci retracement.
There is also an intermediate support level at 26598.48, which is an overlap support level and coincides with a 23.60% Fibonacci retracement.
If the price were to break the 1st support level, the next level it could drop to is the 2nd support level. Conversely, if the price were to break the 1st resistance level, it could potentially rise towards the 2nd resistance level.
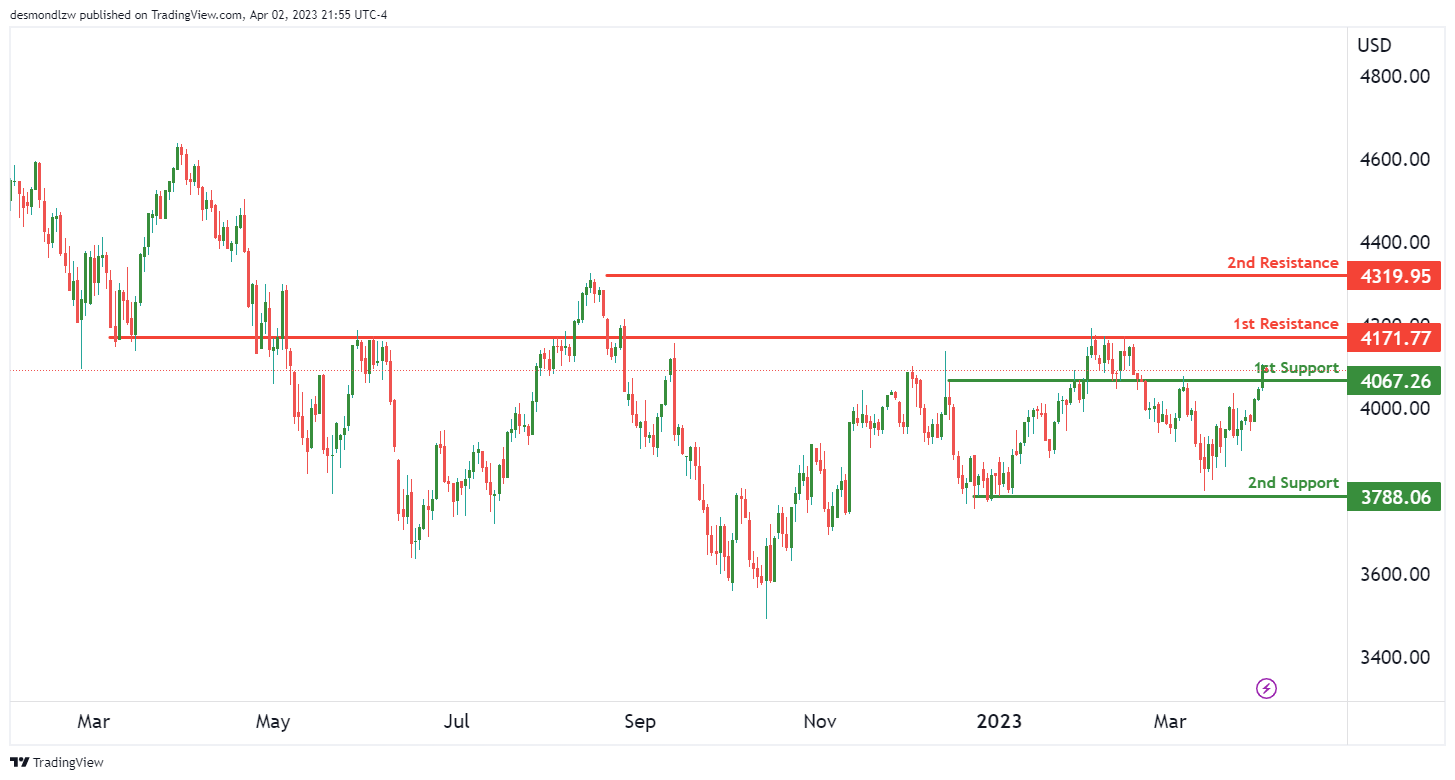
US500
The US500 chart has been showing strong bullish momentum lately, and prices could potentially continue to rise towards the 1st resistance level. This level is at 4171.77 and has been a strong resistance point in the past, making it an ideal target for bulls.
If prices do pull back, the 1st support level at 4067.26 could provide a good opportunity for bulls to enter the market. This level has acted as a strong support level in the past, with multiple touches and bounces. If prices continue to fall, the 2nd support level at 3788.06 is also a good level to watch, as it has been a multi-swing low support level.
On the other hand, if prices break through the 1st resistance level, the 2nd resistance level at 4319.95 could come into play. This level has acted as a swing high resistance in the past and could provide a target for bulls to aim for.
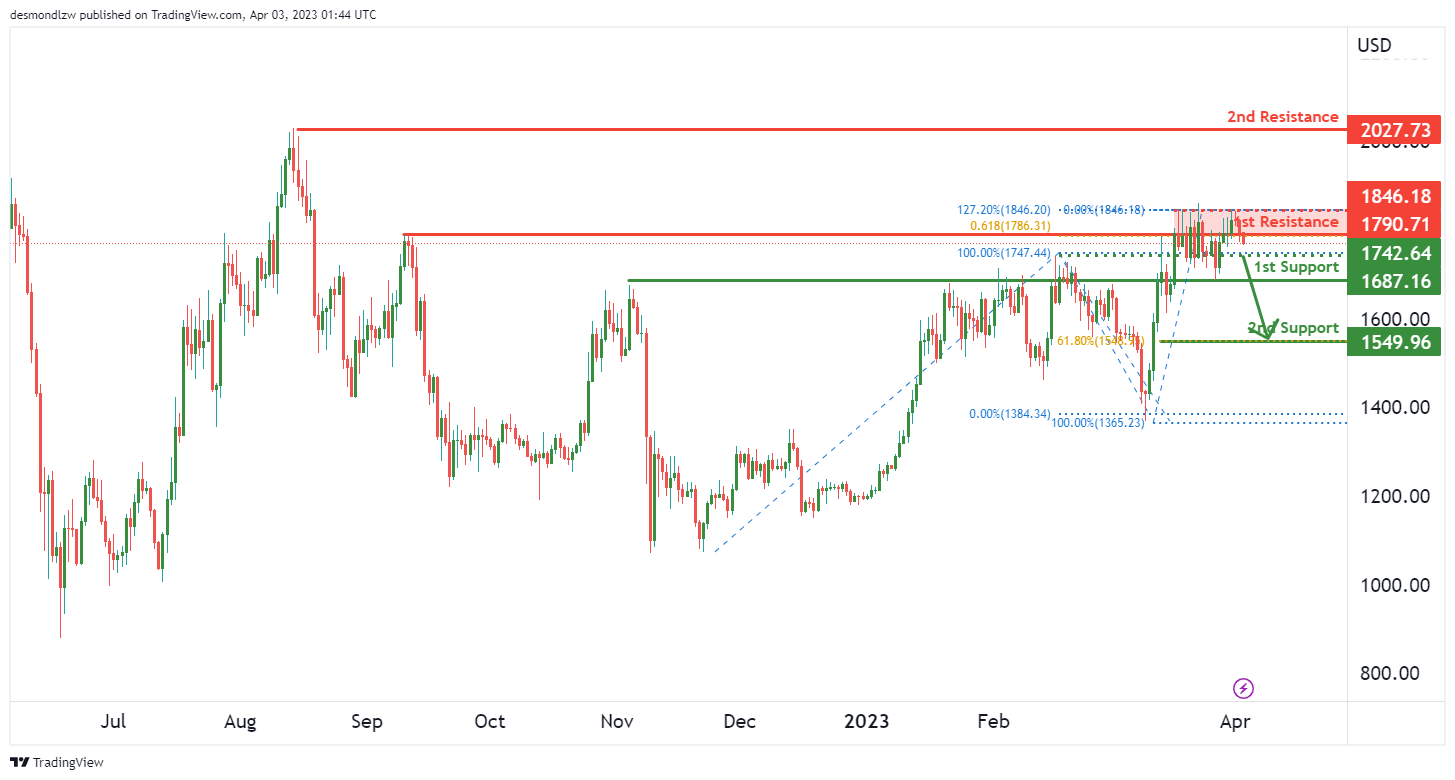
ETH/USD:
The overall momentum of the ETH/USD chart is bearish, with price potentially making a bearish continuation towards the 1st support. The first support level is at 1687.16, which is a good level due to its overlap support.
If the price breaks the 1st support level, it could potentially drop to the 2nd support level at 1549.96. This level is a swing low support and has a 61.80% Fibonacci retracement lining up with it, making it a good level for potential bounce or reversal.
On the resistance side, the first resistance level is at 1790.71, which is a good level due to its overlap resistance and 127.20% Fibonacci extension. The second resistance level is at 2027.73, which is a swing high resistance.
There is also an intermediate support level at 1742.64, which is a good level due to its overlap support.
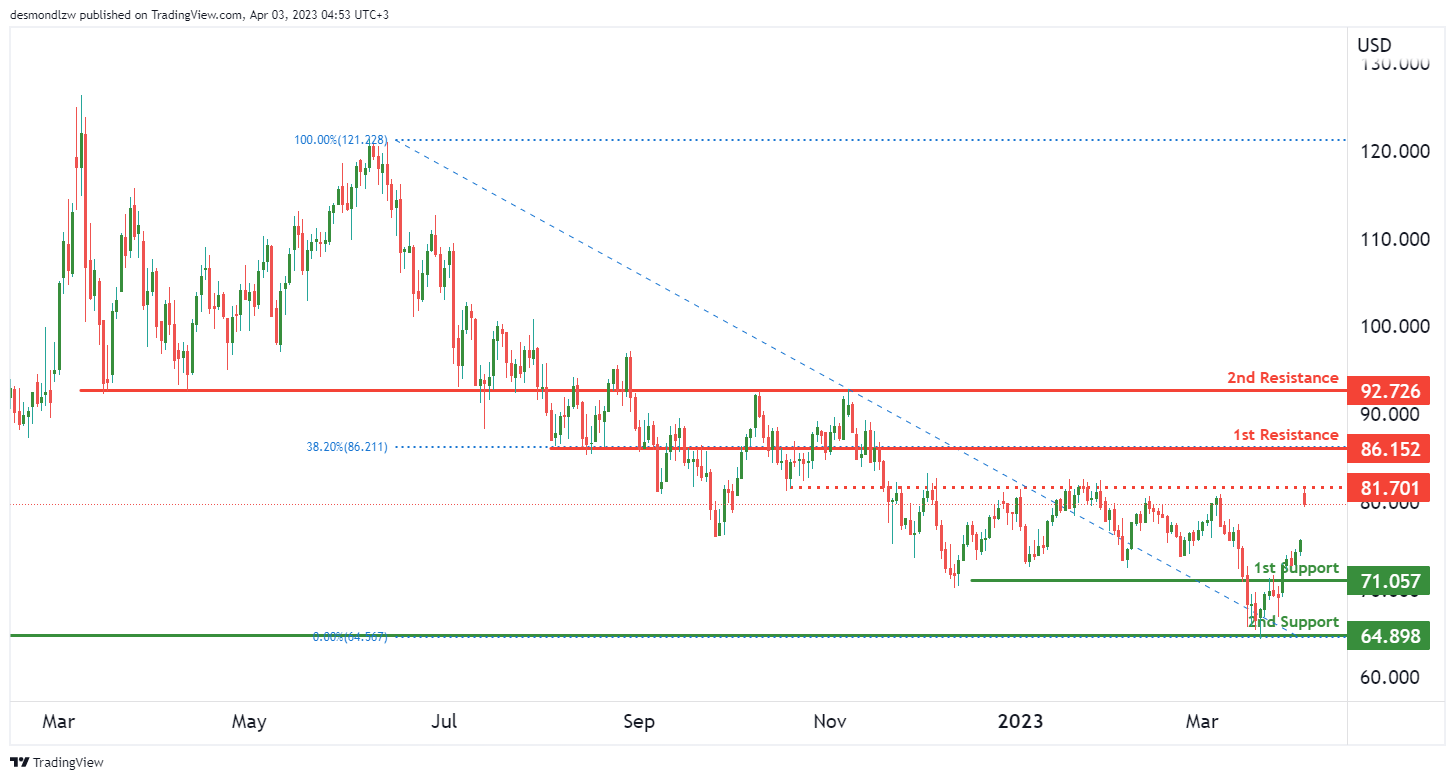
WTI/USD:
The price of WTI has been experiencing bullish momentum overall, and it is possible that it will continue to rise towards the first resistance level. The first support level for WTI is at 71.05, which is an overlap support level. Additionally, the second support level is at 64.89, which is a swing low support level. On the other hand, the first resistance level is at 86.15, which is an overlap resistance level and is also the 38.20% Fibonacci retracement level. The second resistance level is at 92.72, which is another overlap resistance level. Finally, there is an intermediate resistance level at 81.90, which is also an overlap resistance level. Therefore, if the price continues to rise towards the first resistance level, it may experience some resistance at the intermediate resistance level or at the second resistance level before breaking through to continue on its upward trajectory.
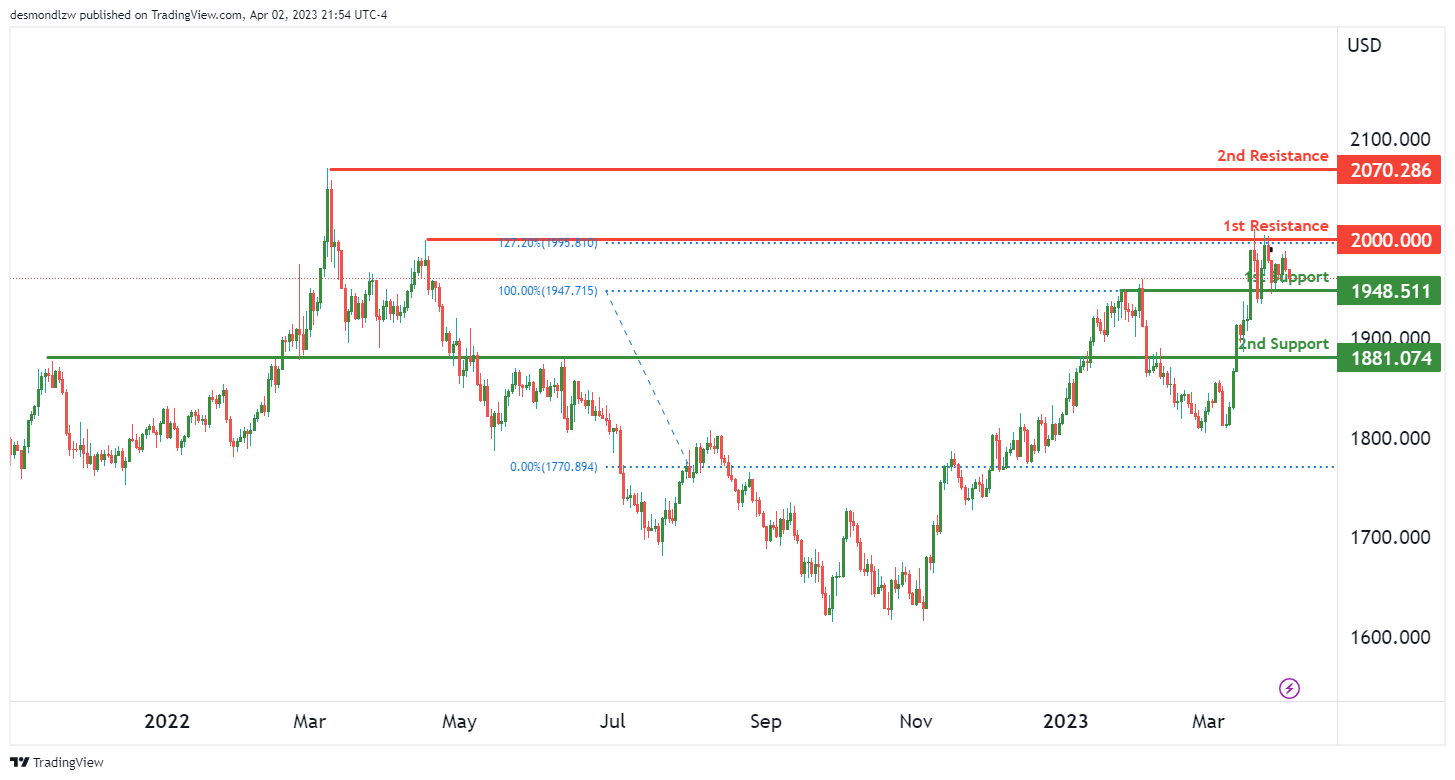
XAU/USD (GOLD):
Gold (XAU/USD) has been on a bullish trend, with the overall momentum of the chart being bullish. Looking at the chart, the price could potentially make a bullish bounce off the first support and head towards the first resistance.
The first support level is at 1948.51, which is an overlap support level. This level has been tested multiple times in the past and has held as a support level, making it a good level for a potential bounce.
The second support level is at 1881.07, which is also an overlap support level. This level has been tested several times in the past and has held as a support level, making it another good level for a potential bounce.
On the upside, the first resistance level is at 2000.00. This level is a multi-swing high resistance and has been an important level in the past. Additionally, it is at the 127.20% Fibonacci Extension level, adding further confluence to the level.
The second resistance level is at 2070.00, which is a swing high resistance level. This level has been an important level in the past, making it a good level for traders to watch.


