
LTCUSD – Bullish Harami Pattern Is Above $86.64
Bears couldn’t pull the market further down last week, and after touching a low of $86.64 on 30th March, the prices started to correct upwards against the US Dollar, touching a high of $94.91 on 03rd April.
We have seen a bullish opening of the markets this week.
We can see a bullish harami pattern above the $86.64 handle. It signifies the end of a bearish phase and the start of a bullish phase in the market.
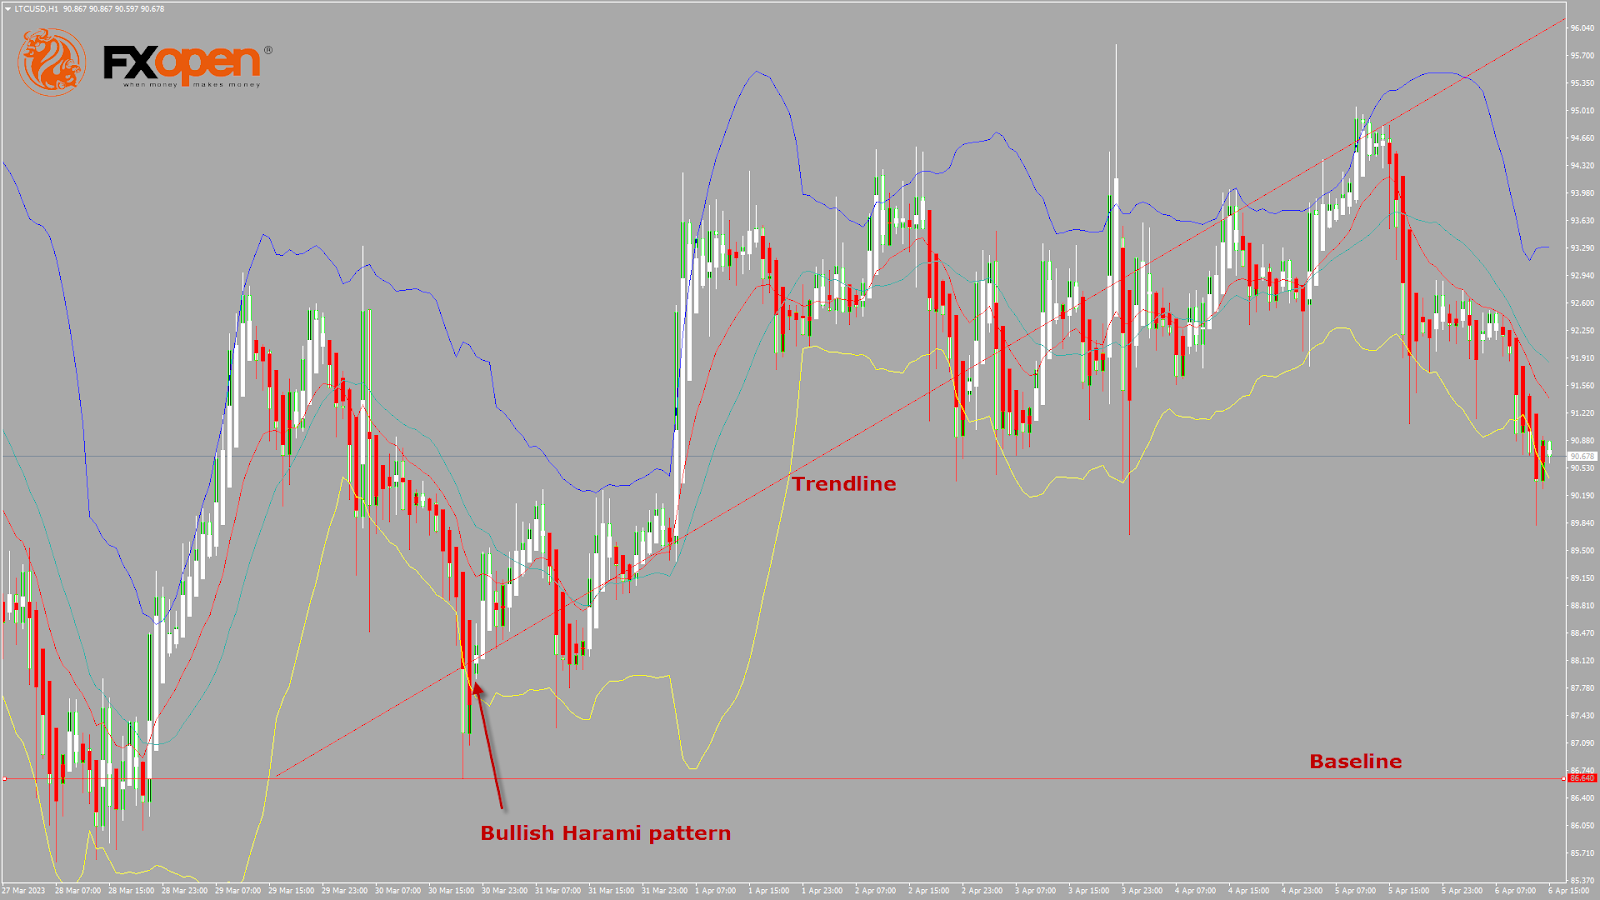
The price of Litecoin is near the channel’s support, indicating upcoming bullish movement. Also, Litecoin is trading above its 100-hour simple moving average and 100-hour exponential moving average, and it’s above the pivot level of $92.93.
The relative strength index is at $52.50, indicating a neutral demand for Litecoin and a shift towards the market consolidation phase.
The prices of Litecoin continue to remain above some of the moving averages, which are giving a bullish signal at current market levels of $90.65
Both the Williams percent range and commodity channel index are signalling neutral market conditions, which means that the price is expected to remain in a consolidation phase in the short-term range.
The short-term outlook for Litecoin has turned mildly bullish.
- Some of the technical indicators are giving a bullish signal.
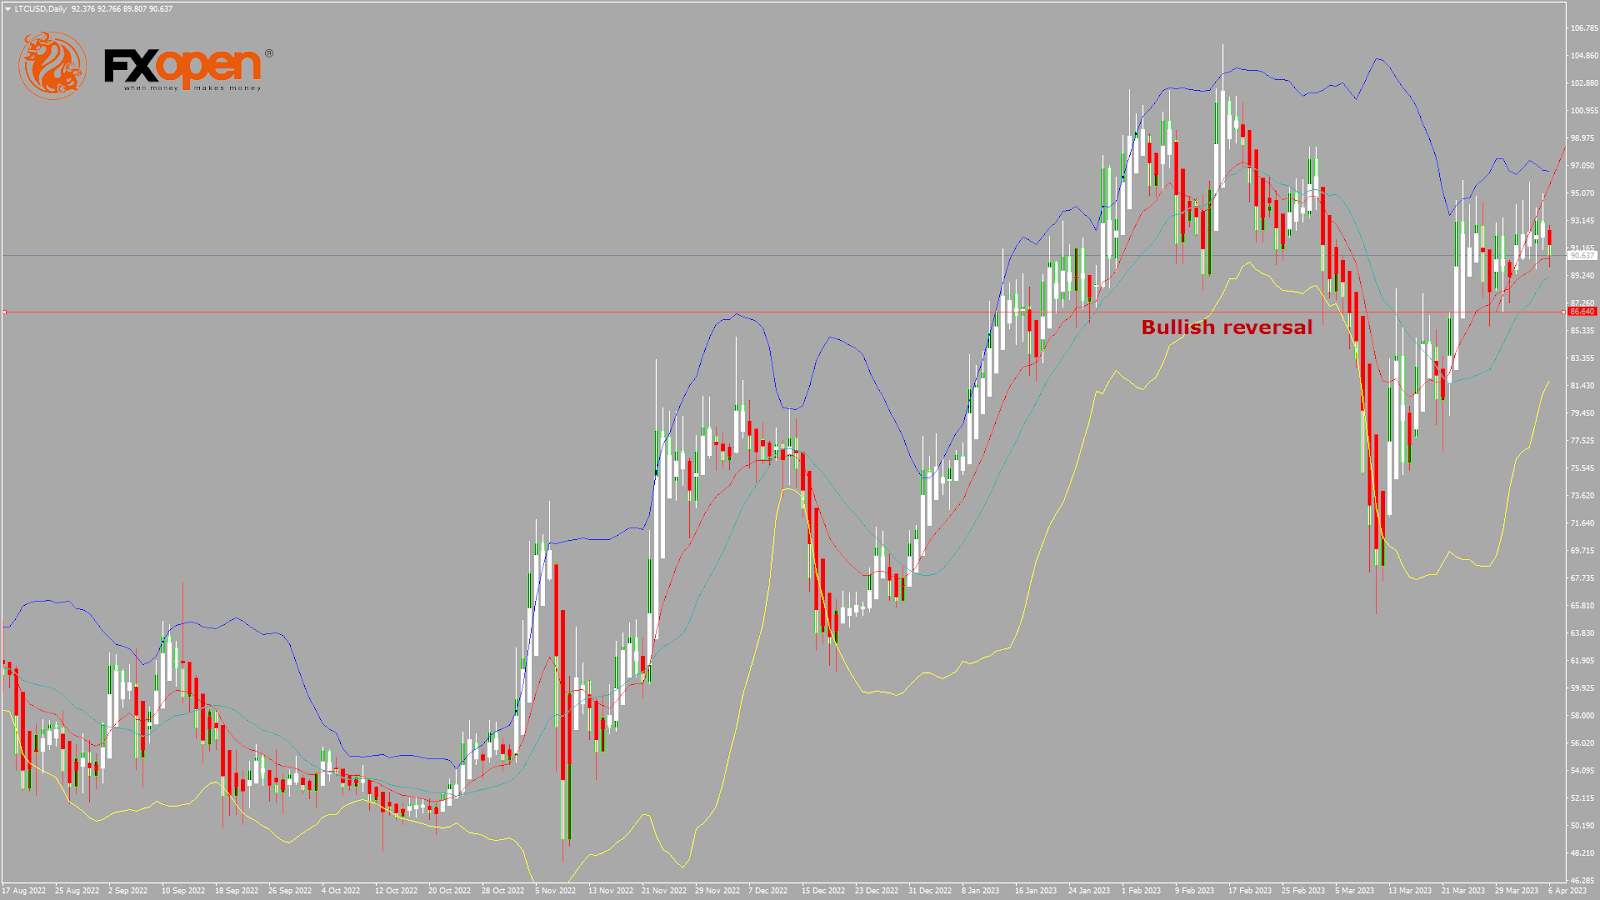
- Litecoin bullish reversal is seen above the $86.64 level.
- The RSI gives a neutral signal.
- The average true range indicates low market volatility.
Litecoin Bullish Reversal Seen Above $86.64
The price of Litecoin continues to move in a mild bullish momentum above the $90 handle, but it entered a consolidation zone in the European trading session.
We can see the formation of a bullish crossover of 20-day and 50-day moving averages.
The price of LTCUSD is now facing its classic resistance levels of 94.68 and Fibonacci resistance levels of 96.69, after which the path towards $100 will get cleared.
Litecoin faces resistance at the $92.88 pivot point and $93.92.
Litecoin trading volume has increased by 0.01% compared to yesterday, which appears normal.
The Week Ahead
The price of Litecoin has been facing stiff resistance at $97 in the last 30 days. It’s moving into a consolidation phase, after which we can see fresh upsides towards $95 and $100.
Some of the technical indicators are signalling a neutral sentiment in the market.
Litecoin should stay above the important support level of $88.44, which is a 14 Day RSI at 50, and at $90.13, which is a 38.2% retracement from a 13-week high.
The short-term outlook for Litecoin has turned mildly bullish, the medium-term outlook is bullish, and the long-term outlook is neutral at present market conditions.
The weekly projection is $100, with a consolidation zone of $95.


