
DXY:
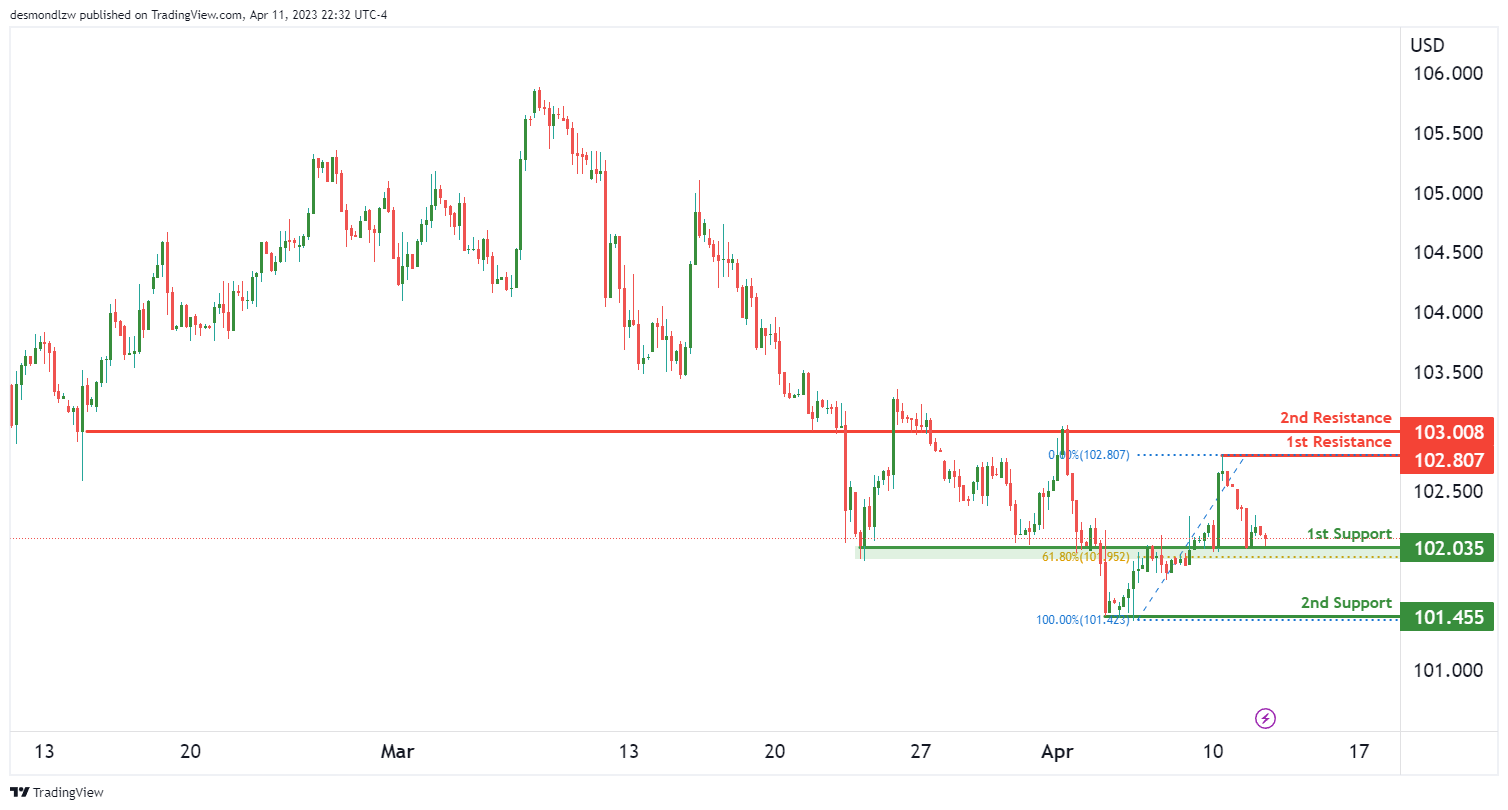
Looking at the DXY chart, the overall momentum of the chart is bearish. There is a potential for a bearish break off the 1st support level at 102.03, which is an overlap support level and coincides with the 61.80% Fibonacci retracement level. If price were to drop from this level, it could potentially fall towards the 2nd support level at 101.45, which is a multi-swing low support level.
On the upside, there are two good resistance levels to watch out for. The 1st resistance level is at 102.80, which is a swing high resistance level. The 2nd resistance level is at 103.00, which is an overlap resistance level.
If the bearish momentum continues, we may see price drop from the 1st support towards the 2nd support. However, if price manages to break above the 1st resistance level, we could see it rise towards the 2nd resistance level. It’s important to note that the overall bias of the chart is bearish, so a bearish breakout from the 1st support level is more likely.
EUR/USD:
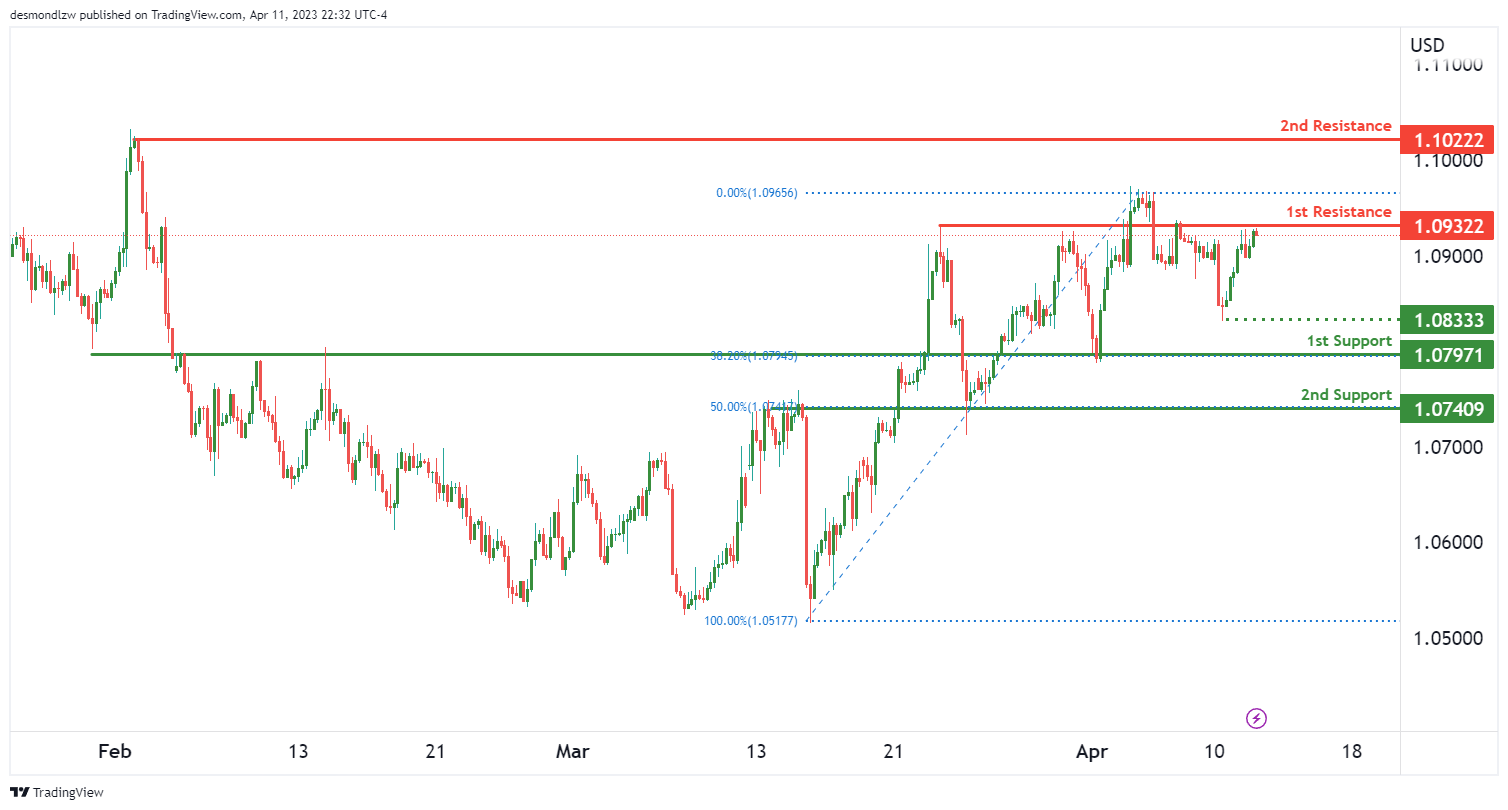
The EUR/USD chart is currently bearish. Price may potentially make a bearish reaction off the 1st resistance level and drop towards the 1st support level.
The 1st support level is at 1.0797, which is a strong overlap support level and also coincides with the 38.20% Fibonacci retracement level. The 2nd support level is at 1.0740, which is another overlap support level and also coincides with the 50% Fibonacci retracement level. These are both good levels for price to potentially bounce off of if it were to drop.
On the other hand, the 1st resistance level is at 1.0932, which is an overlap resistance level. The 2nd resistance level is at 1.1022, which is a swing high resistance level. If price were to break above the 1st resistance, it could potentially rise towards the 2nd resistance. However, if price were to drop below the 1st support, it could fall towards the 2nd support.
In addition to these levels, there is an intermediate support level at 1.0833, which is a swing low support level
GBP/USD:
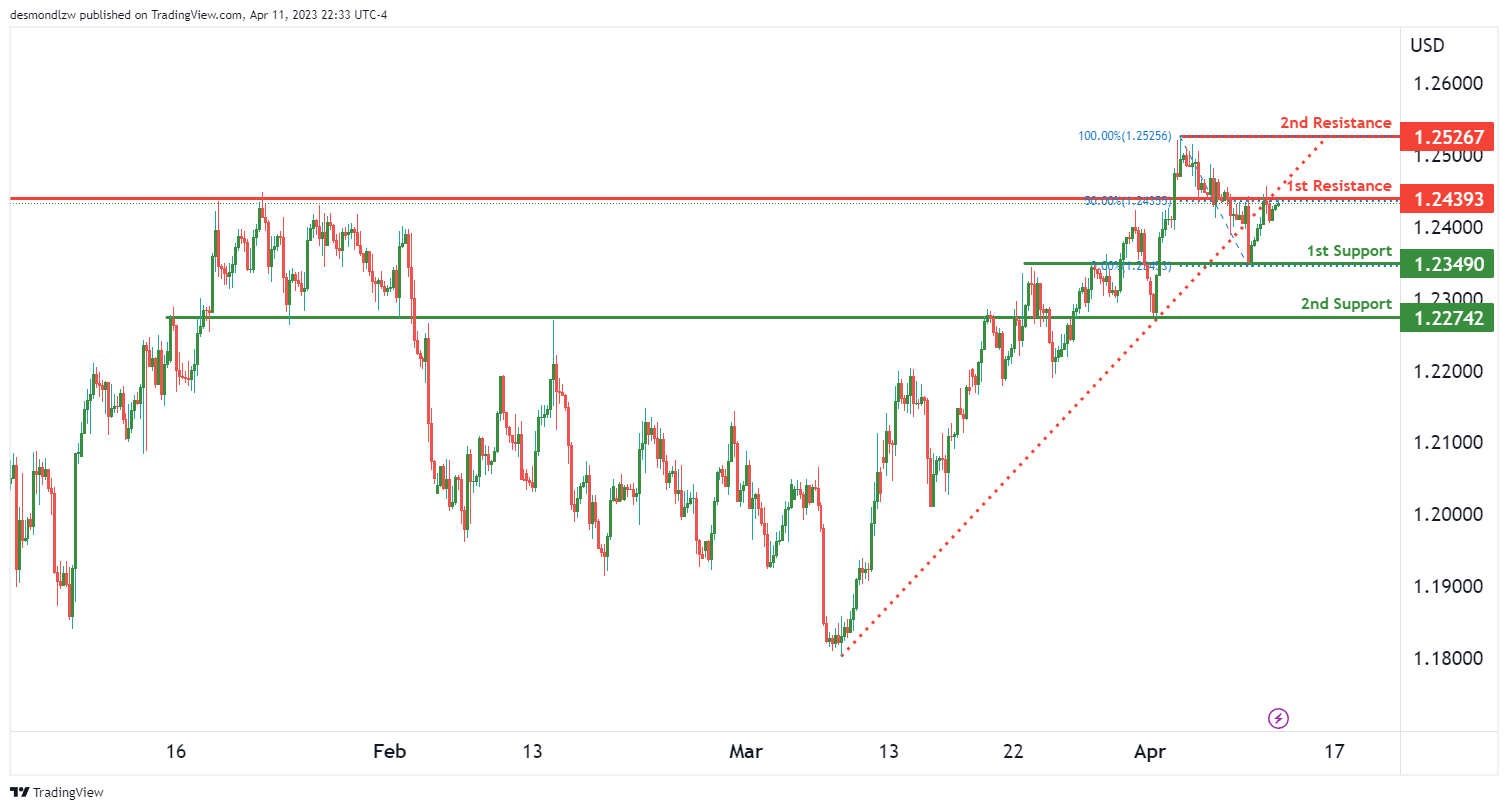
The GBP/USD currency pair is currently showing bearish momentum on the chart, with the price having broken below an ascending support line, which could indicate the potential for a bearish move. If the price continues to trend downwards, it could potentially make a bearish reaction off the first resistance level and drop to the first support level.
The first support level is at 1.2349, and it is an overlap support level, which means that it has acted as support in the past and may do so again in the future.
The second support level is at 1.2274 and is also an overlap support level. If the price were to continue falling, it could potentially find support at this level as well.
The first resistance level is at 1.2439, and it is an overlap resistance level that coincides with the 50% Fibonacci retracement level. If the price were to rise and reach this level, it could potentially face resistance and begin to drop towards the support levels.
The second resistance level is at 1.2526, and it is a multi-swing high resistance level, which means that it has acted as resistance in the past and may continue to do so in the future.
USD/CHF:
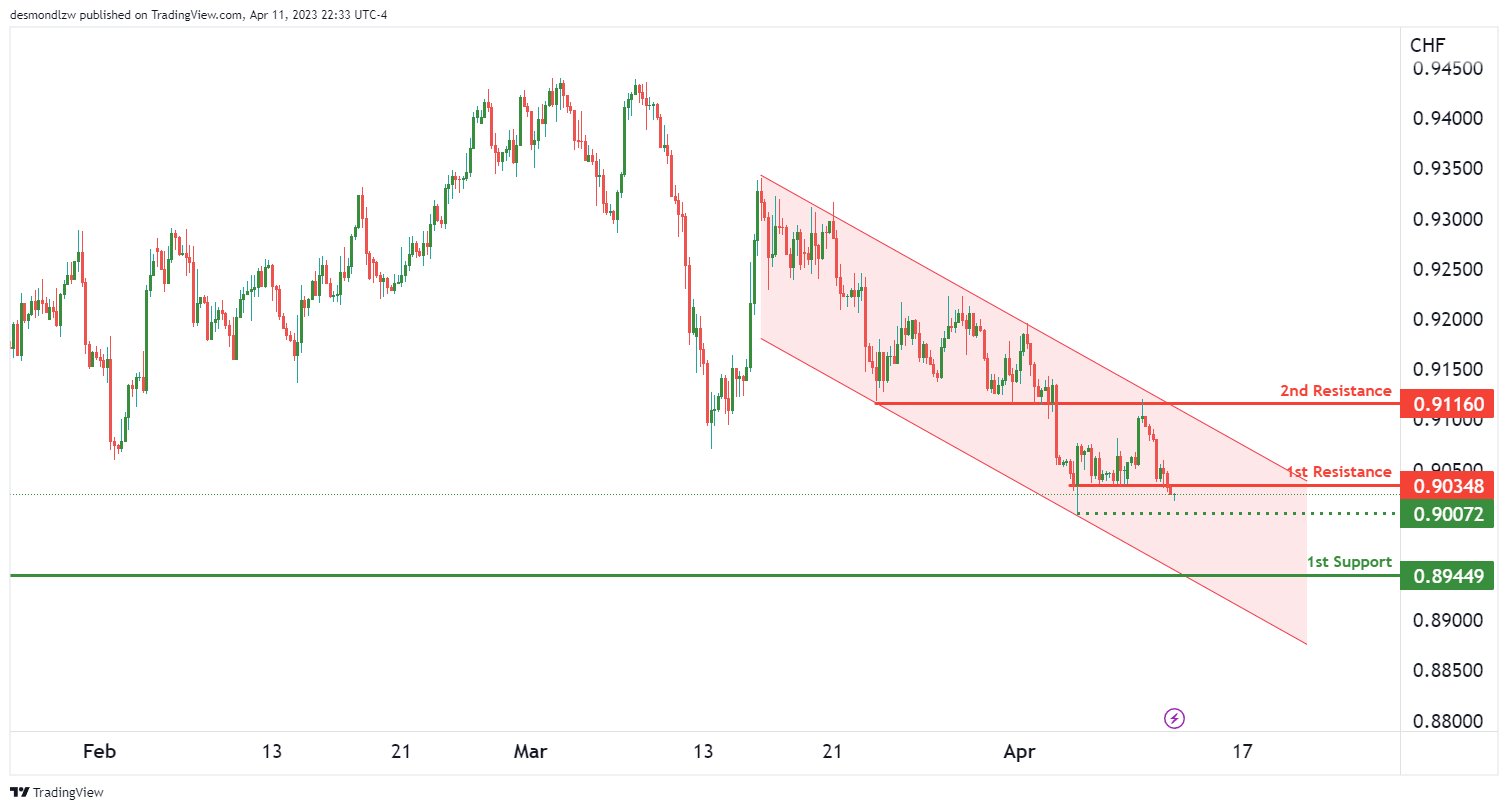
USD/CHF Could Potentially Continue its Bearish Momentum
The overall momentum of USD/CHF’s chart is currently bearish, with price currently in a descending channel. This bearish momentum may continue as long as price remains within this channel.
If we take a look at the current price action, it suggests that USD/CHF could potentially drop towards the 1st support level at 0.8944. This level is a strong overlap support, making it a good potential target for a bearish move. Another support level to watch out for is the intermediate support at 0.9007, which is a swing low support.
On the other hand, if price manages to break out of the descending channel, it may rise towards the 1st resistance level at 0.9034. This level is a pullback resistance and could potentially act as a ceiling for bullish price action. A break above this level may push price towards the 2nd resistance level at 0.9116, which is an overlap resistance.
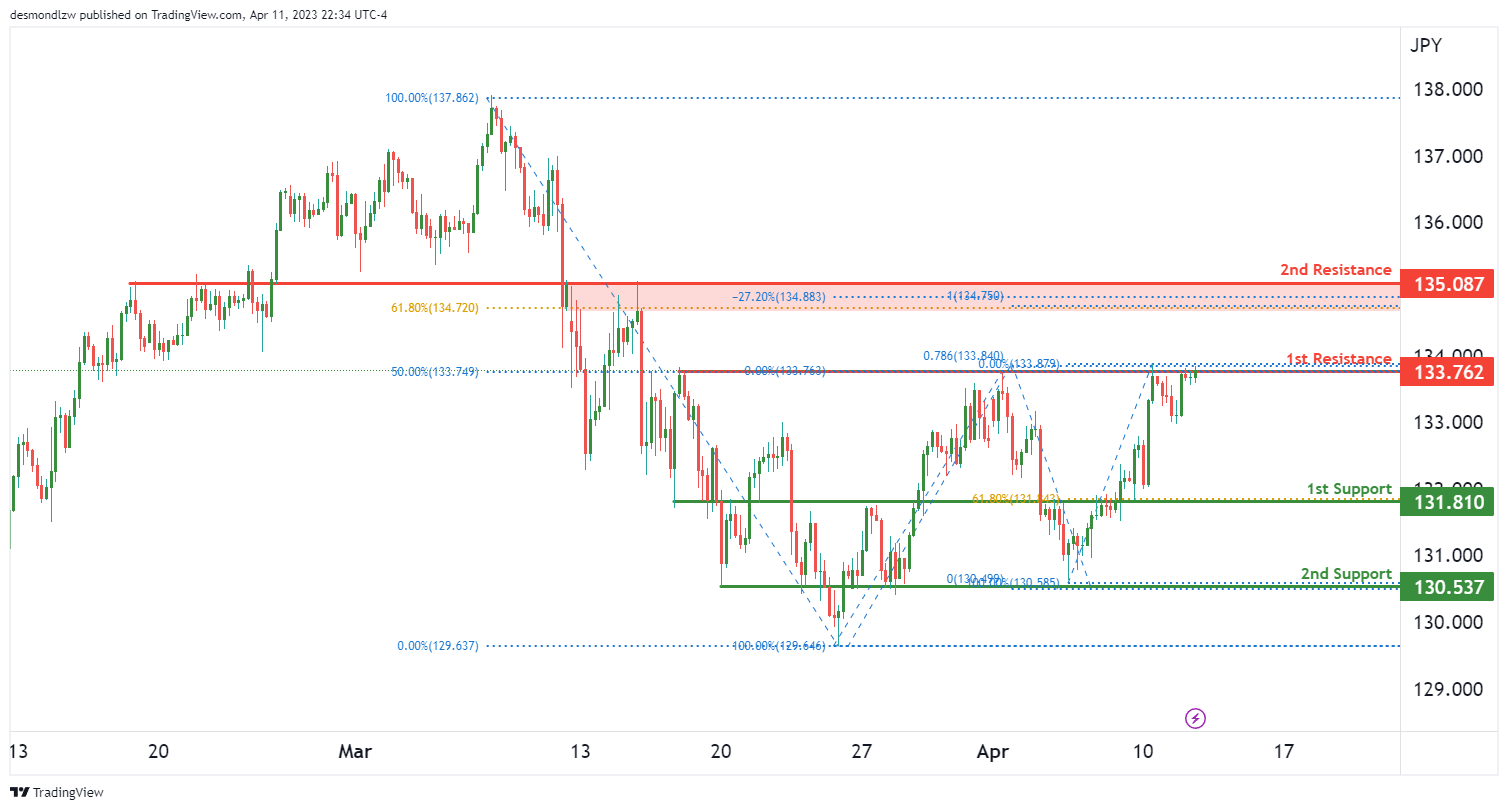
USD/JPY:
USD/JPY continues to see bearish momentum as the overall bias remains bearish. The price is potentially going to make a bearish reaction off the 1st resistance at 133.7600 and drop to the 1st support at 131.8100.
The 1st support level at 131.8100 is a strong overlap support, and it also coincides with the 61.80% Fibonacci retracement level, which makes it a critical support level for the pair. If the price bounces from this support level, it could potentially rise towards the 1st resistance at 133.7600.
However, if the price fails to hold at the 1st support level, the next support level it could drop to is the 2nd support at 130.5300, which is also an overlap support level.
In terms of resistance, the 1st resistance level at 133.7600 is an overlap resistance level, and it coincides with the 50% Fibonacci retracement level, making it a strong resistance level for the pair. If the price breaks through this resistance level, it could potentially rise towards the 2nd resistance at 135.0800, which is another overlap resistance level and coincides with the 61.80% Fibonacci retracement level.
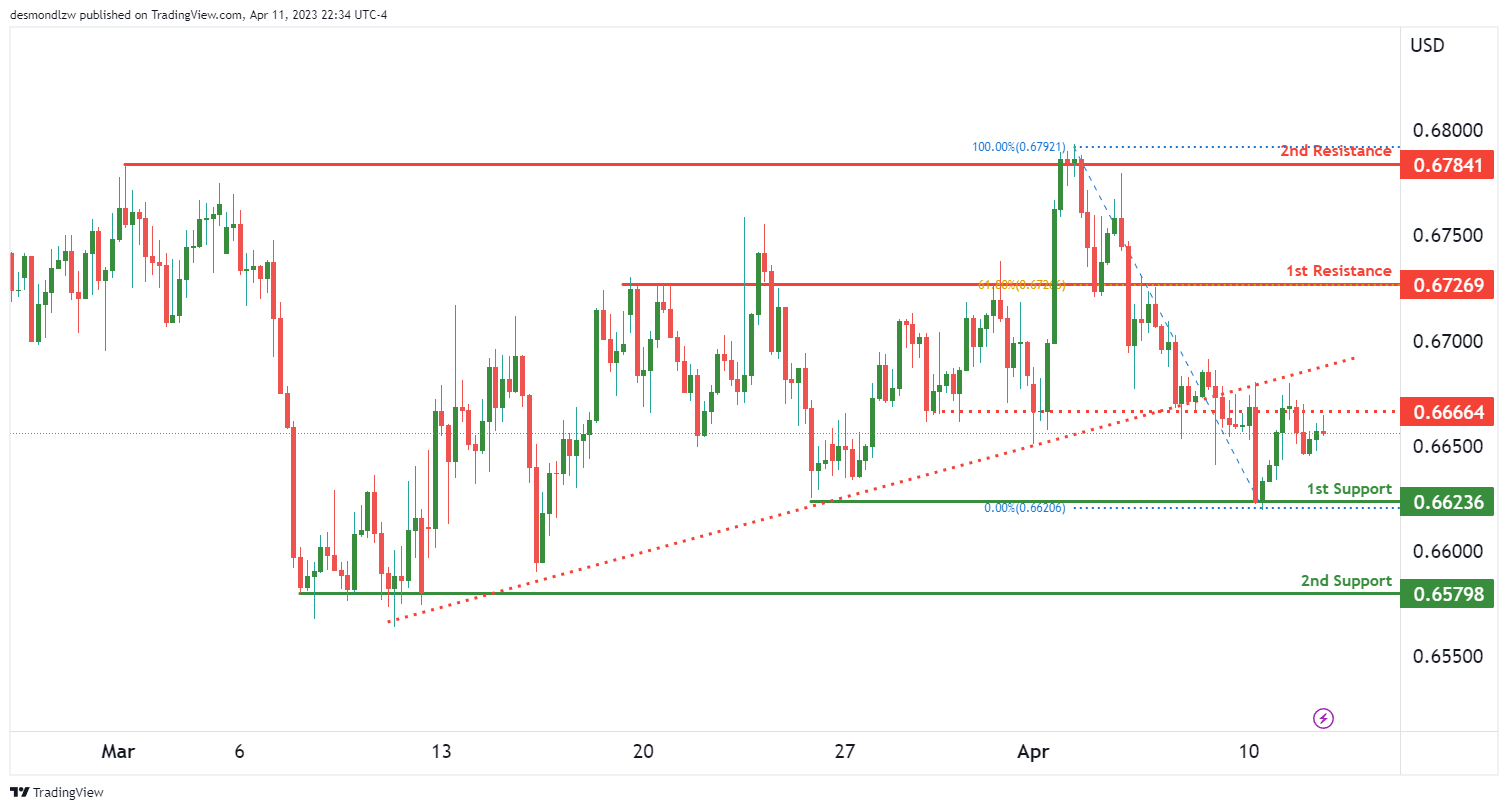
AUD/USD:
The AUD/USD chart is currently showing a bearish bias, as price is below a major descending trend line, indicating that bearish momentum may be on the horizon.
If price were to continue its bearish trend, it could potentially react off the 1st resistance at 0.6726 and drop towards the 1st support at 0.6623, which is a multi-swing low support level. If this level is broken, the next support could be the 2nd support at 0.6579, which also happens to be a multi-swing low support level.
On the other hand, if price were to break above the 1st resistance, it could potentially rise towards the 2nd resistance at 0.6784, which is a multi-swing high resistance level.
It’s worth noting that there is an intermediate resistance at 0.6666, which is between the current price and the 1st resistance. If price were to break this intermediate resistance, it could potentially trigger a stronger bullish acceleration towards the 2nd resistance.
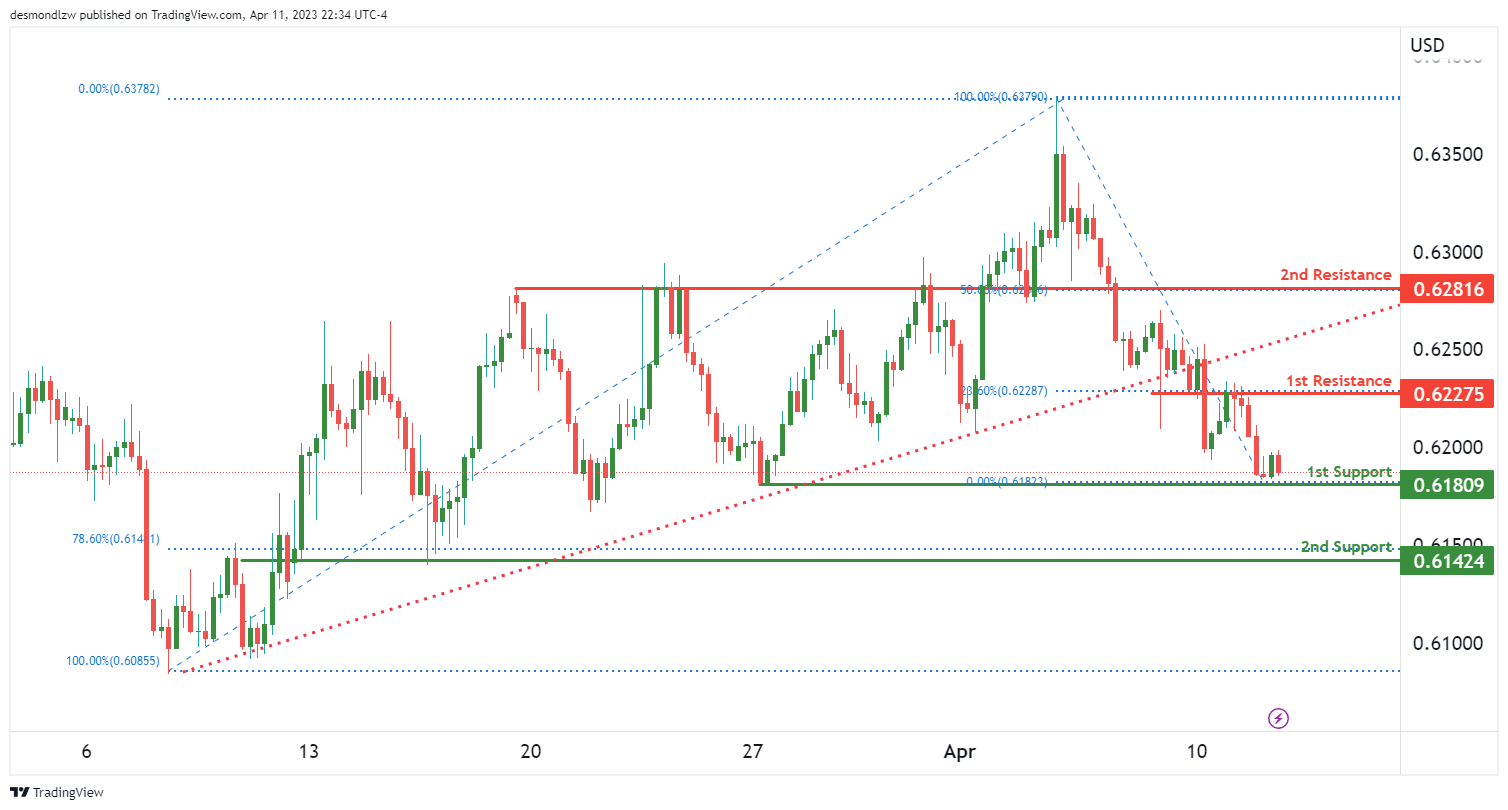
NZD/USD:
The NZD/USD currency pair has a bearish overall momentum, with the price currently below a major descending trend line. This suggests that bearish momentum is on the cards, and the price could potentially make a bearish break off the first support level and drop towards the second support level.
The first support level for NZD/USD is at 0.6180, which is a multi-swing low support. This level has held as support in the past and could potentially provide a bounce for the price. However, if the price were to break below this level, it could drop towards the second support level at 0.6142. This level is an overlap support and lines up with the 78.60% Fibonacci retracement, making it a strong potential support level.
On the resistance side, the first resistance level for NZD/USD is at 0.6227. This is an overlap resistance level and lines up with the 23.60% Fibonacci retracement. If the price were to break above this level, it could potentially rise towards the second resistance level at 0.6281. This level is also an overlap resistance level and lines up with the 50% Fibonacci retracement.
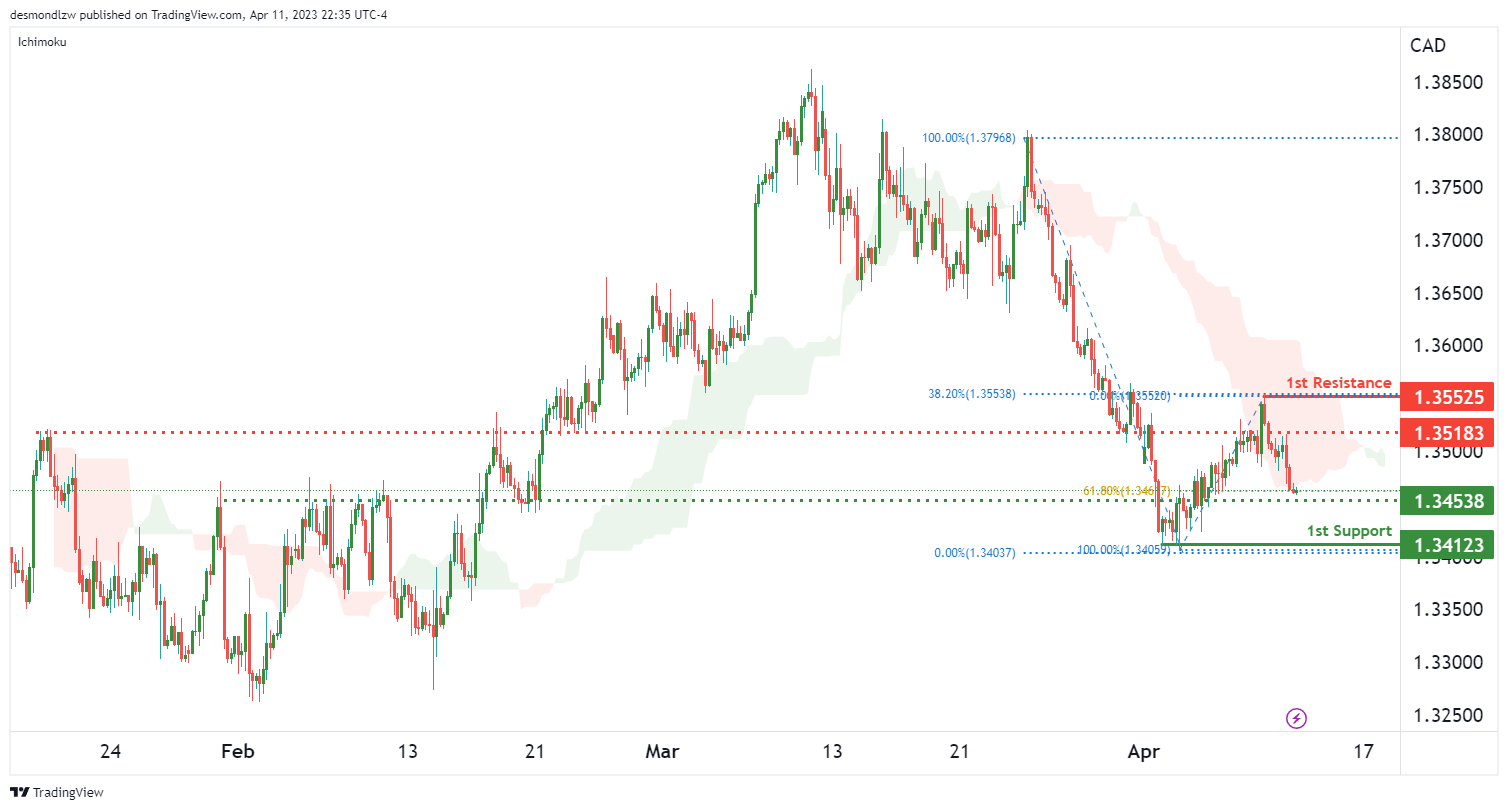
USD/CAD:
USD/CAD is currently exhibiting a bearish momentum, with price below the bearish Ichimoku cloud. This suggests a potential continuation of the downtrend.
If the bearish momentum continues, we may see a potential drop towards the 1st support at 1.3412, which is a multi-swing low support. Another potential support level to watch out for is the intermediate support at 1.3453, which is an overlap support and coincides with a 61.80% Fibonacci retracement.
On the other hand, in the event of a bullish reversal, USD/CAD may encounter resistance at the 1st resistance level of 1.3553. This is an overlap resistance level and lines up with a 38.20% Fibonacci retracement. Another potential resistance level to watch out for is the intermediate resistance at 1.3518, which is also an overlap resistance.
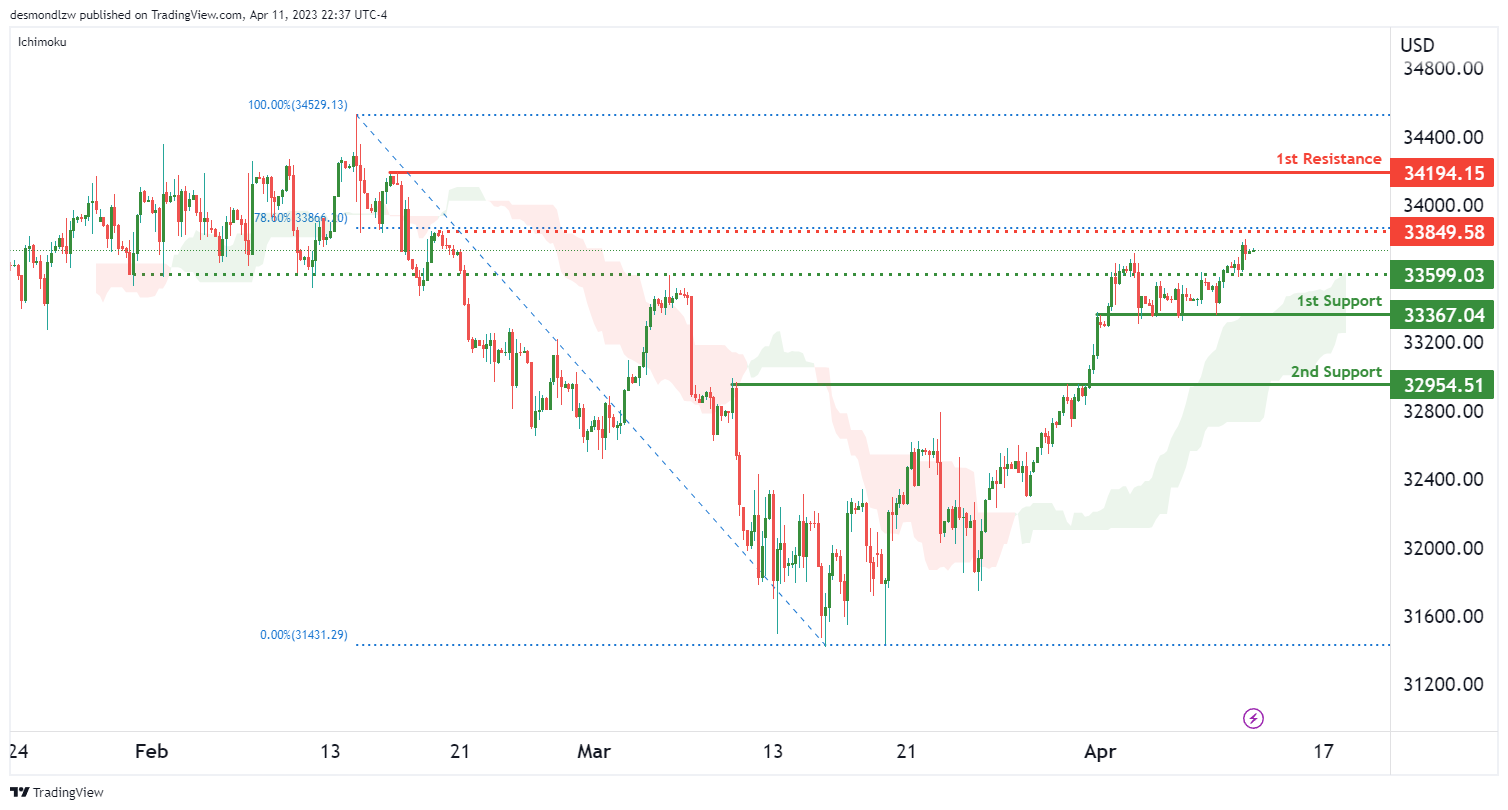
DJ30:
The DJ30 has shown overall bullish momentum as it has remained above the bullish Ichimoku cloud. This suggests that there might be further potential for prices to rise. There are a number of support and resistance levels that could potentially influence price action.
The first support level is at 33367.04, which is a strong overlap support level. Additionally, there is a pullback support level at 32954.51, which could provide further support in case of a price pullback. On the other hand, the first resistance level is at 34194.15, which is a significant swing high resistance level. If price were to break this level, it could potentially trigger a strong bullish momentum. In between the current price and the first resistance, there is an intermediate resistance level at 33849.58, which is an overlap resistance level and also lines up with a 78.60% Fibonacci retracement.
If price were to experience a pullback, it could potentially find support at the intermediate support level of 33567.03, which is also an overlap support level. Overall, the current momentum suggests further bullish continuation towards the first resistance level, but price action around the intermediate resistance and support levels should be closely monitored.
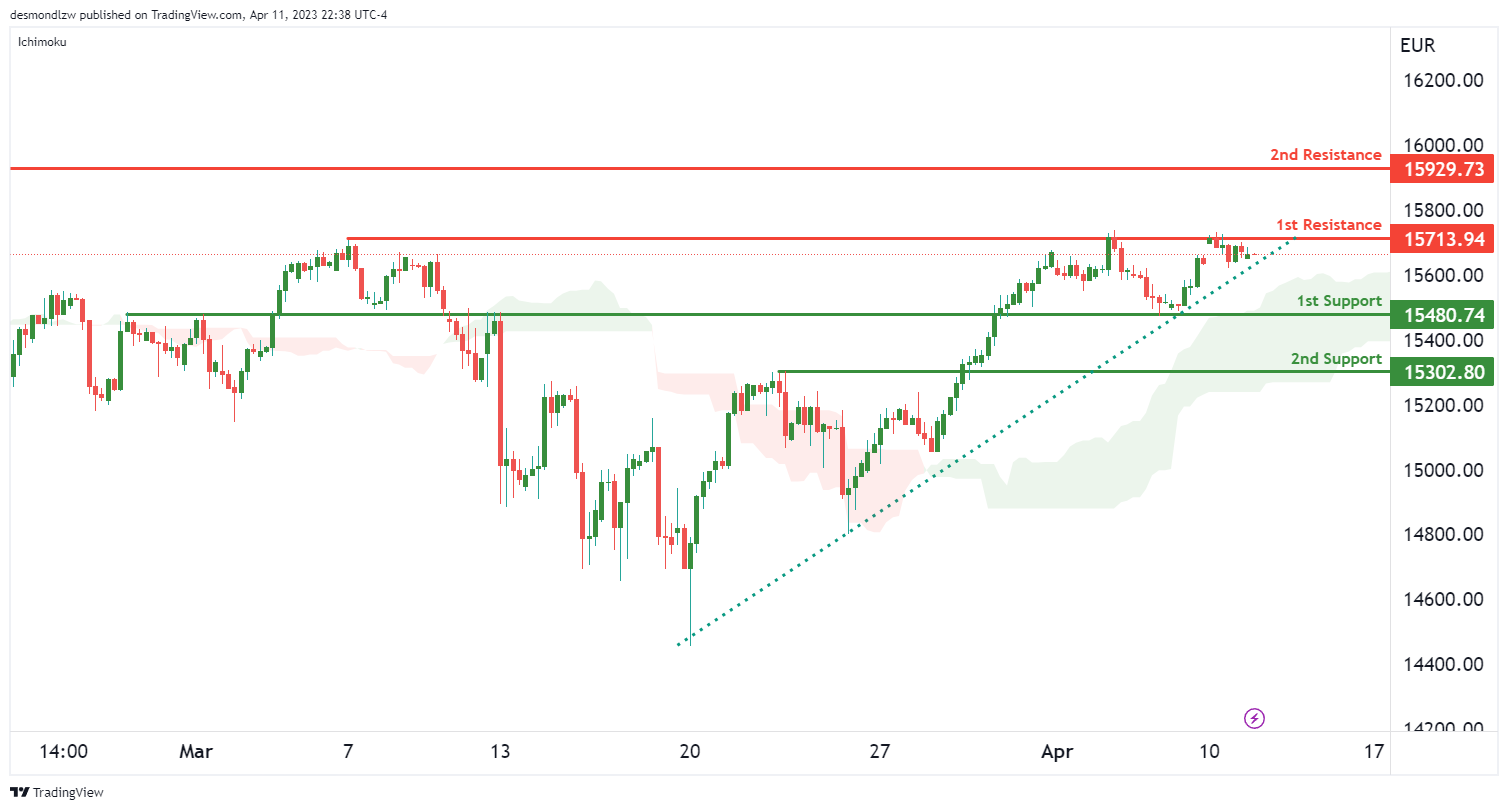
GER30:
The GER30 chart shows strong bullish momentum, with price currently above the bullish Ichimoku cloud and above a major ascending trend line, which suggests further bullish momentum is likely.
Price could potentially make a bullish continuation towards the 1st resistance level at 15713.94, which is a pullback resistance level. If price manages to break above this resistance, it could move towards the 2nd resistance level at 15929.73, which is a swing high resistance.
On the downside, the 1st support level is at 15480.74, which is an overlap support level on the ascending trend line acting as support. A bounce from this level could lead to a move towards the 1st resistance level. The 2nd support level is at 15302.80, which is a pullback support level.
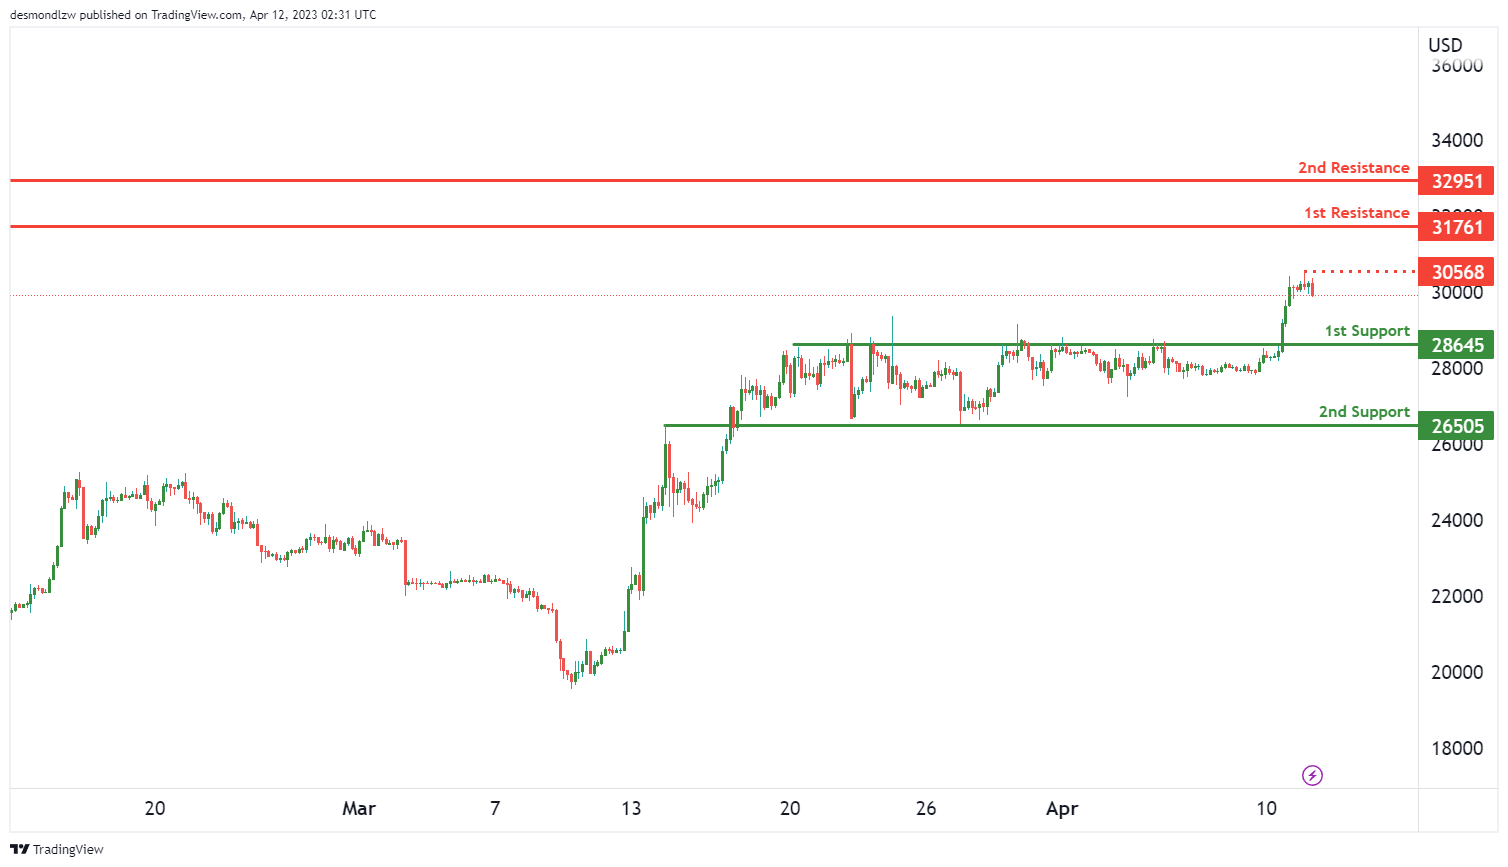
BTC/USD:
Bitcoin (BTC/USD) is currently experiencing a bullish momentum as seen on the overall chart. Price could potentially continue on this bullish path and aim towards the first resistance level at 31761.00.
In case of a pullback, the first support level is found at 28645.00 which is a strong pullback support. The second support level is at 26505.00 and is an overlap support.
The first resistance level at 31761.00 is a swing high resistance, making it a strong level of resistance. The second resistance level is at 32951.00 and is also a swing high resistance. It is worth noting that there is an intermediate resistance level at 30568.00 which could potentially slow down price action towards the first resistance level.
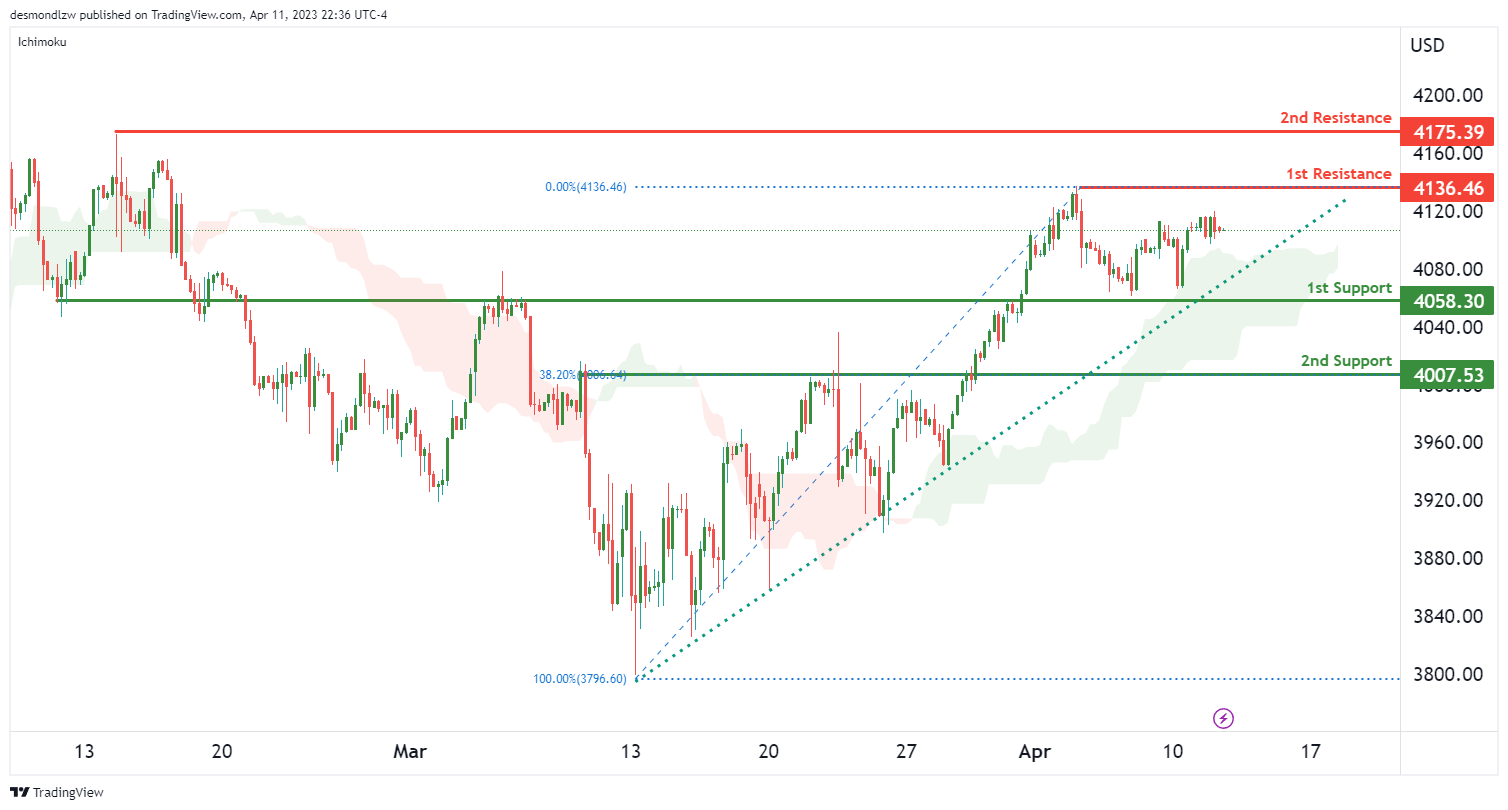
US500
The US500 chart currently displays a strong bullish momentum, as it sits above a major ascending trend line and the bullish Ichimoku cloud. These factors suggest that further bullish momentum could be on the horizon.
In terms of support levels, the first one to consider is the 4058.30 level, which is a strong overlap support and sits on the ascending trend line, further emphasizing its importance. Additionally, it has a 23.6% Fibonacci retracement lining up with it, making it an even stronger level to watch. The second support level to consider is the 4007.53 level, which is a pullback support and has a 38.2% Fibonacci retracement lining up with it.
On the other hand, there are also important resistance levels to watch. The first one is the 4136.46 level, which is a swing high resistance. This level could prove challenging for price to break through, but if it does, it may lead to a bullish continuation towards the next resistance level at 4175.39, another swing high resistance level.
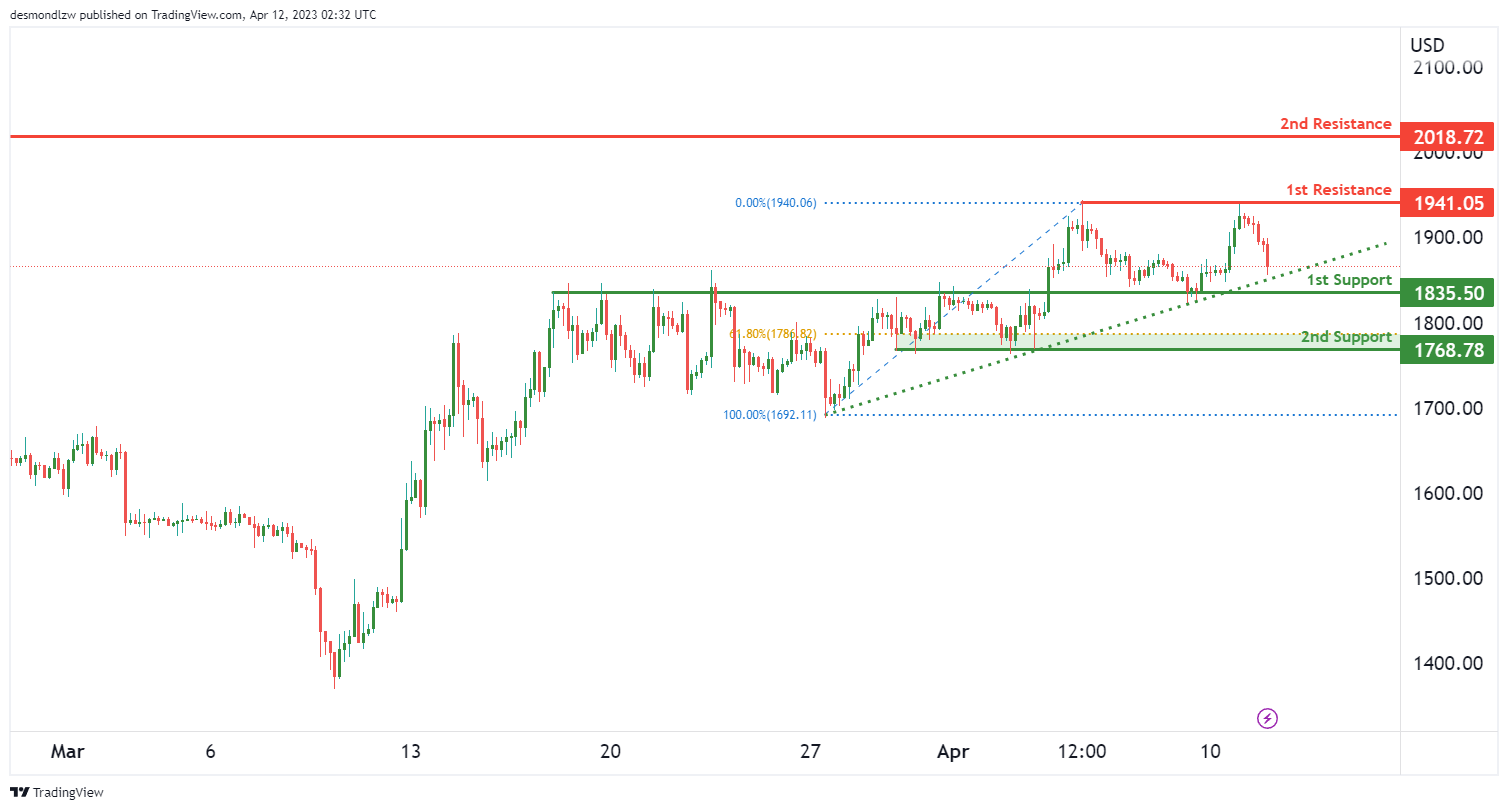
ETH/USD:
ETH/USD is currently exhibiting bullish momentum, supported by an ascending trend line. However, in the short term, the price could potentially drop to the 1st support level before bouncing back and rising to the 1st resistance level.
The first support level is at 1835.50, and it is a good level for a bounce because it coincides with an overlap support and an ascending trend line that acts as support. If the price drops to this level, it could potentially bounce back up.
The second support level is at 1768.78, and it is also a good level for a bounce because it coincides with a multi-swing low support and a 61.80% Fibonacci retracement.
On the other hand, the first resistance level is at 1941.05, and it is a multi-swing high resistance level. If the price breaks above this level, it could potentially rise to the second resistance level at 2018.72, which is a swing high resistance level.
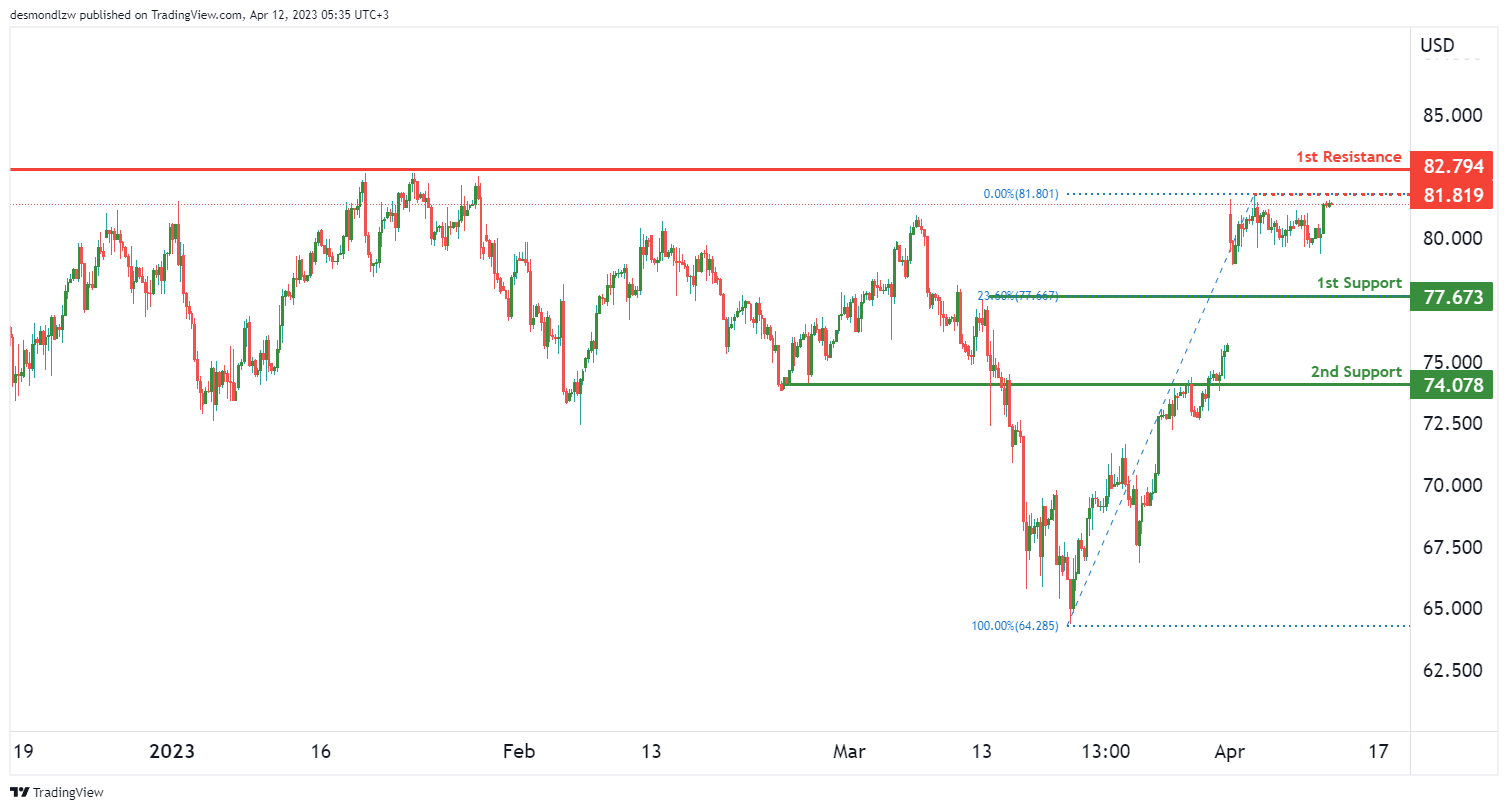
WTI/USD:
WTI prices have been moving sideways, indicating a neutral momentum. There’s potential for price to continue fluctuating between the 1st resistance at 82.79 and the 1st support at 77.67. The 1st support level is an overlap support and is supported by a 23.60% Fibonacci retracement. A break of the 1st support could trigger a further drop towards the 2nd support at 74.07 which is also an overlap support. On the other hand, a break of the 1st resistance might lead to a bullish acceleration towards the intermediate resistance at 81.81 which is a swing high resistance. Above that, we have the 2nd resistance level at 82.79 which is a multi-swing high resistance. It’s important to note that since the momentum is neutral, there isn’t a clear trend pushing price in a certain direction, therefore breakouts of these levels might not be high conviction in nature
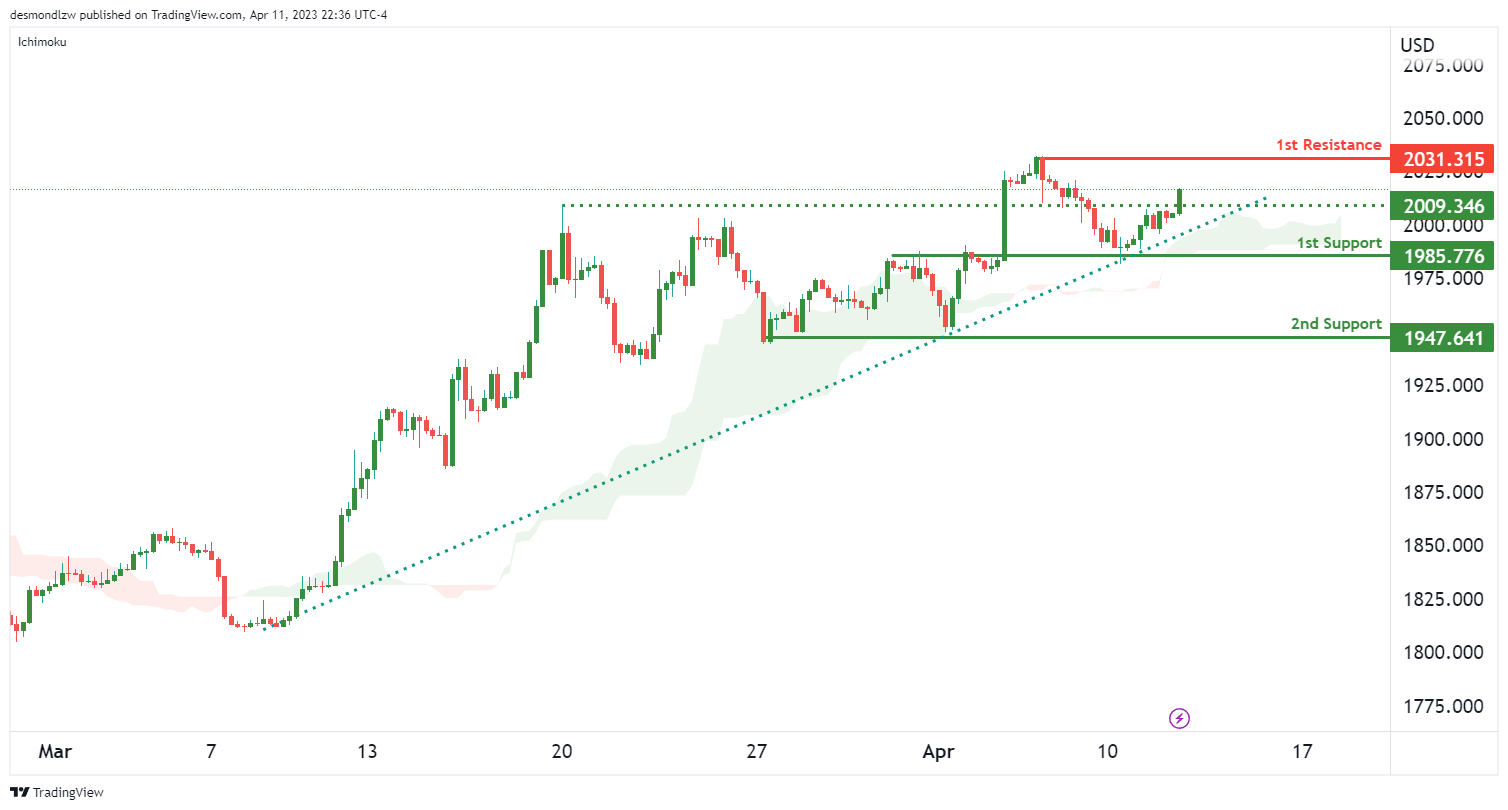
XAU/USD (GOLD):
Gold prices have been showing a bullish momentum, being above the Ichimoku cloud and an ascending trend line. This suggests that prices may rise further. In the short term, prices could potentially make a bullish continuation towards the 1st resistance level. The 1st support level is currently at 1985.77, which is a strong overlap support and also lies on the ascending trend line, further supporting its validity. The 2nd support level is at 1947.64, which is a multi-swing low support that price has bounced off multiple times in the past.
On the upside, the 1st resistance level is at 2031.31, which is a swing high resistance that could act as a potential barrier for prices. Additionally, there is an intermediate support at 2009.34, which is a pullback support. If prices were to break below this intermediate support, it could trigger a move down towards the 2nd support at 1947.64.
Overall, the bias for Gold prices is bullish and prices could continue to rise towards the 1st resistance level. However, a break below the intermediate support level could potentially signal a shift in momentum towards the downside.


