
DXY:
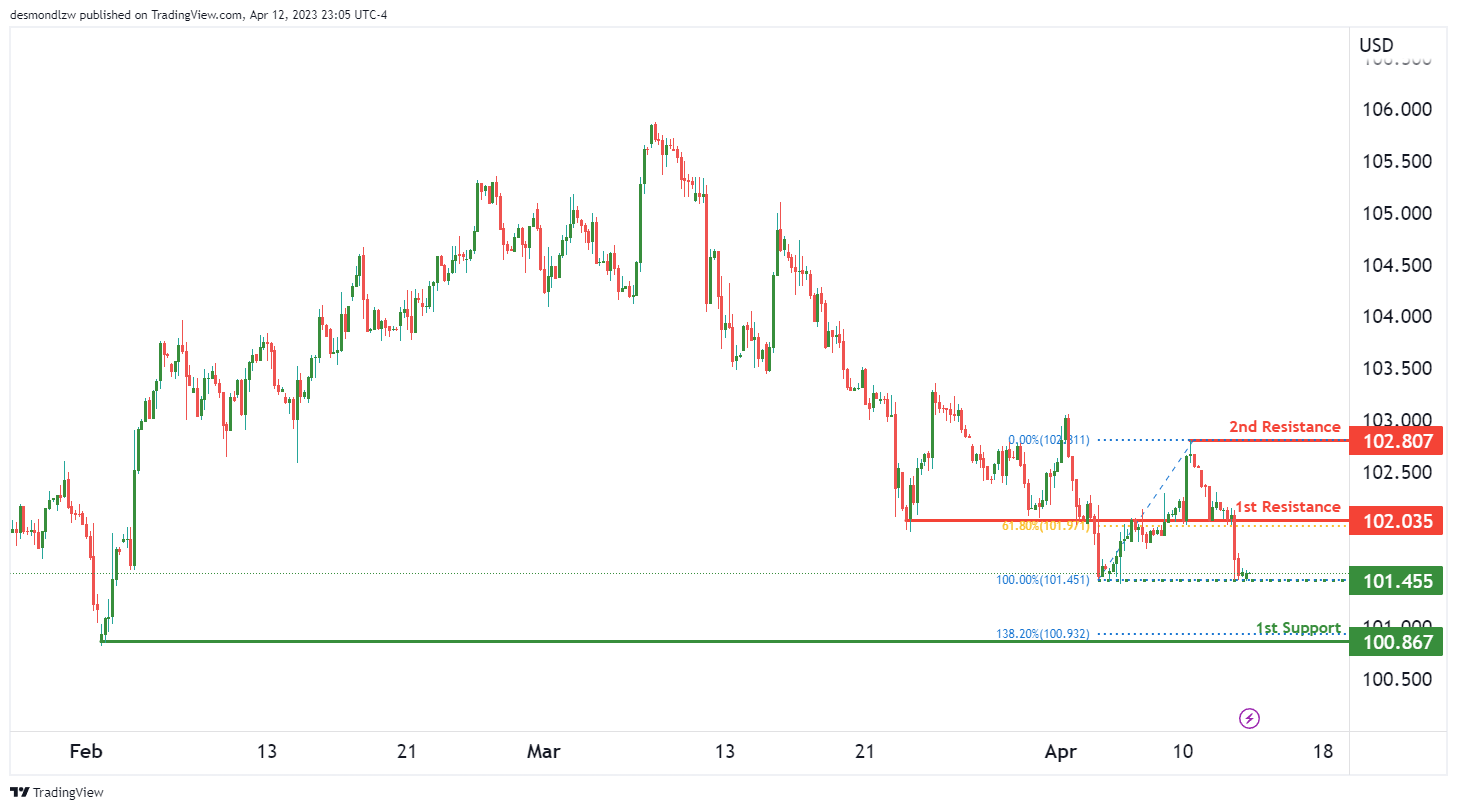
The momentum of the DXY chart is currently bearish, which suggests that we may see further price drops in the near future. At the time of writing, the price is trading around 101.63.
If the bearish trend continues, the price could potentially make a bearish continuation towards the 1st support level of 100.86. This support level is a swing low support and also coincides with a 138.20% Fibonacci Expansion level, which makes it a strong level of support.
If the price breaks through the 1st support level, the next support level is the intermediate support level at 101.45, which is a multi-swing low support level that the price has bounced off multiple times in the past. This level is also a good level of support, as it has been tested multiple times before.
On the resistance side, we have the 1st resistance level at 102.03. This is an overlap resistance level, as well as a 61.80% Fibonacci Retracement level, which makes it a strong level of resistance that the price may struggle to break through.
If the price were to break through the 1st resistance level, the next resistance level is the 2nd resistance level at 102.80, which is a swing high resistance level. This level marks the high point of a previous bullish trend, and therefore it may also be a strong resistance level.
EUR/USD:
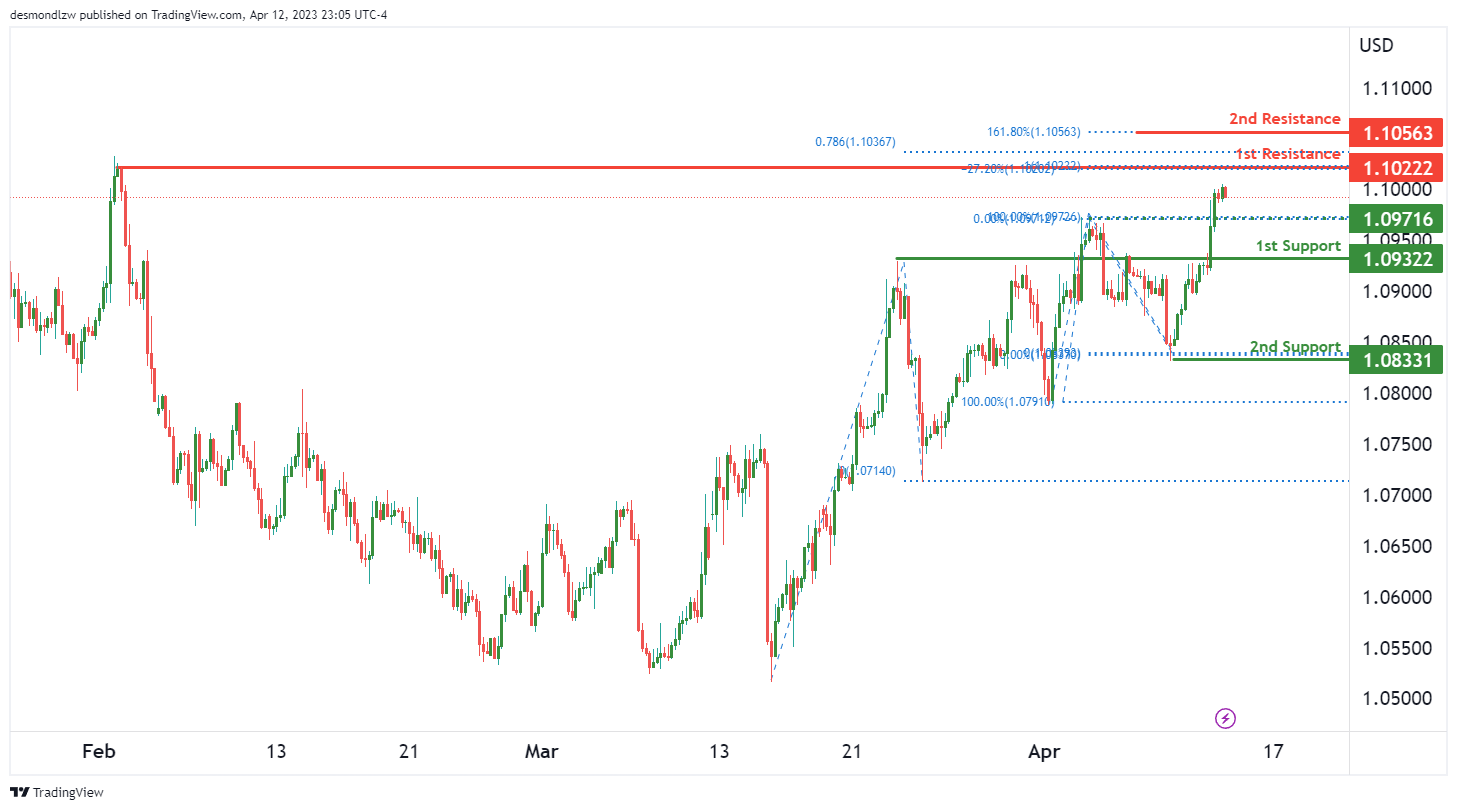
The EUR/USD chart is currently bullish, which suggests that we may see further price increases in the near future. At the time of writing, the price is trading around 1.0985.
If the bullish trend continues, the price could potentially make a bullish continuation towards the 1st resistance level of 1.1022. This resistance level is a swing high resistance and also coincides with a -27% Fibonacci Expansion level, which makes it a strong level of resistance.
If the price breaks through the 1st resistance level, the next resistance level is the 2nd resistance level at 1.1056, which is a swing high resistance level that marks the high point of a previous bullish trend. This level also coincides with a 161.80% Fibonacci Extension level, which makes it a strong level of resistance.
On the support side, we have the 1st support level at 1.0932, which is an overlap support level. This level has been tested multiple times before and has shown strength in holding the price up.
If the price were to drop further, the next support level is the 2nd support level at 1.0833, which is a swing low support level that the price has bounced off multiple times in the past. This level is also a good level of support, as it has been tested multiple times before.
It’s worth noting that there is an intermediate support level at 1.0971, which is a pullback support level. This level may provide a temporary halt to any downward momentum that the price may experience.
GBP/USD:
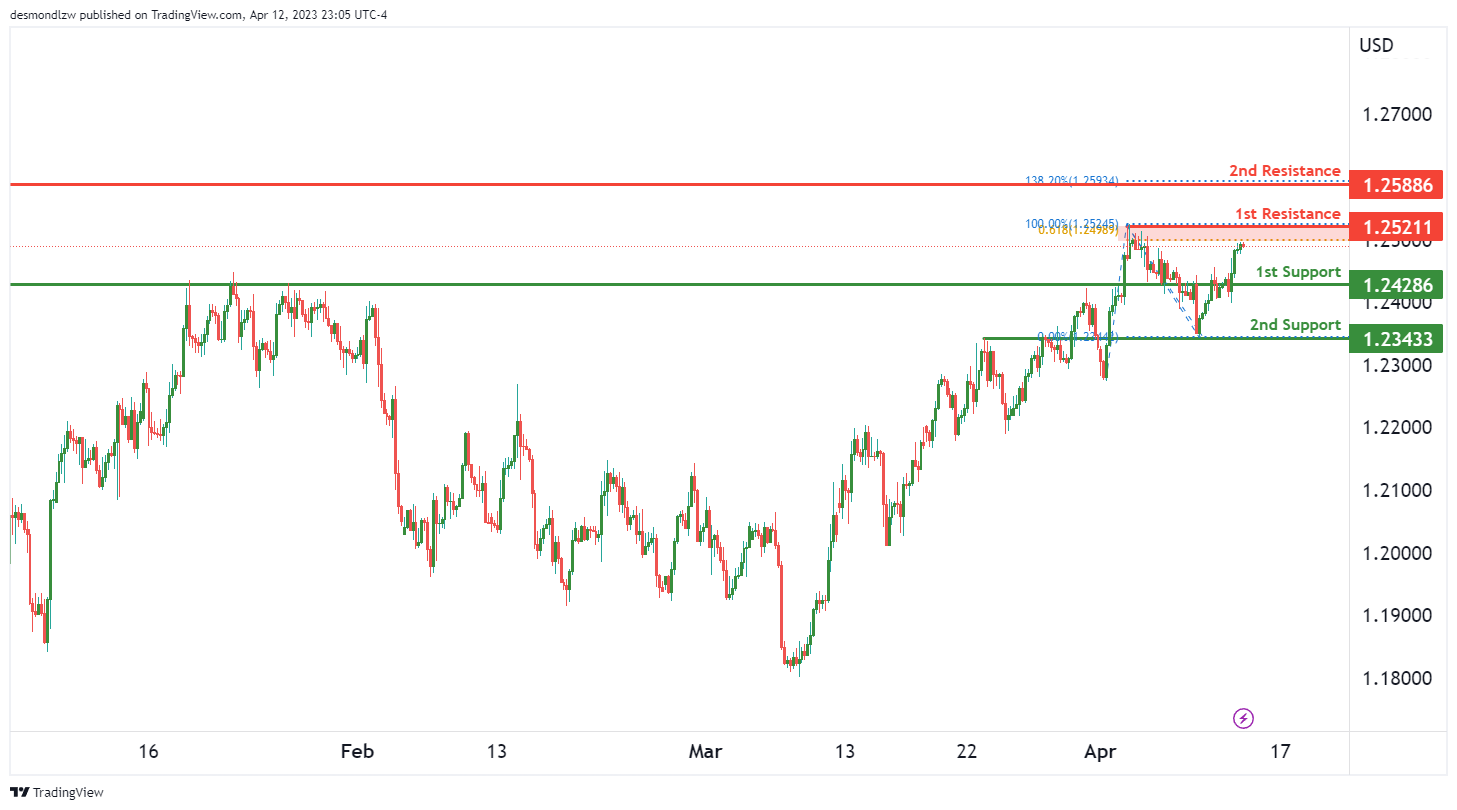
The GBP/USD chart is currently bearish, which suggests that we may see further price drops in the near future. At the time of writing, the price is trading around 1.2485.
If the bearish trend continues, the price could potentially make a bearish reaction off the 1st resistance level of 1.2521 and drop to the 1st support level of 1.2428. This support level is an overlap support level and has shown strength in holding the price up.
If the price were to break through the 1st support level, the next support level is the 2nd support level at 1.2343, which is also an overlap support level that the price has bounced off multiple times in the past.
On the resistance side, we have the 1st resistance level at 1.2521, which is a pullback resistance level and also coincides with a 61.80% Fibonacci Projection level. This makes it a strong level of resistance that the price may struggle to break through.
If the price were to break through the 1st resistance level, the next resistance level is the 2nd resistance level at 1.2588, which is a swing high resistance level that marks the high point of a previous bullish trend. This level also coincides with a 138.20% Fibonacci Extension level, which makes it a strong level of resistance.
USD/CHF:
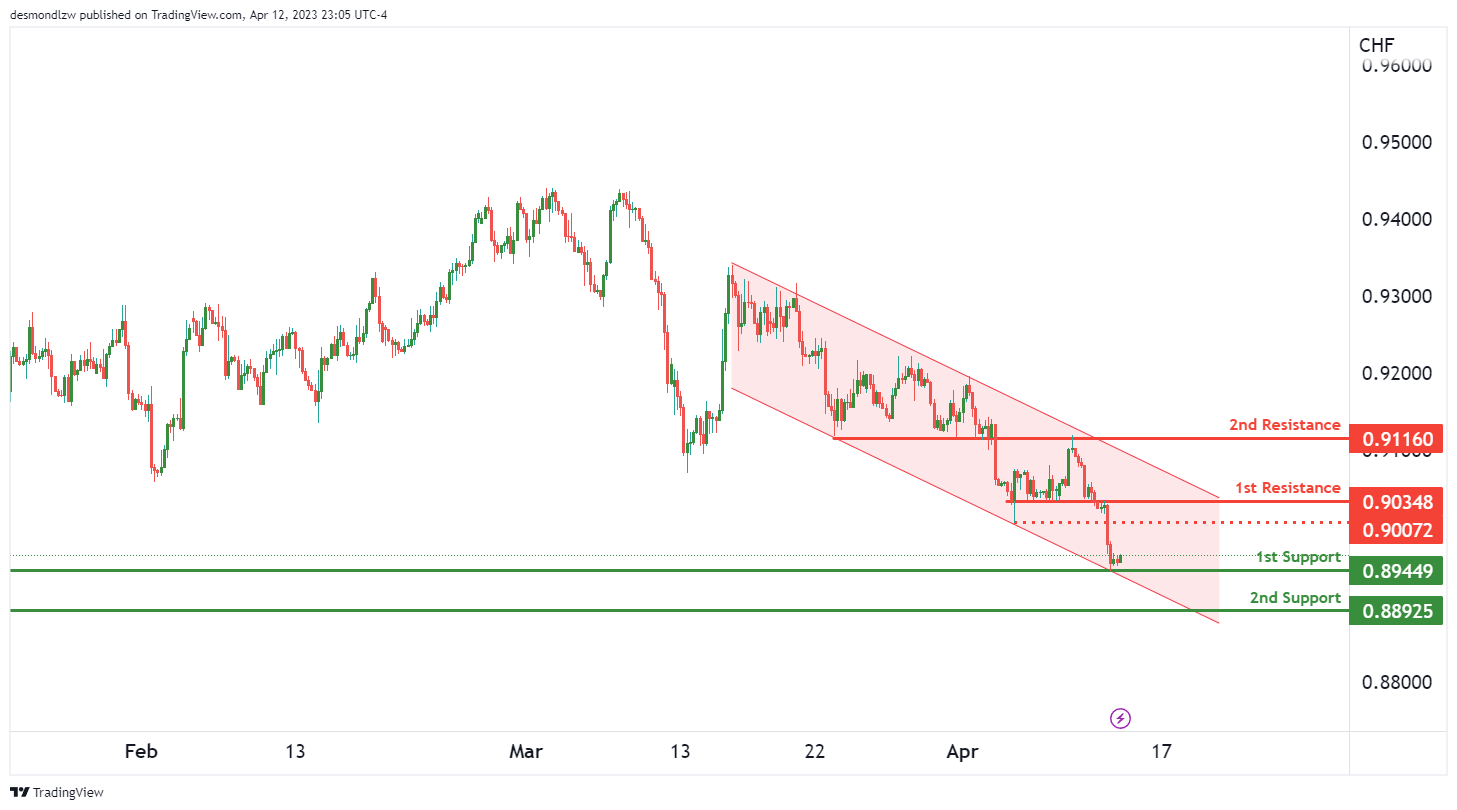
The USD/CHF chart is currently bearish, and this is supported by the fact that the price is in a bearish descending channel. At the time of writing, the price is trading around 0.8985.
If the bearish trend continues, the price could potentially make a bearish break off the 1st support level of 0.8944 and drop towards the 2nd support level of 0.8892. This support level is a swing low support level that the price has bounced off multiple times in the past.
If the price were to break through the 1st support level, it may further support the bearish momentum of the chart, especially given that the price is already in a bearish channel. This could potentially result in a drop towards the 2nd support level at 0.8892, which is also a strong level of support that the price may bounce off of.
On the resistance side, we have the 1st resistance level at 0.9034, which is a pullback resistance level. This level may provide a temporary halt to any upward momentum that the price may experience.
If the price were to break through the 1st resistance level, the next resistance level is the 2nd resistance level at 0.9116, which is an overlap resistance level that the price has struggled to break through in the past.
It’s worth noting that there is also an intermediate resistance level at 0.9007, which is a pullback resistance level. This level may provide a temporary halt to any upward momentum that the price may experience.
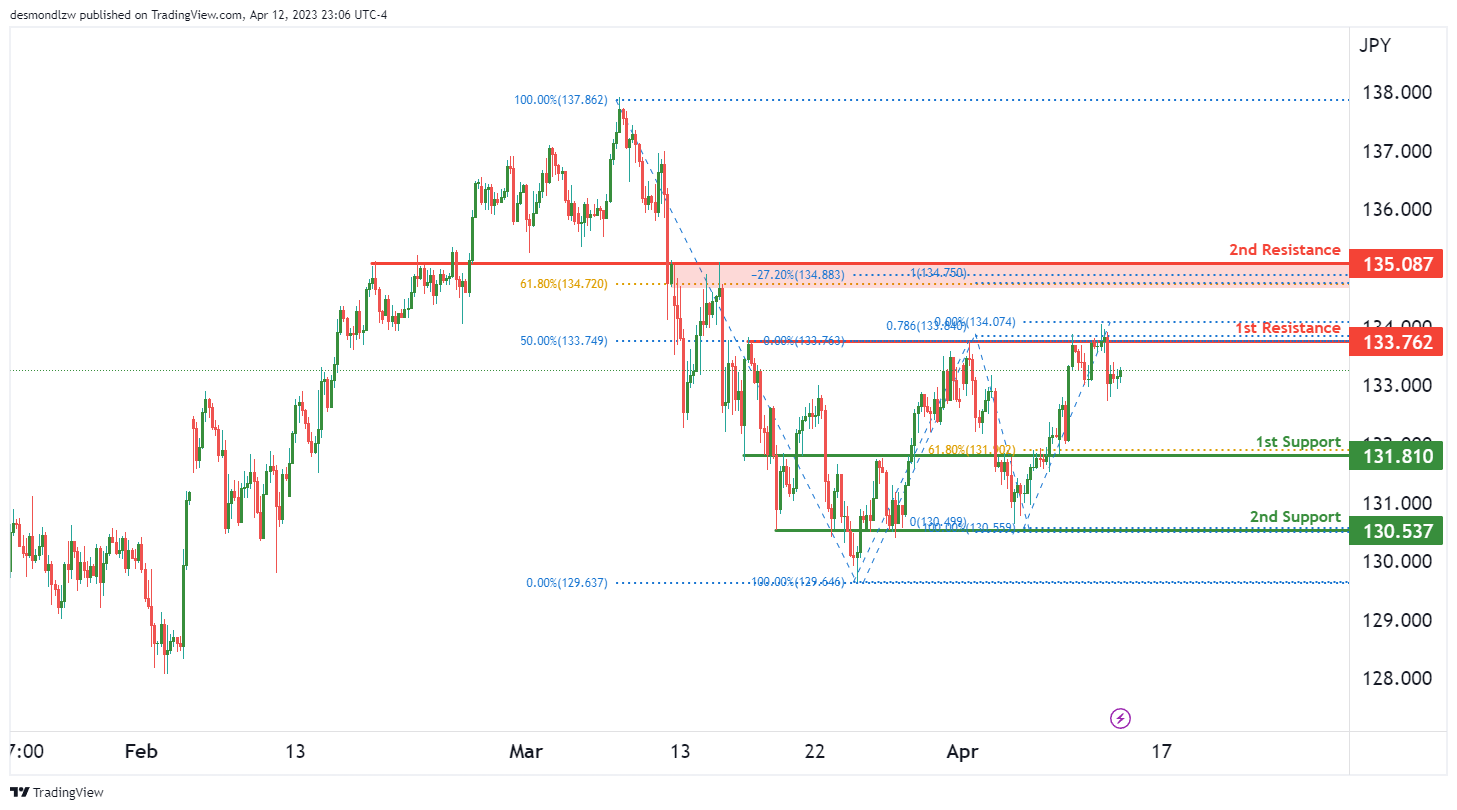
USD/JPY:
The USD/JPY chart currently shows bullish momentum, with the potential for further price rises in the near future. The current trading price is around 132.68.
However, there is also a possibility for a bearish continuation towards the 1st support level of 131.81. This support level has been tested multiple times in the past and is considered a strong level of support. Additionally, it coincides with a 61.80% Fibonacci Retracement level, further strengthening its significance.
If the price were to break through the 1st support level, the next level of support is the 2nd support level at 130.53. This is another overlap support level that the price has bounced off of in the past.
On the resistance side, we have the 1st resistance level at 133.76, which is an overlap resistance level that has proven to be difficult for the price to break through in previous attempts. This level also coincides with a 50% Fibonacci Retracement level, making it a strong level of resistance that may prevent the price from continuing its bullish momentum.
If the price were to break through the 1st resistance level, the next resistance level is the 2nd resistance level at 135.08. This is another overlap resistance level that the price may struggle to break through, as it also coincides with a 61.80% Fibonacci Retracement level.
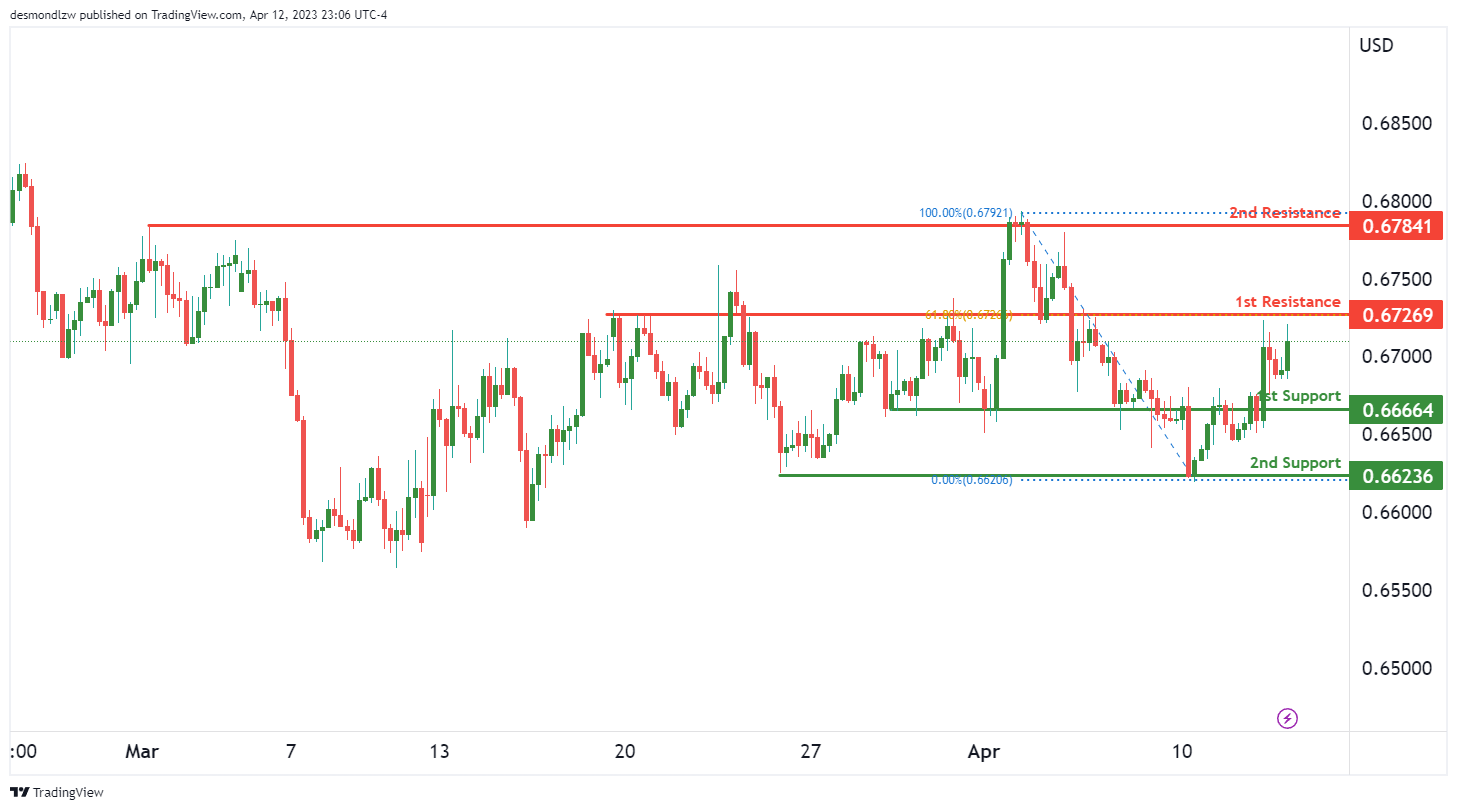
AUD/USD:
The AUD/USD chart is currently bullish, which suggests that we may see further price rises in the near future. At the time of writing, the price is trading around 0.6708.
There is a potential for a bullish continuation towards the 1st resistance level of 0.6726. This resistance level is an overlap resistance level that the price has struggled to break through in the past. Additionally, it coincides with a 61.80% Fibonacci Retracement level, making it a strong level of resistance that may be difficult for the price to break through.
If the price were to break through the 1st resistance level, the next resistance level is the 2nd resistance level at 0.6784, which is a multi-swing high resistance level. This level does not have any significant Fibonacci levels coinciding with it, but it has been a strong level of resistance in the past.
On the support side, we have the 1st support level at 0.6666, which is an overlap support level that the price has bounced off of in the past. The next level of support is the 2nd support level at 0.6623, which is a multi-swing low support level.
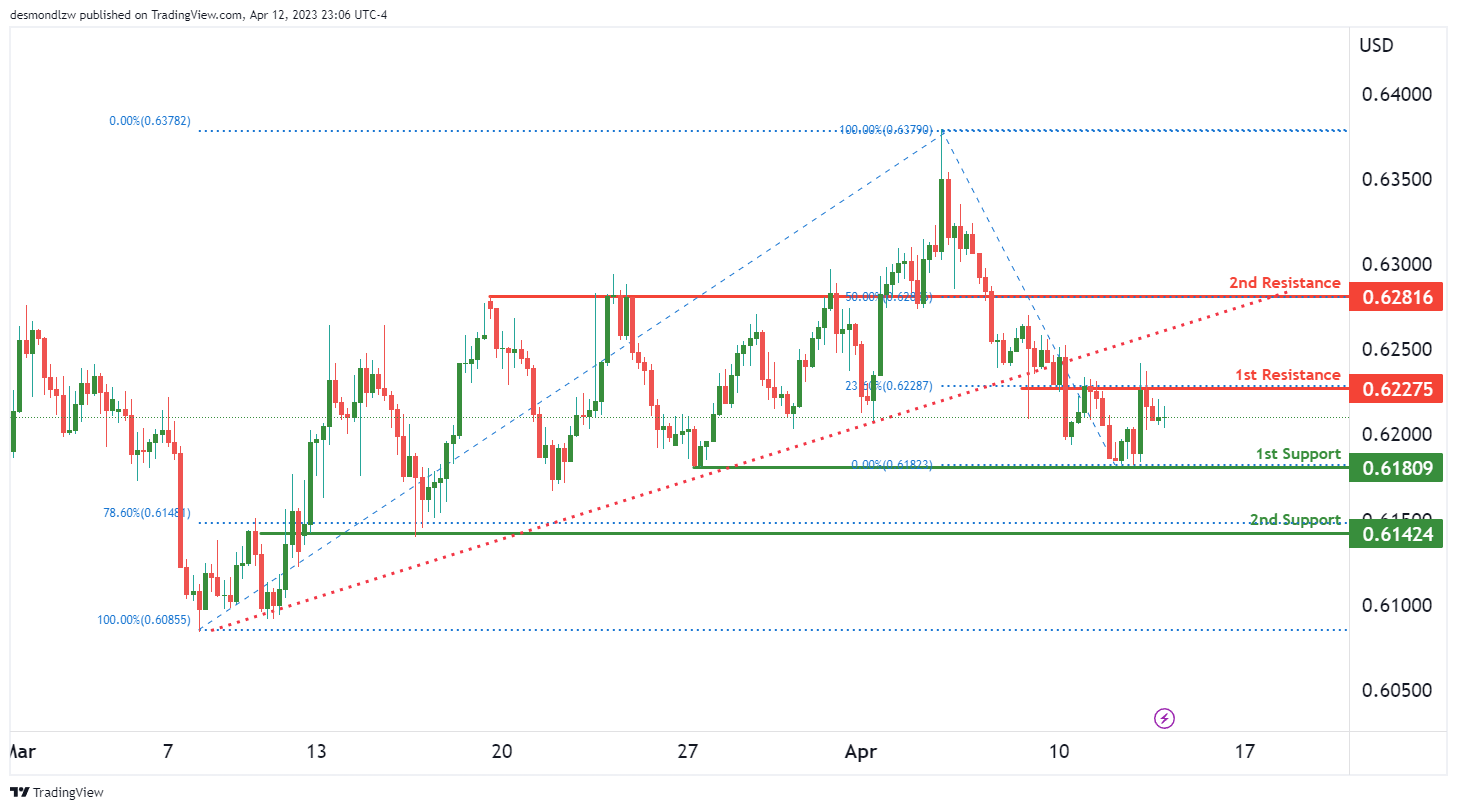
NZD/USD:
The overall momentum of the NZD/USD chart is currently bearish, triggered by a break below an ascending support line.
There is a potential for a bearish continuation towards the 1st support level of 0.6180. This support level is a multi-swing low support level, and if the price were to break through it, we could see a further drop towards the 2nd support level of 0.6142. This level is also an overlap support level and coincides with a 78.60% Fibonacci Retracement level.
On the resistance side, we have the 1st resistance level at 0.6227, which is an overlap resistance level. This level coincides with a 23.60% Fibonacci Retracement level, making it a relatively weak level of resistance. The next resistance level is the 2nd resistance level at 0.6281, which is an overlap resistance level and coincides with a 50% Fibonacci Retracement level.
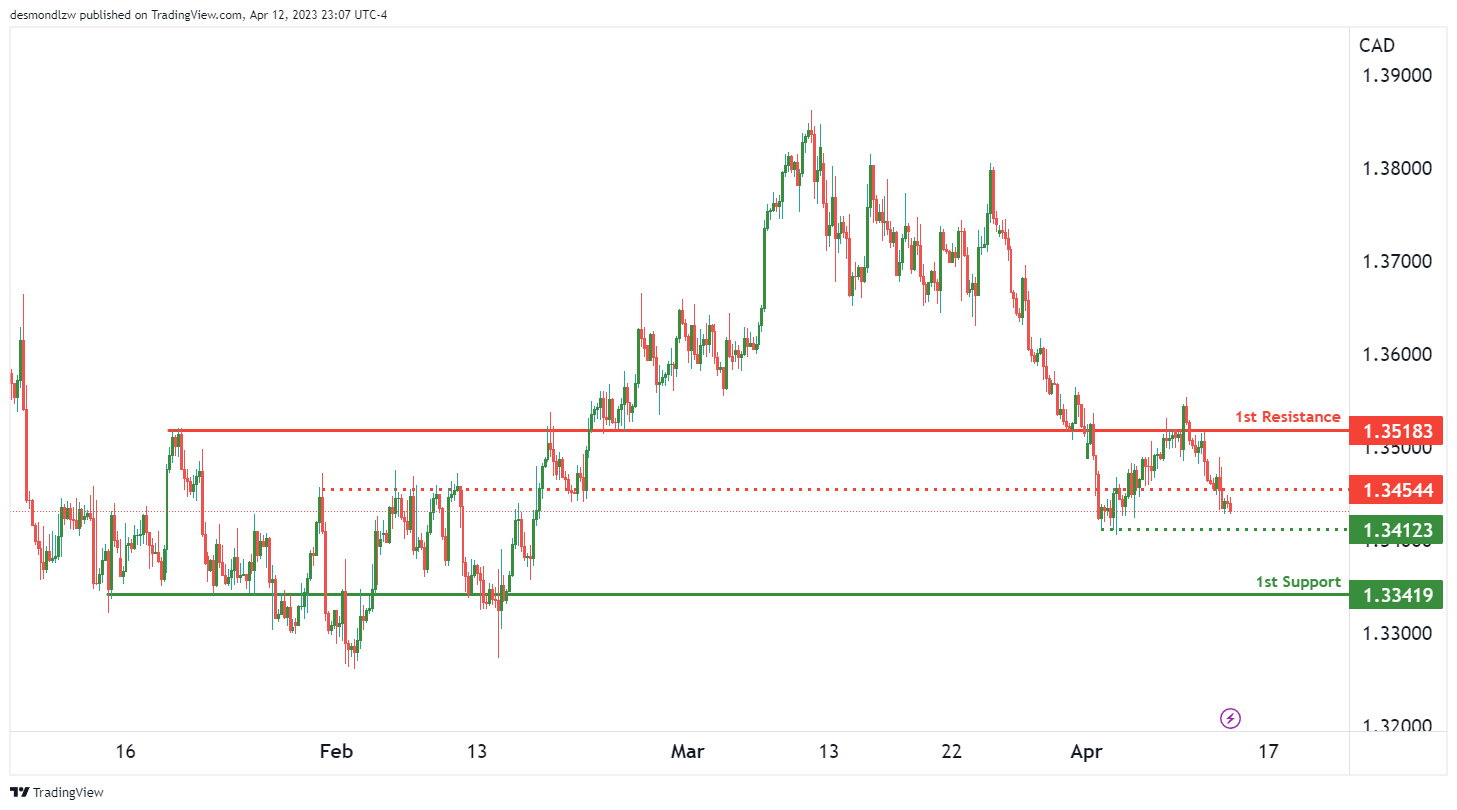
USD/CAD:
The USD/CAD chart is currently showing a bearish momentum, suggesting that we may see further price declines in the near future. At the time of writing, the price is trading around 1.3442.
There could potentially be a bearish continuation towards the 1st support level at 1.3341. This support level is an overlap support level that the price has bounced off multiple times in the past.
If the price were to break through the 1st support level, the next support level is the intermediate support level at 1.3412, which is a multi-swing low support level that the price has also bounced off multiple times in the past.
On the resistance side, we have the 1st resistance level at 1.3518, which is an overlap resistance level that the price has struggled to break through in the past.
If the price were to break through the 1st resistance level, the next resistance level is the intermediate resistance level at 1.3454, which is another overlap resistance level that the price may struggle to break through.
DJ30:
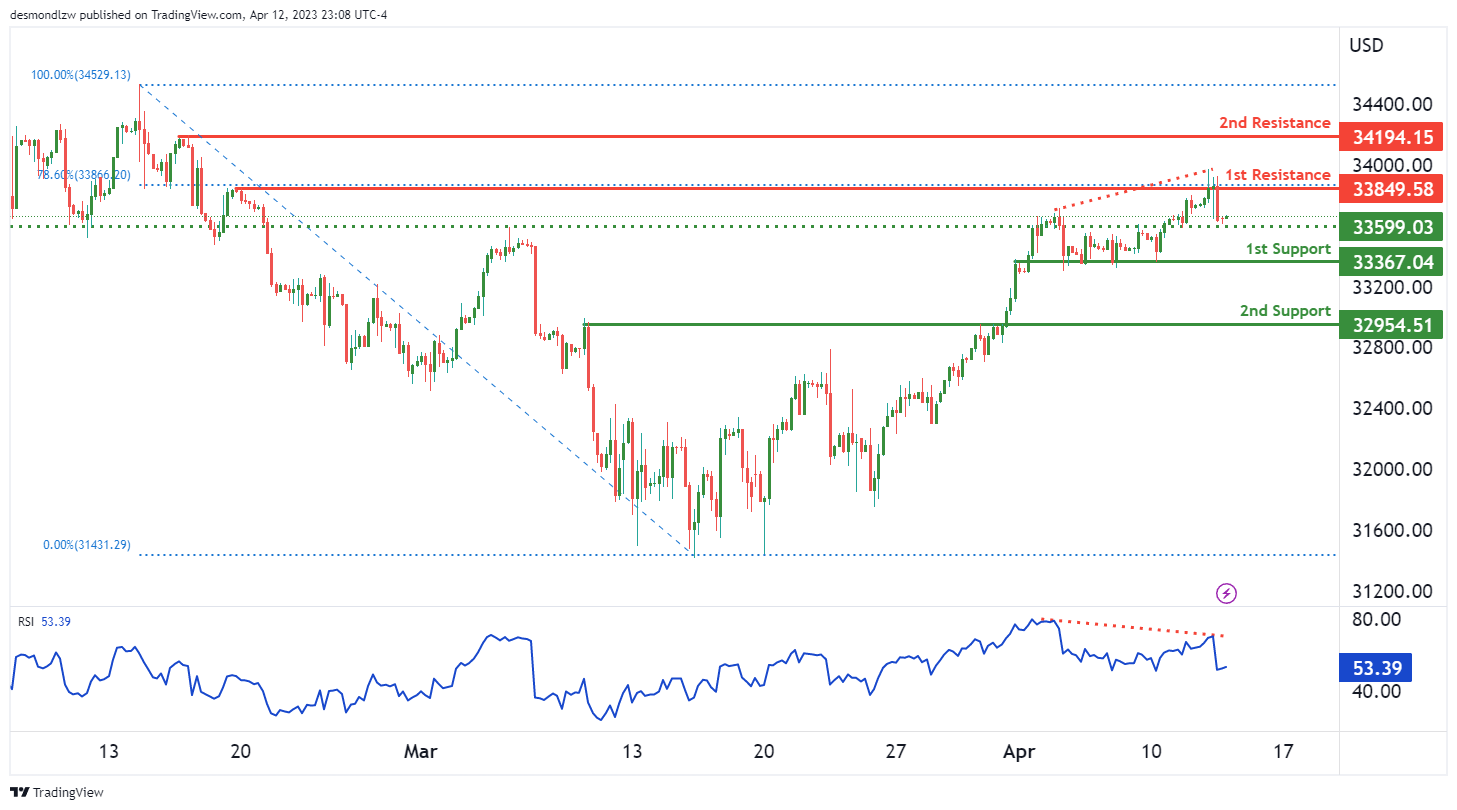
The DJ30 chart is currently showing bearish momentum, indicating a potential continuation towards the 1st support level at 33367.04. This support level is a pullback support and if price were to break below it, the next support level is the 2nd support at 32954.51, which is also a pullback support.
On the resistance side, we have the 1st resistance level at 33849.58, which is a multi-swing high resistance level that the price has struggled to break through in the past. This resistance level coincides with a 78.60% Fibonacci retracement level, making it a strong level of resistance that the price may struggle to break through. If price were to break above the 1st resistance level, the next resistance level is the 2nd resistance level at 34194.15, which is a swing high resistance level.
In addition, RSI is displaying bearish divergence versus price, suggesting that a reversal might occur soon. This indicates a potential for a bearish reversal in the near future.
There is an intermediate support level at 33599.03, which is an overlap support level that the price has bounced off multiple times in the past.
GER30:
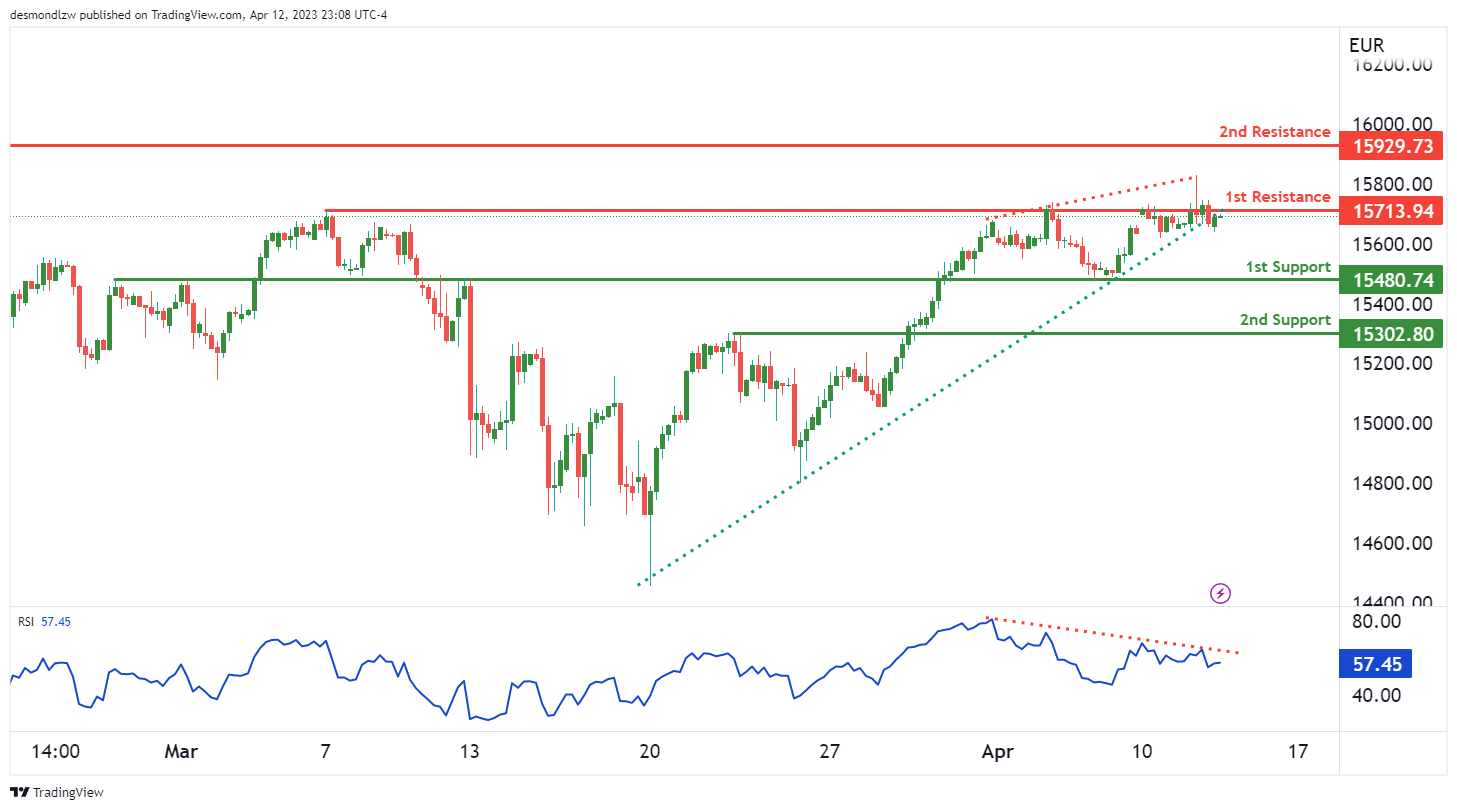
The GER30 chart is currently showing bearish momentum, as it broke below an ascending support line, suggesting that we may see further price declines in the near future.
Price could potentially react bearishly off the 1st resistance level of 15713.94 and drop towards the 1st support level of 15480.74. The 1st support level is an overlap support level that has held the price multiple times in the past, making it a strong level of support. The 2nd support level is at 15302.80, which is a pullback support level and could also provide some support if the price were to continue to drop.
On the resistance side, we have the 1st resistance level at 15713.94, which is a multi-swing high resistance level that the price has struggled to break through in the past. The 2nd resistance level is at 15929.73, which is a swing high resistance level.
Additionally, the RSI is displaying bearish divergence versus price, suggesting that a reversal might occur soon, which could further support the bearish momentum on the GER30 chart.
BTC/USD:
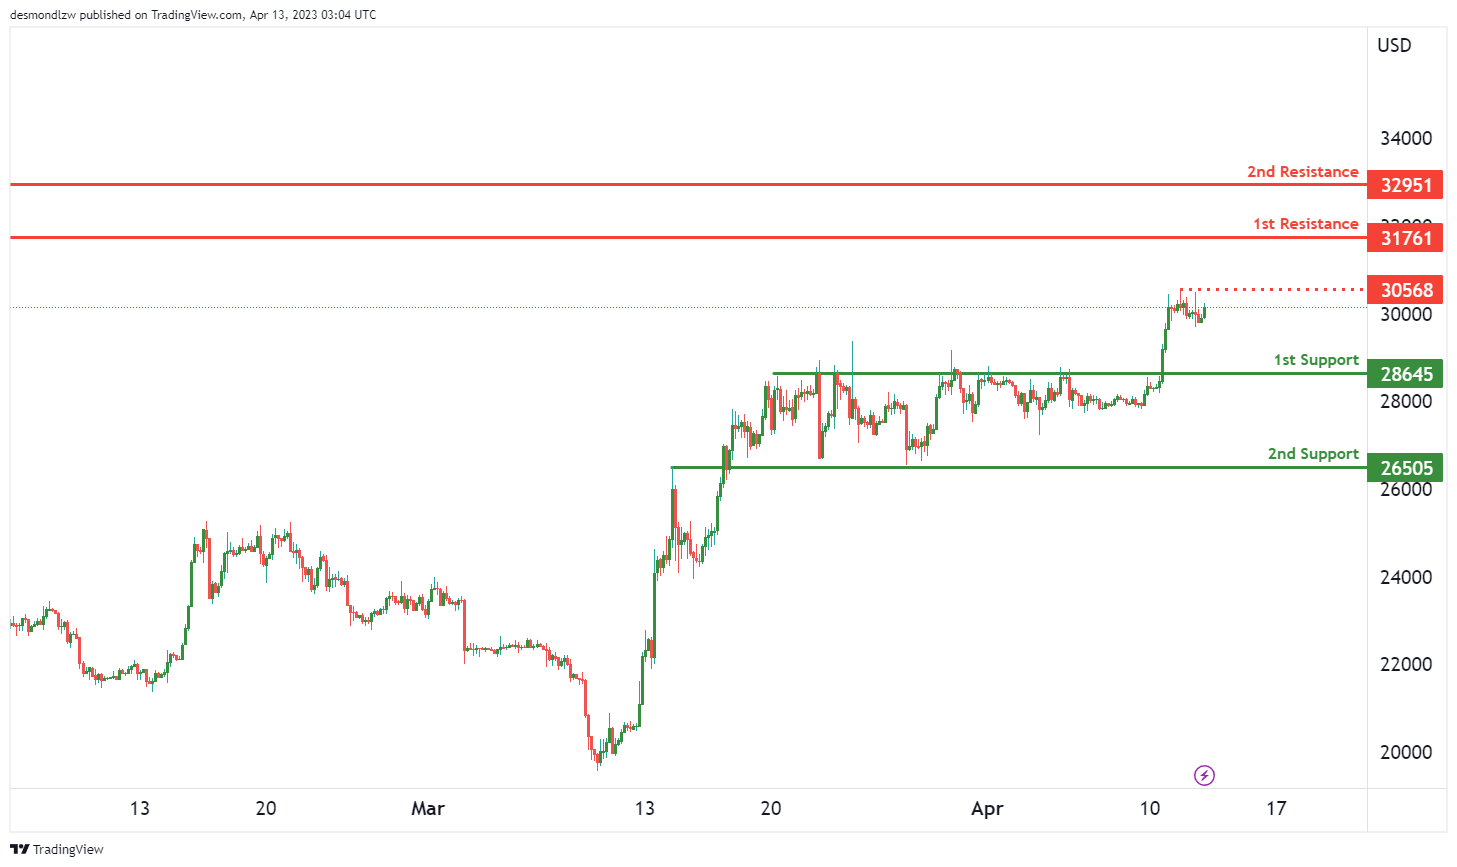
The BTC/USD chart is currently showing a bullish momentum, suggesting that we may see further price rises in the near future. The first support level is at 28645, which is a pullback support level that the price has bounced off multiple times in the past. The second support level is at 26505, which is an overlap support level that the price has also bounced off multiple times in the past.
On the resistance side, we have the first resistance level at 31761, which is a swing high resistance level. If the price were to break through the first resistance level, the next resistance level is the second resistance level at 32951, which is also a swing high resistance level.
In addition, there is an intermediate resistance level at 30568, which is a multi-swing high resistance level. If the price were to break through this level, it could potentially trigger a stronger bullish acceleration towards the first resistance level.
US500
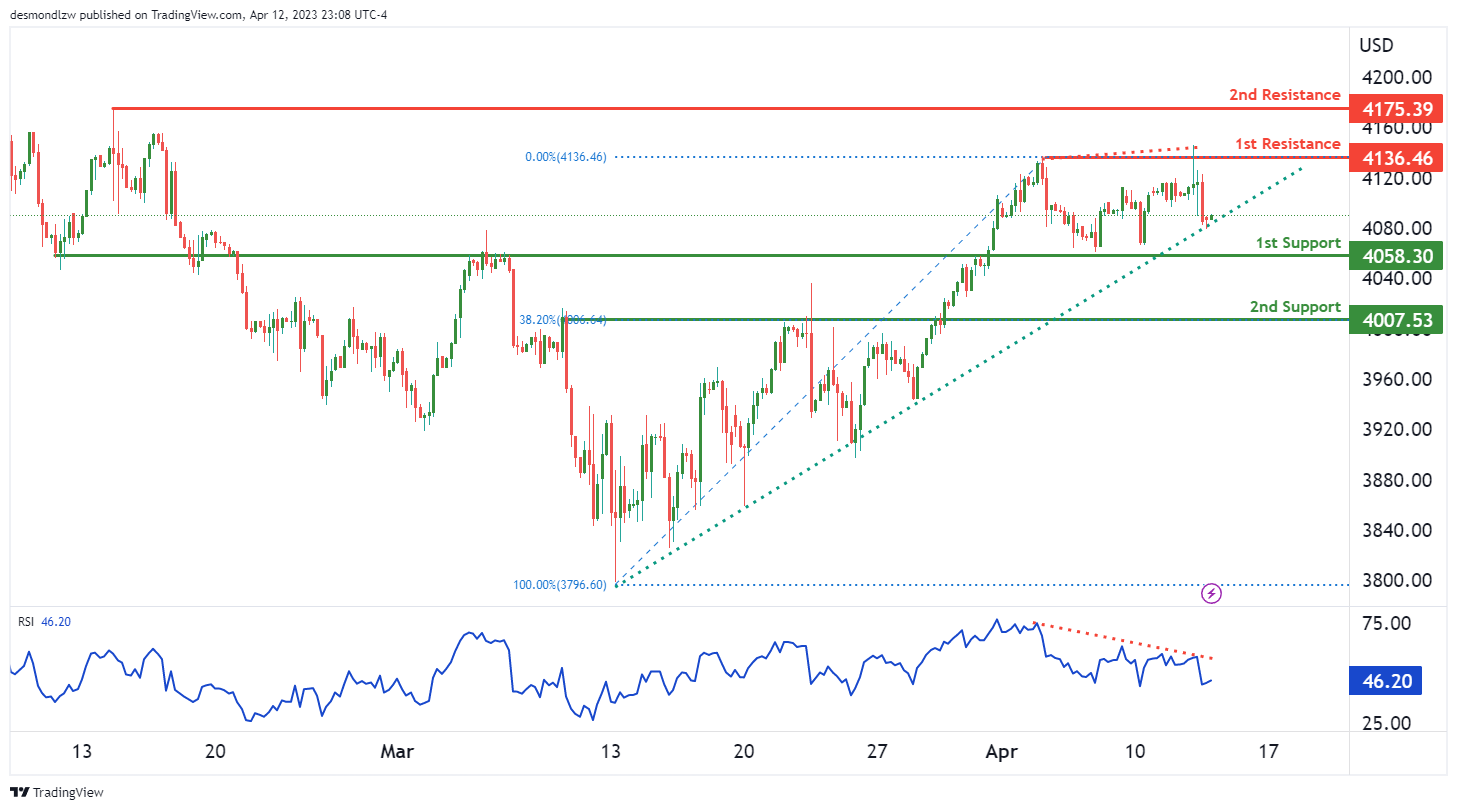
US500 shows signs of bullish momentum as it continues to trade above a major ascending trend line. This suggests that further bullish moves may be on the horizon. However, RSI is displaying bearish divergence versus price, which could potentially signal a reversal in the near future.
Currently, the price could potentially make a bullish continuation towards the 1st resistance level at 4136.46. The 1st support level is located at 4058.30 and is a strong overlap support that also coincides with an ascending trend line, further strengthening its significance. In the event of a pullback, the 2nd support level at 4007.53 could provide additional support as it is also an overlap support.
On the other hand, the 1st resistance level at 4136.46 is a multi-swing high resistance that could potentially halt the bullish move. If the price manages to break through this level, the next level to watch out for is the 2nd resistance level at 4175.39, which is a swing high resistance.
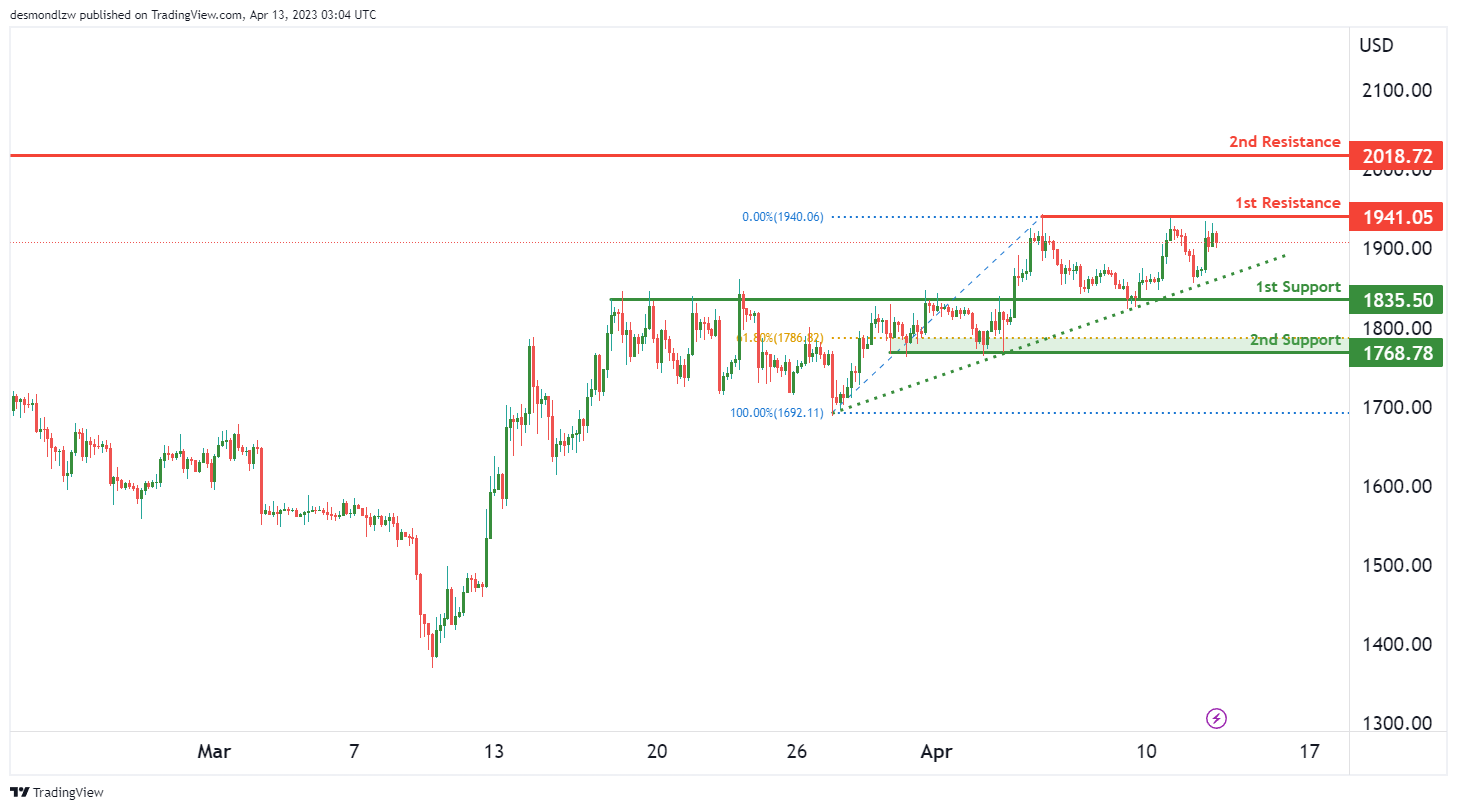
ETH/USD:
The overall momentum of the ETH/USD chart is bullish, with the price currently above a major ascending trend line, suggesting further bullish momentum is on the cards.
Looking at the chart, we can see that the price could potentially make a bullish continuation towards the first resistance level at 1941.05. Before reaching this level, the price may find support at the first support level of 1835.50. This level is an overlap support and is also on an ascending trend line, which acts as support.
If the price were to break below the first support level, the second support level at 1768.78 may provide additional support. This level is also an overlap support and coincides with the 61.80% Fibonacci retracement level.
On the other hand, if the price were to break above the first resistance level, it may rise towards the second resistance level at 2018.72. This level is a swing high resistance level and may provide a strong resistance to the price movement.
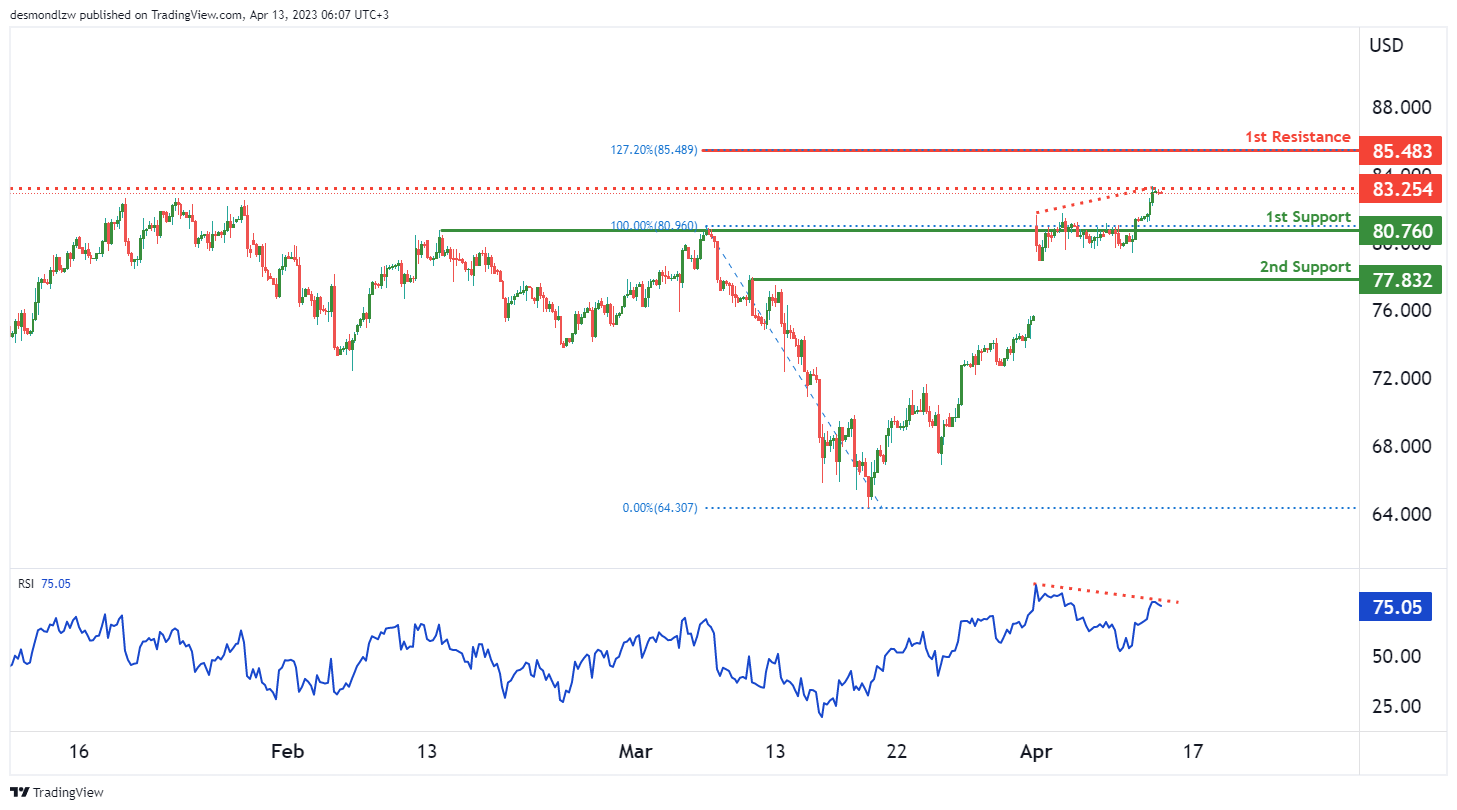
WTI/USD:
The overall momentum of WTI appears to be bearish. The price could potentially experience a bearish reaction off the first resistance and drop to the first support. The first support is at 80.76, which is an overlap support, while the second support is at 77.83, which is a swing low support. The first resistance is at 85.48, which is a swing high resistance, while the intermediate resistance is at 83.25, which is also a swing high resistance.
Additionally, RSI is displaying bearish divergence versus the price, suggesting that a reversal might occur soon. Overall, it appears that the price could potentially continue to drop towards the first support level, especially given the bearish momentum on the chart. Traders should keep an eye on these key support and resistance levels and monitor any potential reversals or breakouts that could signal a shift in momentum.
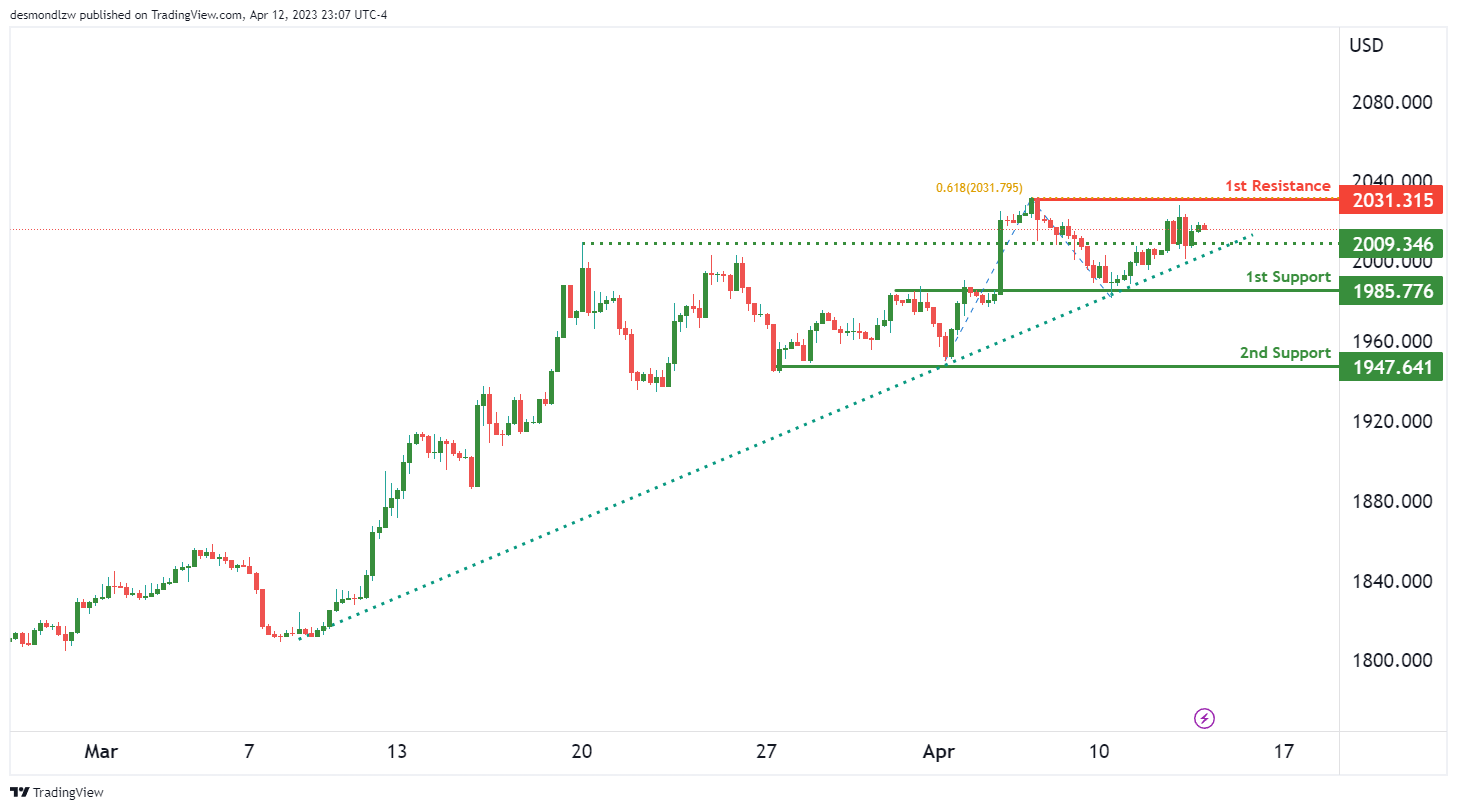
XAU/USD (GOLD):
Gold has been displaying bullish momentum on the chart, with the price above a major ascending trend line. This suggests further bullish momentum could be on the cards for XAU/USD.
If the bullish momentum continues, the price could potentially move towards the 1st resistance at 2031.31. This level is an important swing high resistance level, and coincides with the 61.80% Fibonacci projection.
In terms of support levels, the 1st support level is at 1985.77. This level is an overlap support level, and is also on the ascending trend line which acts as support. The 2nd support level is at 1947.64, which is a swing low support level.
Additionally, there is an intermediate support level at 2009.34, which is also an overlap support level.


