
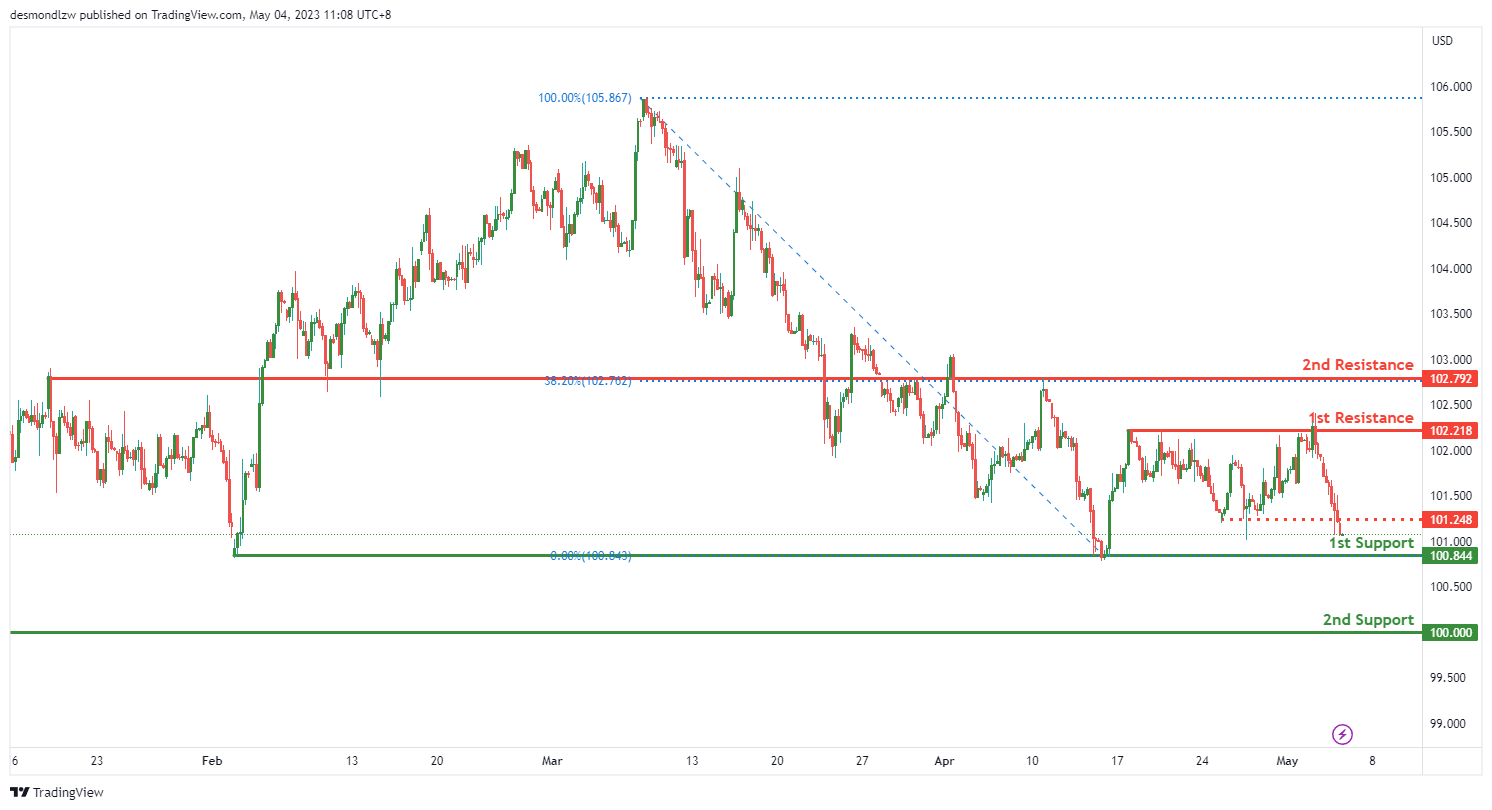
DXY:
The DXY chart has a bearish momentum, with potential for a continuation towards the first support level. The first support is at 100.84, which is a multi-swing low support level. If the price breaks this level, the next support is at 100.00, which is a swing low support.
On the upside, the first resistance level is at 102.21, which is a pullback resistance. The second resistance level is at 102.79, which is an overlap resistance and coincides with the 38.20% Fibonacci retracement.
It is worth noting that there is an intermediate resistance level at 101.24, which is a pullback resistance. This level could potentially slow down the bearish momentum, but a break above this level may trigger a move towards the first resistance level
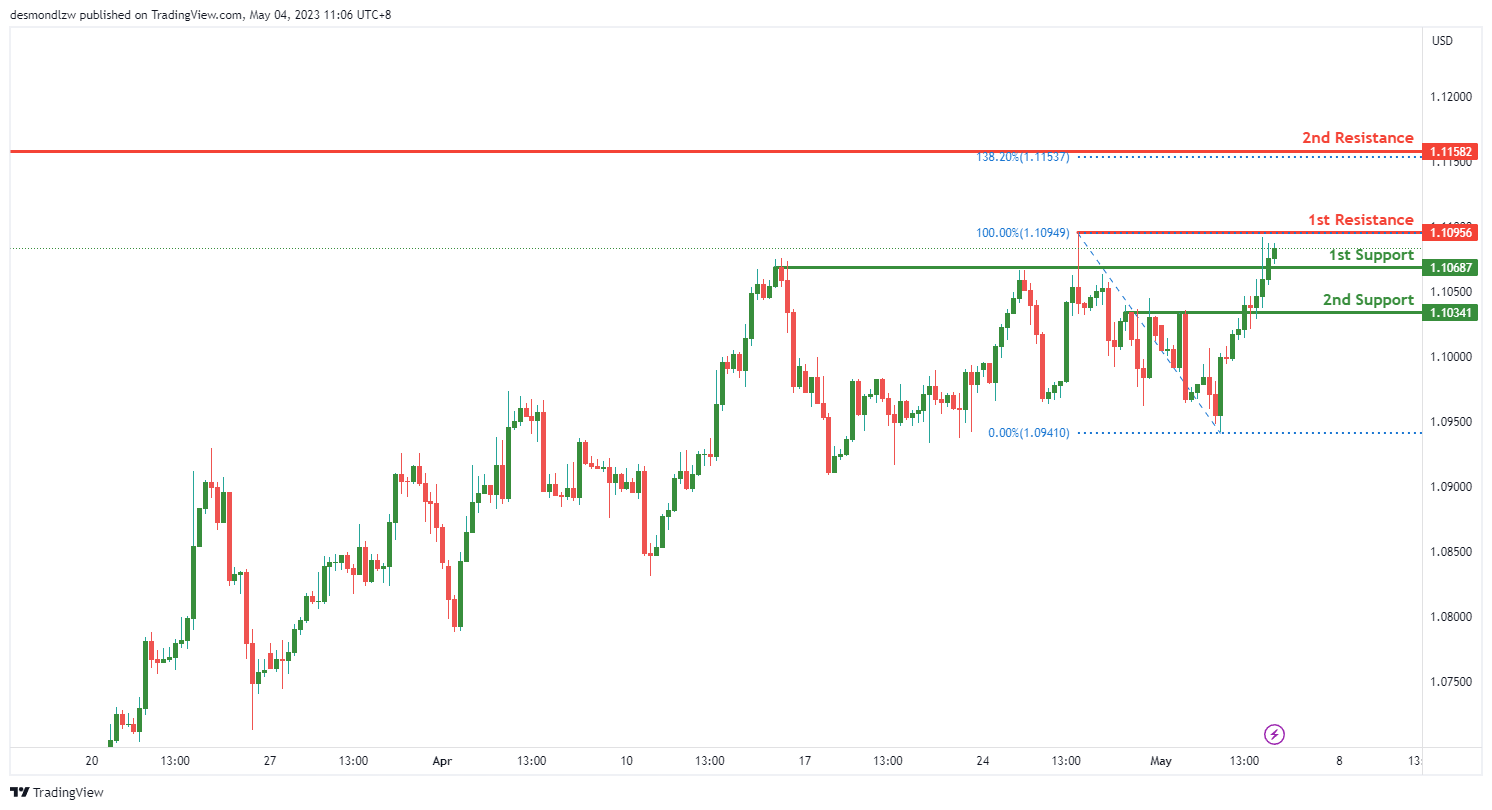
EUR/USD:
The EUR/USD chart shows a bullish bias with potential for a bullish break through of the first resistance level at 1.1095 and a rise towards the second resistance level at 1.1158. The first support level is at 1.1095, which is a pullback support and may provide a level of support for the price if it drops towards this level. The second support level is at 1.1034, which is another pullback support and may provide additional support for the price if it drops further.
On the resistance side, the first resistance level is at 1.1095, which is a swing high resistance. If the price manages to break through this level, it may rise towards the second resistance level at 1.1158. This level is a swing high resistance as well and coincides with a 138.20% Fibonacci extension.
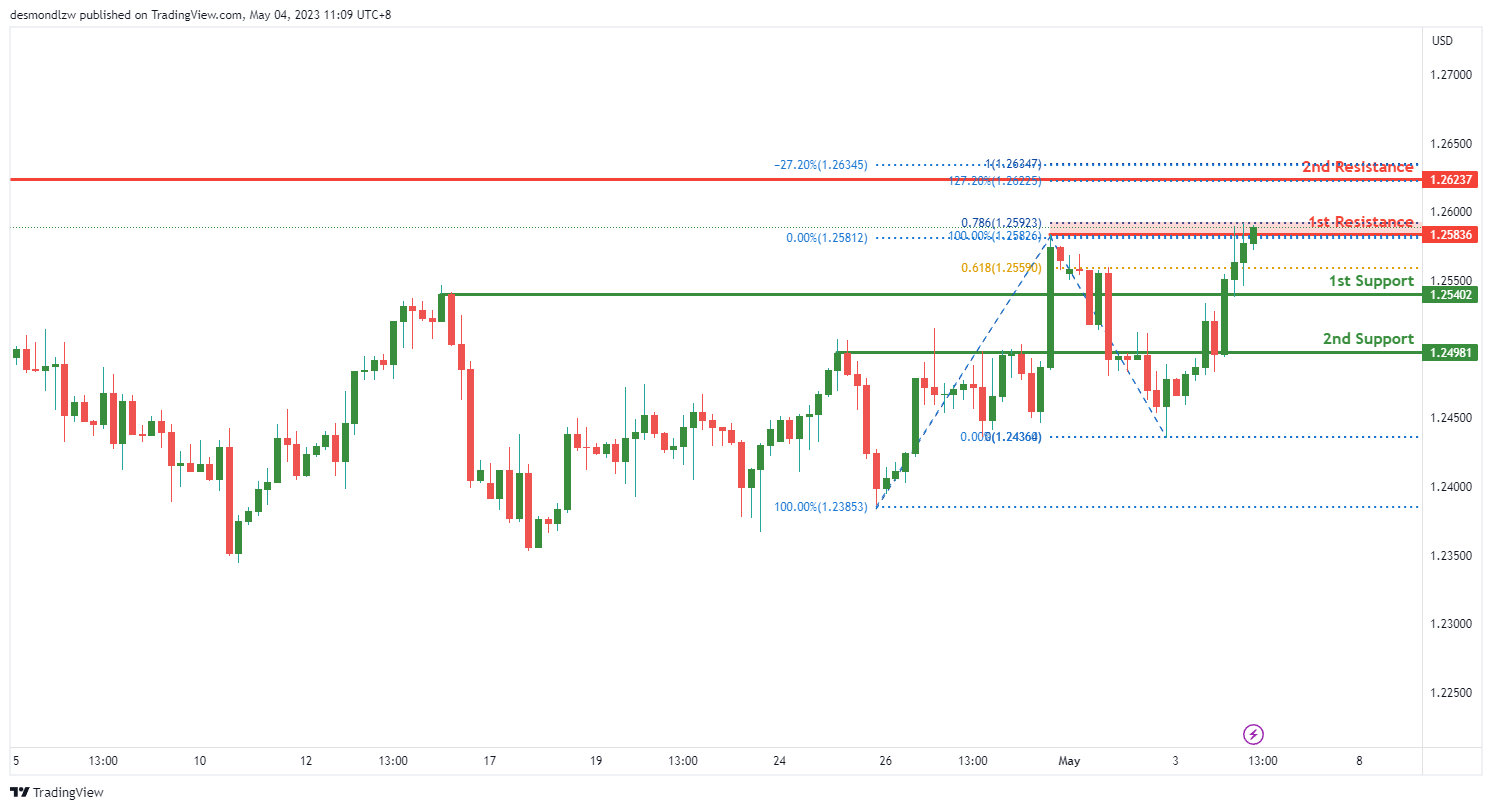
GBP/USD:
The GBP/USD chart is showing bearish momentum, with potential for a bearish reaction off the first resistance level at 1.2583 and a drop towards the first support level at 1.2540. The first support level is an overlap support, which suggests that price may bounce off this level if it reaches it. The second support level is at 1.2498, which is also an overlap support and may provide further support for the price.
On the resistance side, the first resistance level is at 1.2583, which is a swing high resistance and coincides with a 78.60% Fibonacci projection. If the price manages to break through this level, it may rise towards the second resistance level at 1.2623. This level is a swing high resistance as well and coincides with a -27% Fibonacci expansion and a 127.20% Fibonacci extension, which suggests a potential area of strong resistance for the price.
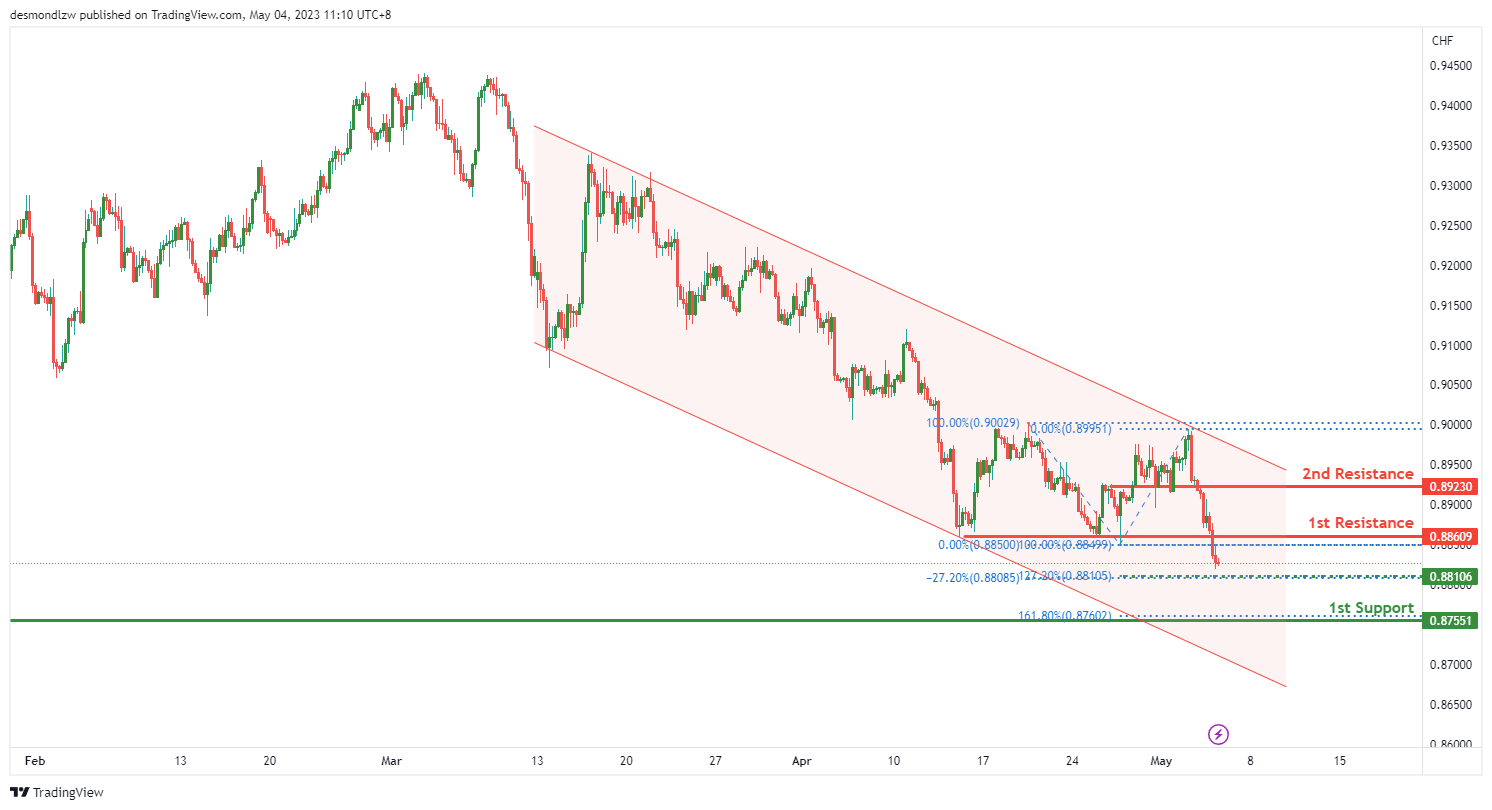
USD/CHF:
The USD/CHF chart shows bearish momentum, with price currently in a descending channel which suggests that price might continue to go lower due to its bearish momentum. There is potential for a bearish continuation towards the first support level at 0.8755, which is an overlap support and may provide a bounce if the price reaches this level. There is also an intermediate support level at 0.8810, which is another overlap support and coincides with a -27% Fibonacci expansion.
On the resistance side, the first resistance level is at 0.8860, which is a pullback resistance. If the price manages to break through this level, it may rise towards the second resistance level at 0.8923, which is an overlap resistance and may provide further resistance for the price.
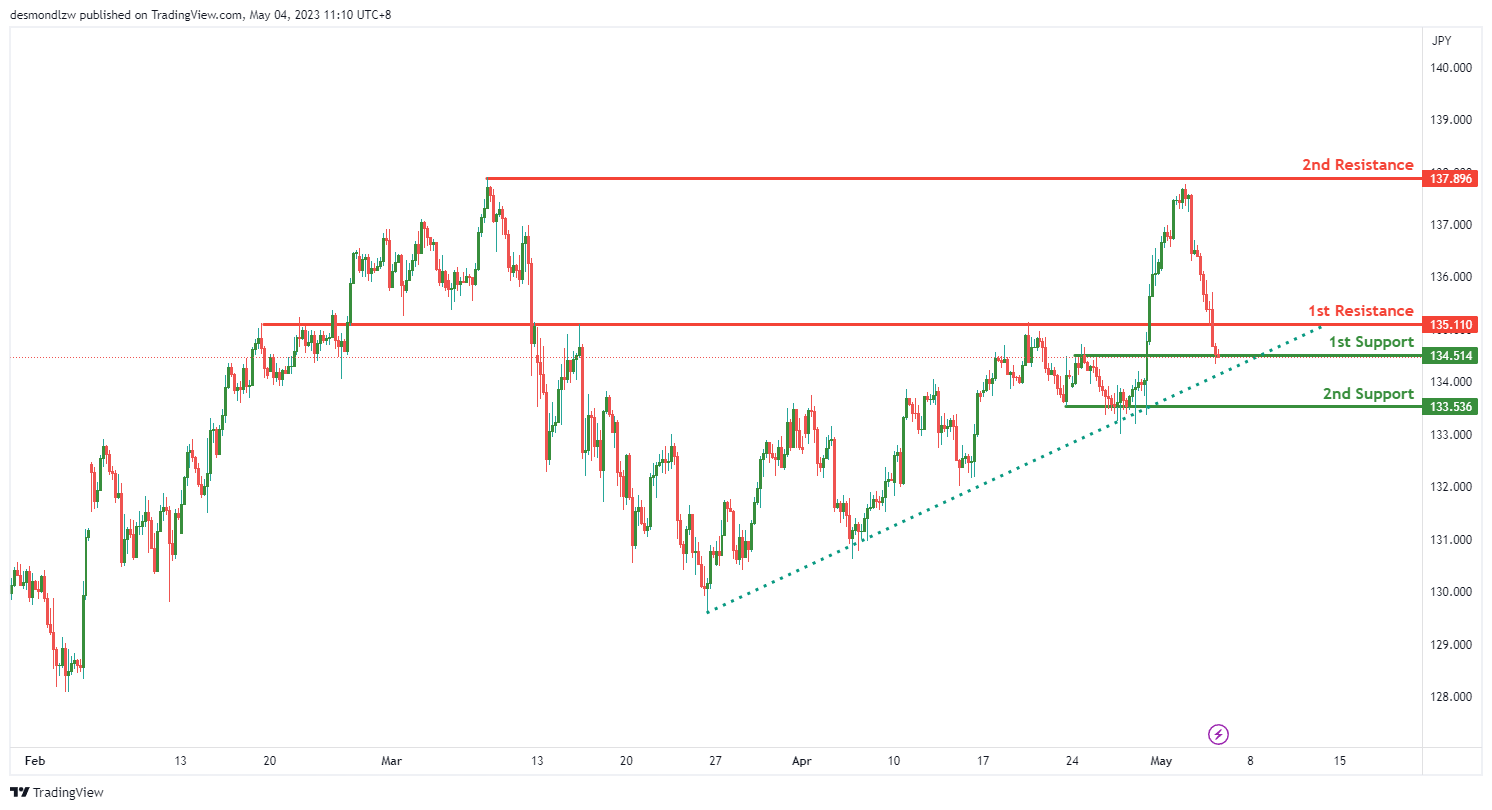
USD/JPY:
The USD/JPY chart shows bearish momentum, but the overall picture is still somewhat mixed as the price is currently above a major ascending trend line. For the bearish momentum to take over, the price would need to break below the trend line. Currently, there is potential for a bearish break off the first support level at 134.51 and a drop towards 2nd support level at 133.53. The first support level is a pullback support, which suggests that the price may find support if it reaches this level. The intermediate support level at 133.53 is a multi-swing low support and may provide further support for the price if it drops below the first support level.
On the resistance side, the first resistance level is at 135.11, which is a pullback resistance. If the price manages to break through this level, it may rise towards the second resistance level at 137.89. This level is a swing high resistance and may provide strong resistance for the price.
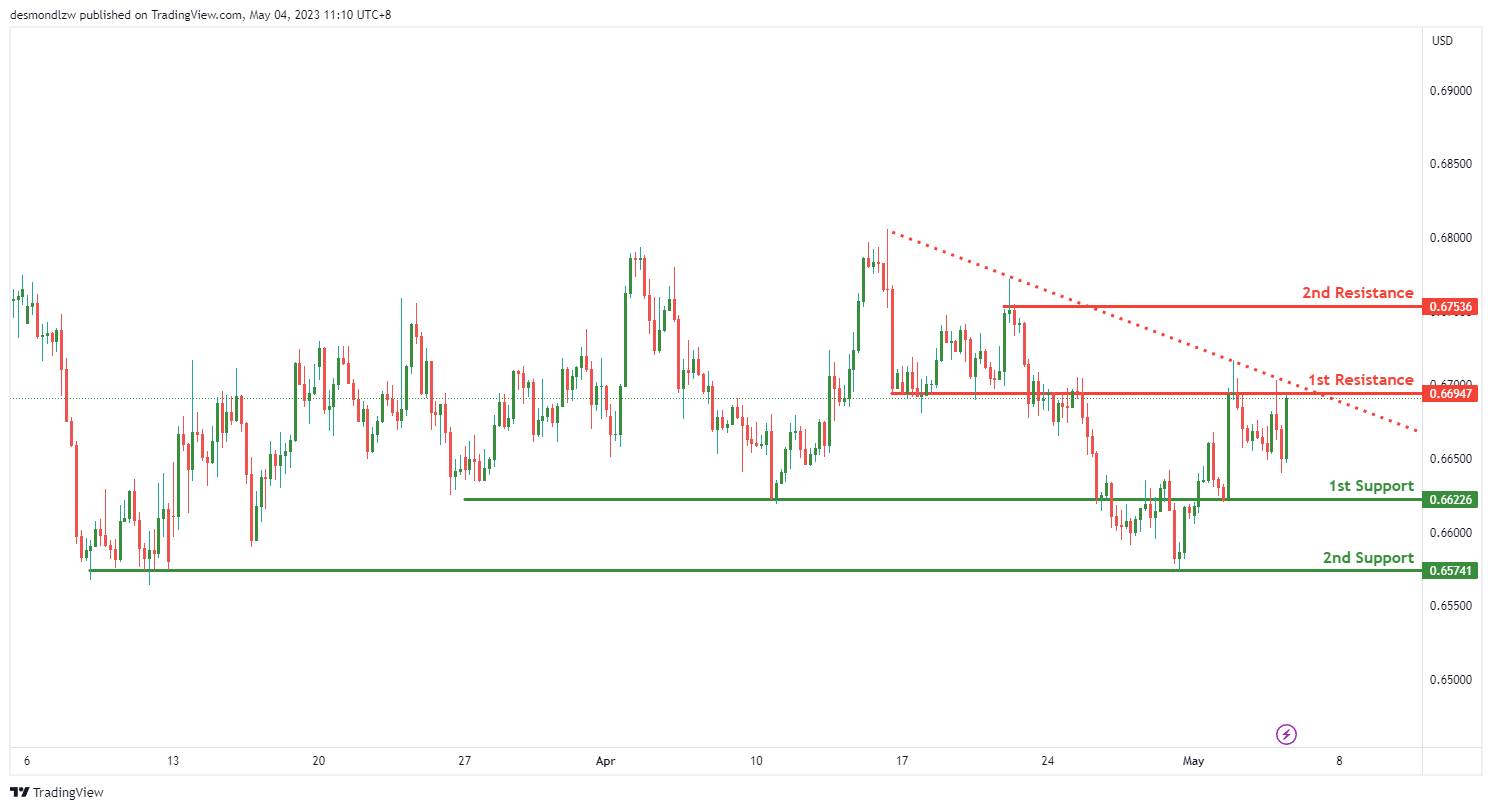
AUD/USD:
The AUD/USD chart shows a bearish momentum, with price currently below a major descending trend line. There is potential for a bearish reaction off the first resistance level at 0.6694 and a drop towards the first support level at 0.6622.
The first support level is an overlap support, which suggests that the price may find support if it reaches this level. The 2nd support level at 0.6574 is a multi-swing low support and may provide further support for the price if it drops below the first support level.
On the resistance side, the first resistance level is at 0.6694, which is an overlap resistance. If the price manages to break through this level, it may rise towards the second resistance level at 0.6753. This level is a swing high resistance and may provide strong resistance for the price.
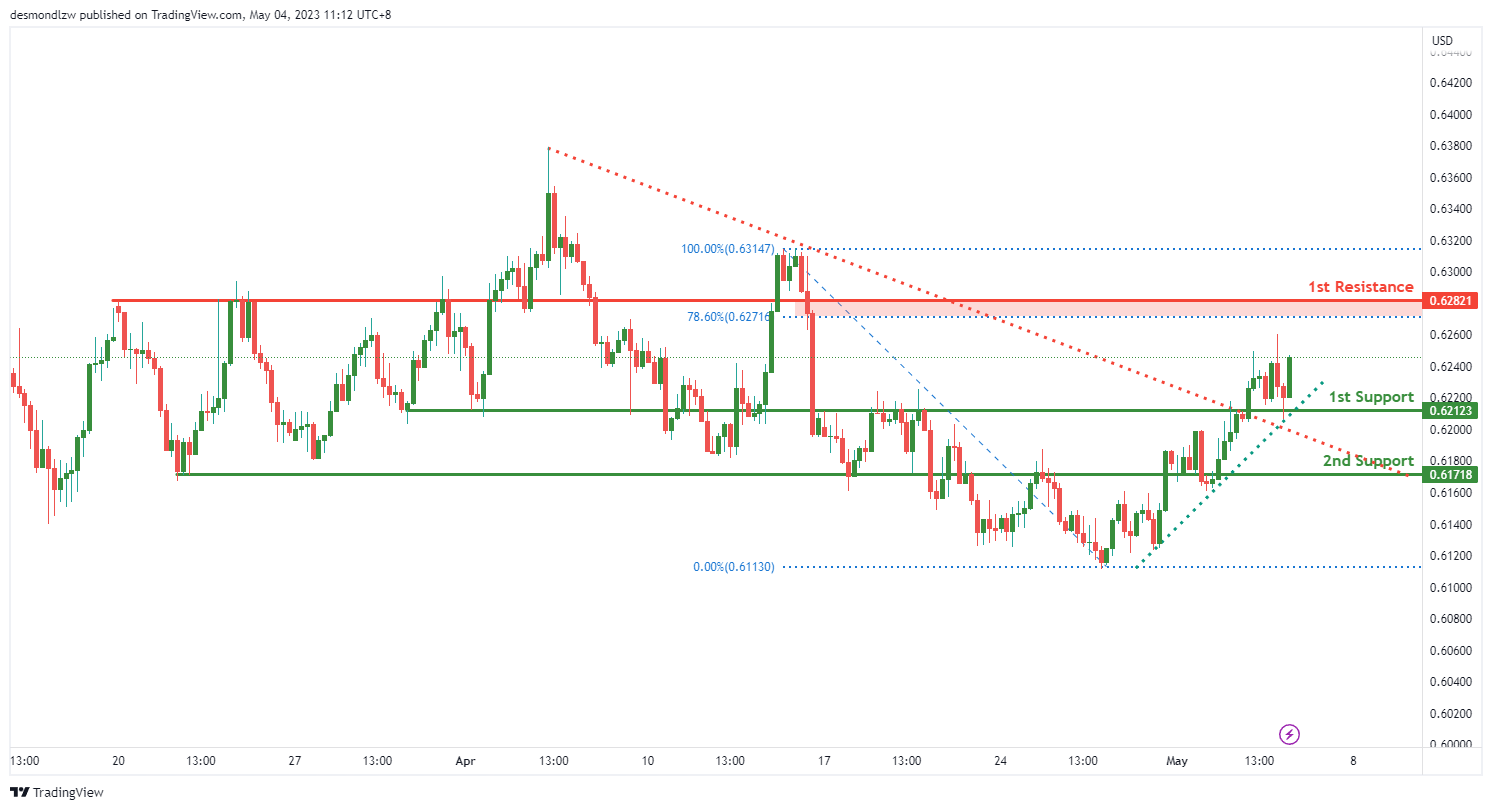
NZD/USD:
The NZD/USD chart shows bullish momentum, as price is above a major ascending trend line suggesting further bullish momentum may be on the cards. Additionally, price broke above a descending resistance line, which triggered a potential bullish move.
There is potential for a bullish continuation towards the first resistance level at 0.6282. The first support level at 0.6212 is an overlap support, which may provide support for the price if it drops. The second support level at 0.6171 is also an overlap support, which may provide further support for the price if it drops below the first support level.
On the resistance side, the first resistance level at 0.6282 is a pullback resistance. If the price manages to break through this level, it may rise further towards higher levels.
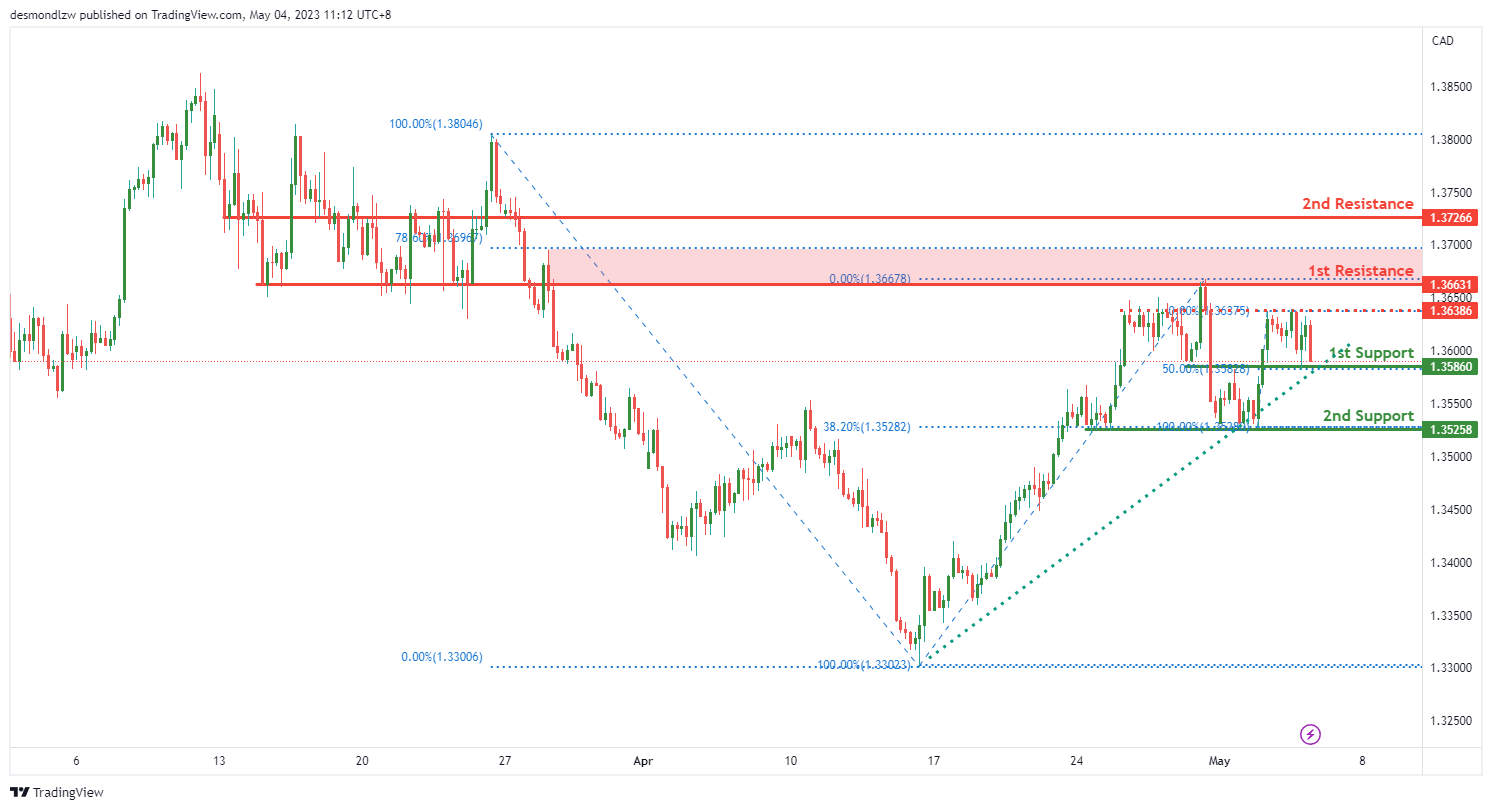
USD/CAD:
The USD/CAD chart is showing bullish momentum as price is currently above a major ascending trend line, indicating that further bullish momentum is on the cards. Based on this analysis, price could potentially make a bullish bounce off the 1st support level at 1.3586 and head towards the 1st resistance level at 1.3663.
The 1st support level at 1.3586 is an overlap support level and also coincides with the 50% Fibonacci retracement level. The 2nd support level at 1.3525 is a multi-swing low support level and also coincides with the 38.20% Fibonacci retracement level. These support levels may provide strong support for the price if it drops.
On the resistance side, the 1st resistance level at 1.3663 is an overlap resistance level and also coincides with the 78.60% Fibonacci projection level. If the price manages to break through this level, it may rise towards the 2nd resistance level at 1.3726. This level is a pullback resistance level and may provide strong resistance for the price.
It’s worth noting that as the overall momentum of the chart is bullish, we are looking for prices to rise from support to resistance. However, a break of the 1st support level may trigger a drop towards the 2nd support level. It’s important to keep an eye on the trend lines to confirm the direction of the momentum.
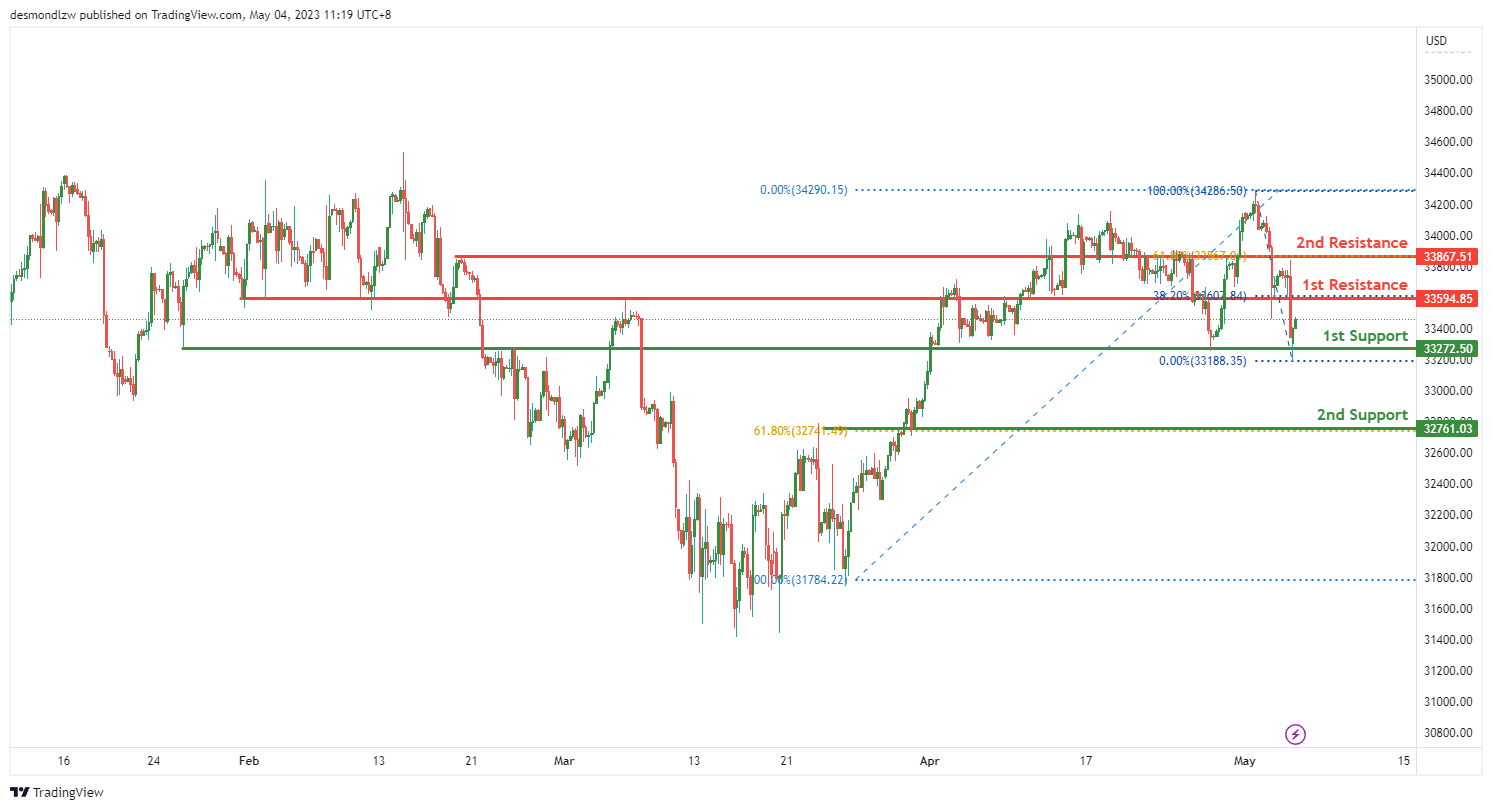
DJ30:
The DJ30 chart is currently showing bullish momentum, with potential for a continuation towards the first resistance level at 33594.85. The first support level at 33272.50 is an overlap support and may provide a level of support if the price were to drop to this level.
The second support level at 32761.03 is another overlap support, but also coincides with a 61.80% Fibonacci retracement level, which could provide stronger support for the price.
On the resistance side, the first resistance level at 33594.85 is a pullback resistance, which means that it may provide strong resistance for the price. This resistance level coincides with a 38.20% Fibonacci retracement level, which further strengthens its potential as a resistance level.
The second resistance level at 33867.51 is an overlap resistance and coincides with a 61.80% Fibonacci retracement level. This level may provide even stronger resistance for the price, potentially causing a reversal.
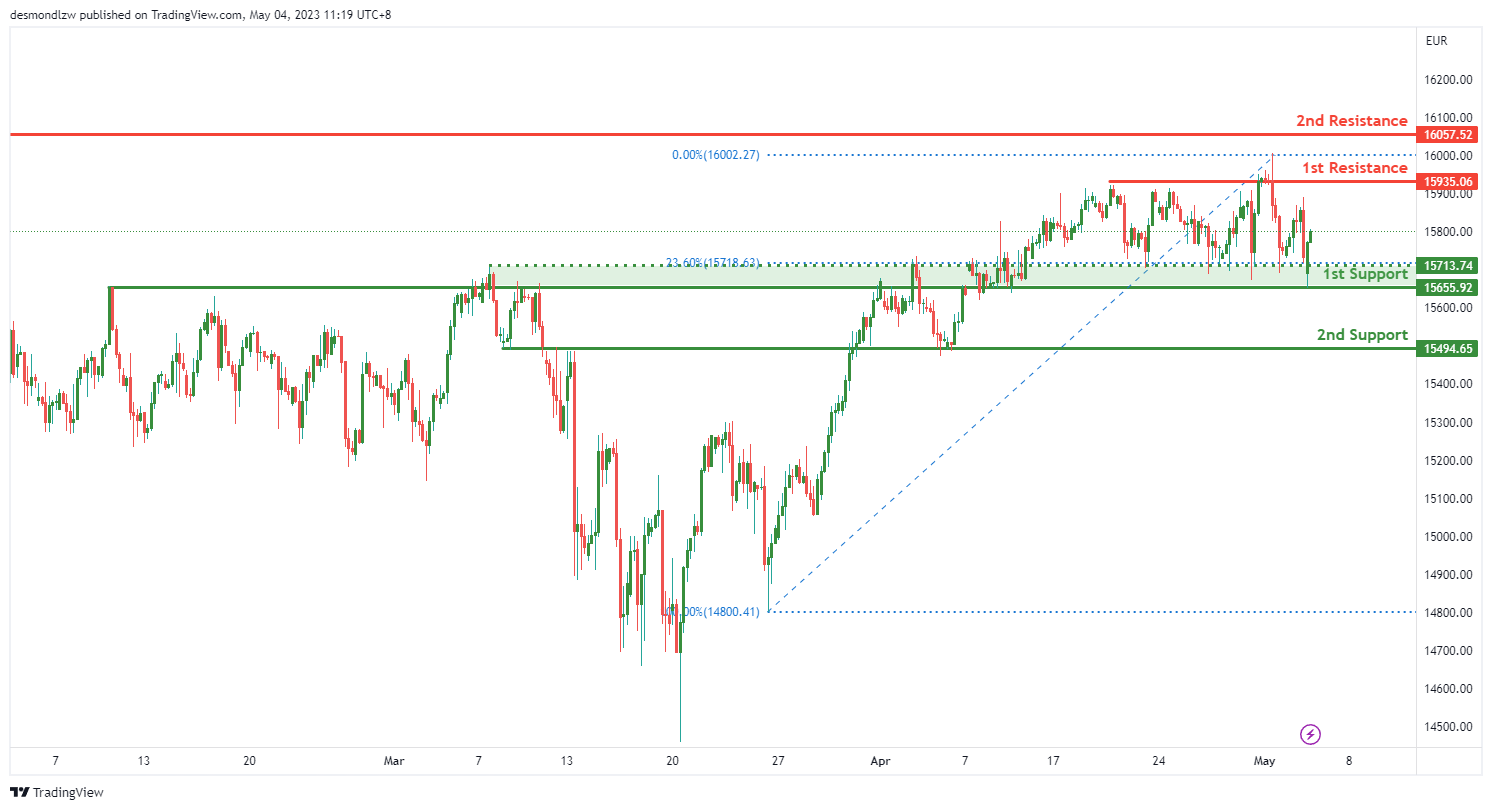
GER30:
The GER30 chart is currently showing bullish momentum, and it’s above a major ascending trend line which suggests further bullish momentum is on the cards. There is potential for a bullish continuation towards the first resistance level at 15935.06.
The first support level is at 15655.92, which is an overlap support, and may provide support for the price if it drops towards this level. The second support level is at 15494.65, which is also an overlap support, and may provide further support for the price if it drops below the first support level.
On the resistance side, the first resistance level is at 15935.06, which is a multi-swing high resistance, and may provide strong resistance for the price. If the price manages to break through this level, it may rise towards the second resistance level at 16057.52. This level is a swing high resistance and may also provide strong resistance for the price.
In addition to the support and resistance levels, there is an intermediate support level at 15713.74, which is an overlap support and also has a 23.60% Fibonacci retracement lining up with it. This level may provide additional support for the price if it drops towards this level.
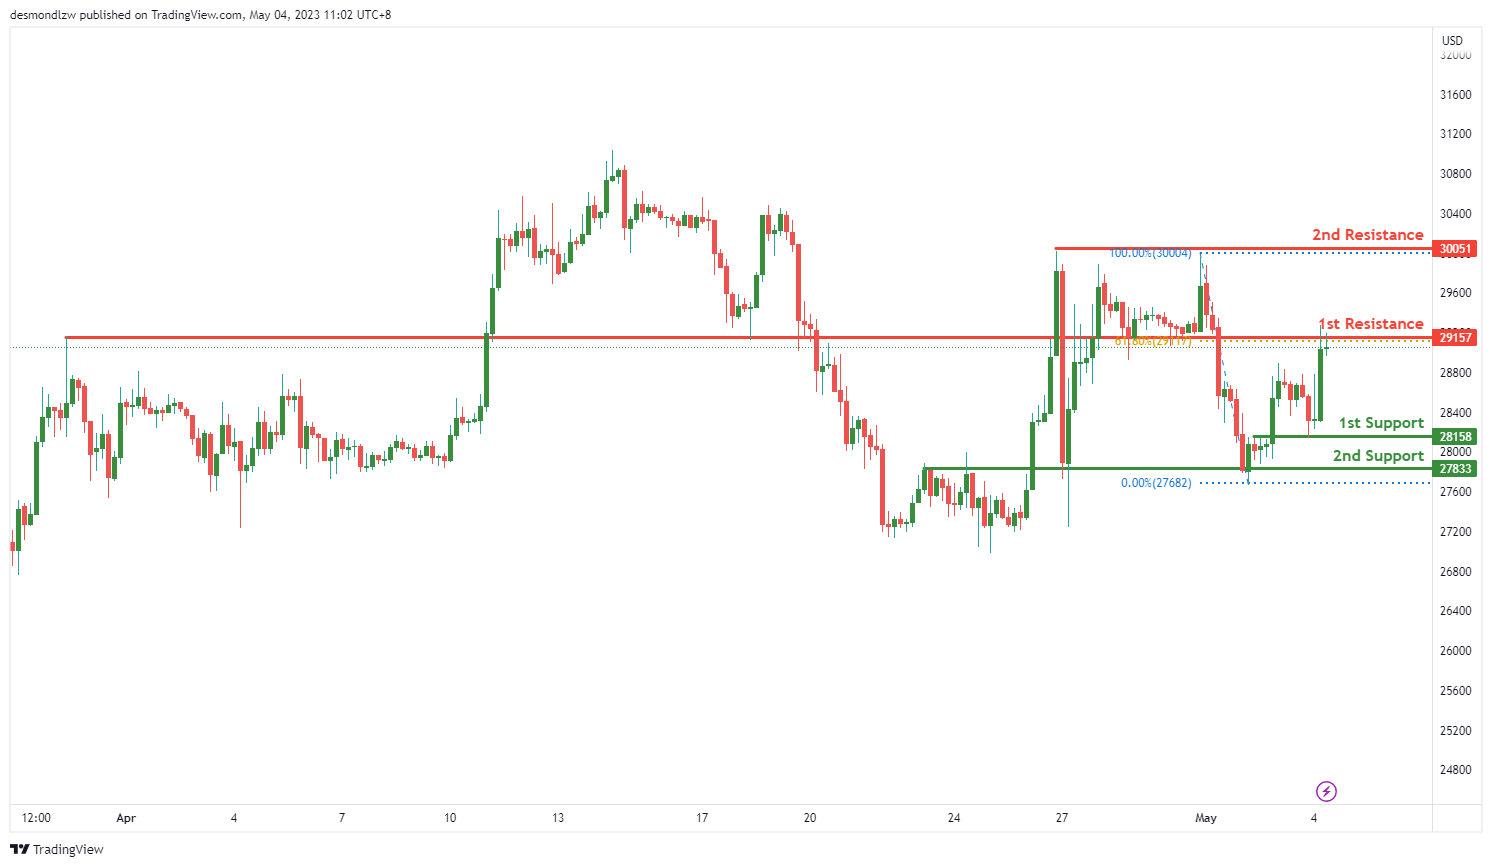
BTC/USD:
The BTC/USD chart shows bearish momentum, as the price is below a major descending trend line, suggesting that the trend may continue downwards. There is potential for a bearish reaction off the first resistance level at 29157 and a drop towards the first support level at 28158.
The first support level is an overlap support and may provide some support for the price if it reaches this level. The second support level at 27833 is also an overlap support and may provide further support for the price if it drops below the first support level.
On the resistance side, the first resistance level is at 29157, which is also an overlap resistance and coincides with a 61.80% Fibonacci retracement. If the price manages to break through this level, it may rise towards the second resistance level at 30051, which is a multi-swing high resistance and may provide strong resistance for the price.
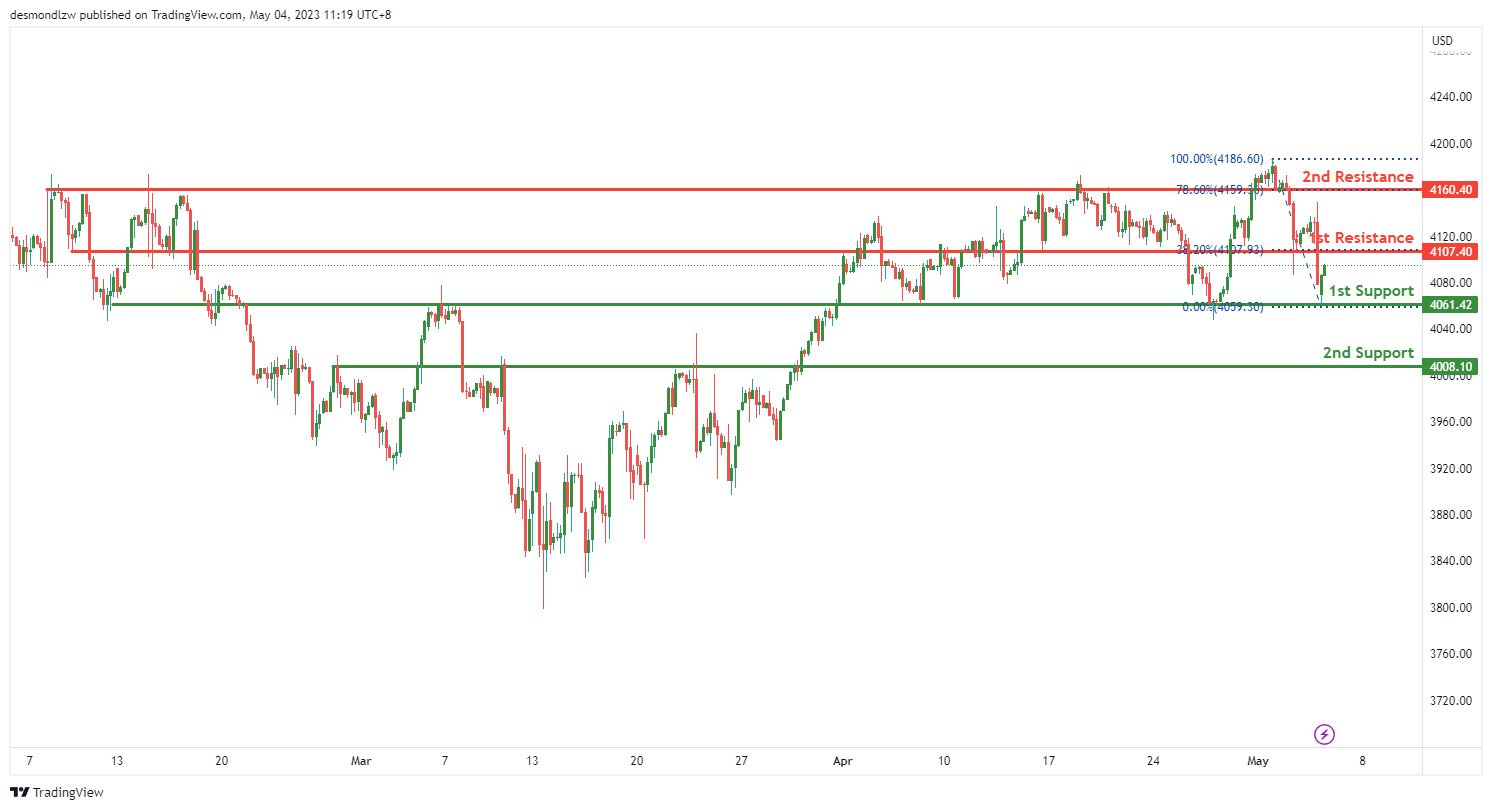
US500
The US500 chart shows bullish momentum as price is currently above a major ascending trend line. There is potential for a bullish continuation towards the first resistance level at 4107.40.
The first support level at 4061.42 is a multi-swing low support, which suggests that price may find support if it reaches this level. The second support level at 4008.10 is a pullback support and may provide further support for the price if it drops below the first support level.
On the resistance side, the first resistance level at 4107.40 is an overlap resistance and is also lined up with a 38.20% Fibonacci retracement level. If the price manages to break through this level, it may rise towards the second resistance level at 4160.40. This level is an overlap resistance and is also lined up with a 78.60% Fibonacci retracement level, which may provide strong resistance for the price.
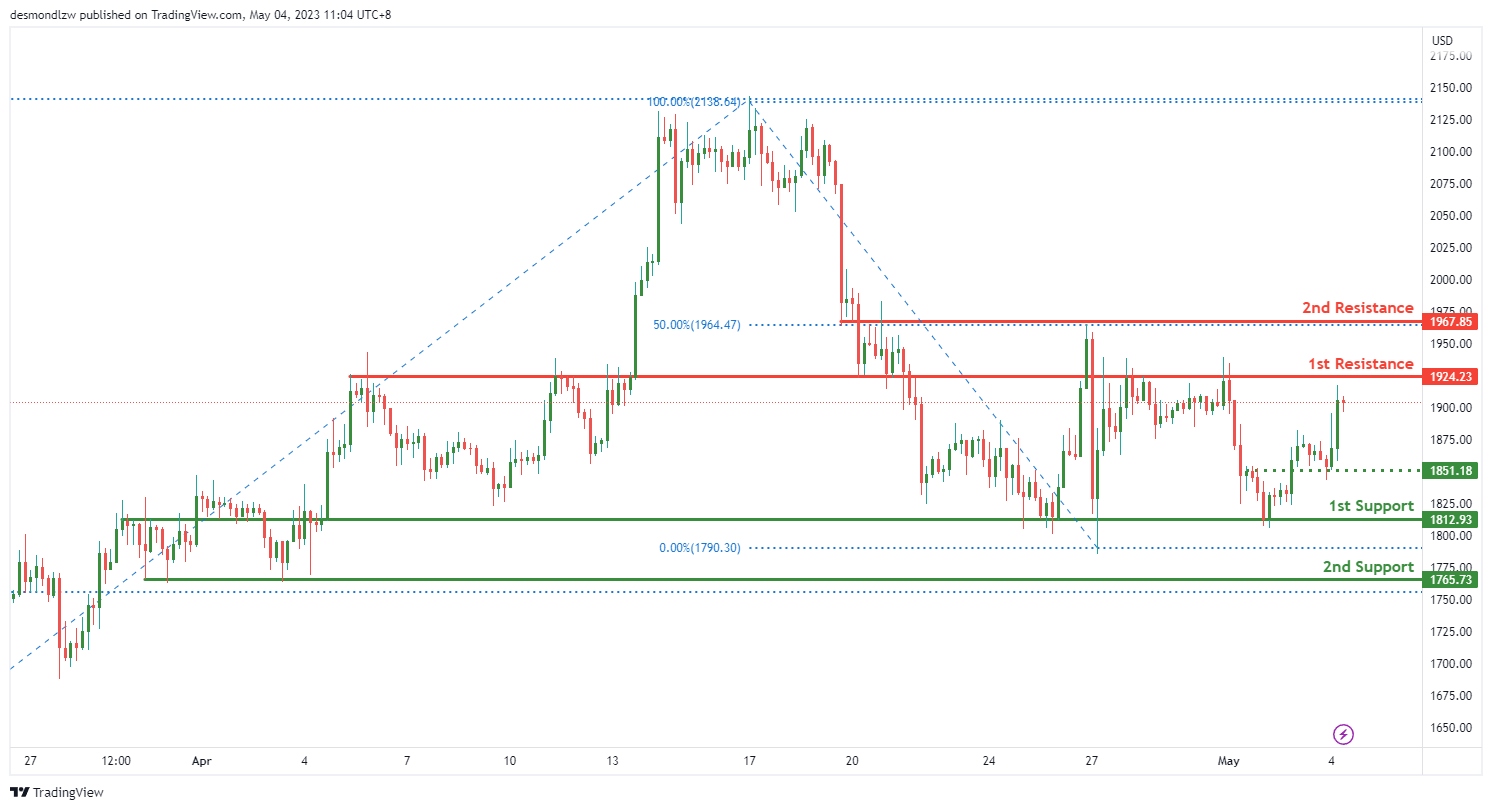
ETH/USD:
Based on the analysis, the overall momentum of the ETH/USD chart is bearish. There is potential for a bearish reaction off the first resistance level at 1924.23, with a drop towards the first support level at 1812.93.
The first support level is a good level because it is an overlap support. The second support level at 1765.73 is a multi-swing low support which may provide further support for the price if it drops below the first support level.
On the resistance side, the first resistance level at 1924.23 is an overlap resistance which suggests that the price may find resistance if it reaches this level. The second resistance level at 1967.85 is also an overlap resistance and coincides with the 50% Fibonacci retracement level.
Additionally, there is an intermediate support level at 1851.18, which is an overlap support level that may provide some temporary support for the price.
WTI/USD:
WTI: Bearish Momentum Continues as Price Remains Below Major Descending Trend Line
The overall momentum of the WTI chart remains bearish, with price below a major descending trend line indicating further potential downside. Price could potentially make a bearish reaction off the 1st resistance and drop to the 1st support level.
The 1st support level is at 64.90 and is a multi-swing low support, making it a good level to watch for potential bounce. The 2nd support level is at 61.66 and is a swing low support, further supporting the idea of potential downside.
On the resistance side, the 1st resistance is at 71.58 and is an overlap resistance, coinciding with a 38.20% Fibonacci retracement. This makes it a good level to watch for potential pullbacks. Additionally, there is an intermediate resistance at 68.80, which is an overlap resistance and lines up with a 23.60% Fibonacci retracement.
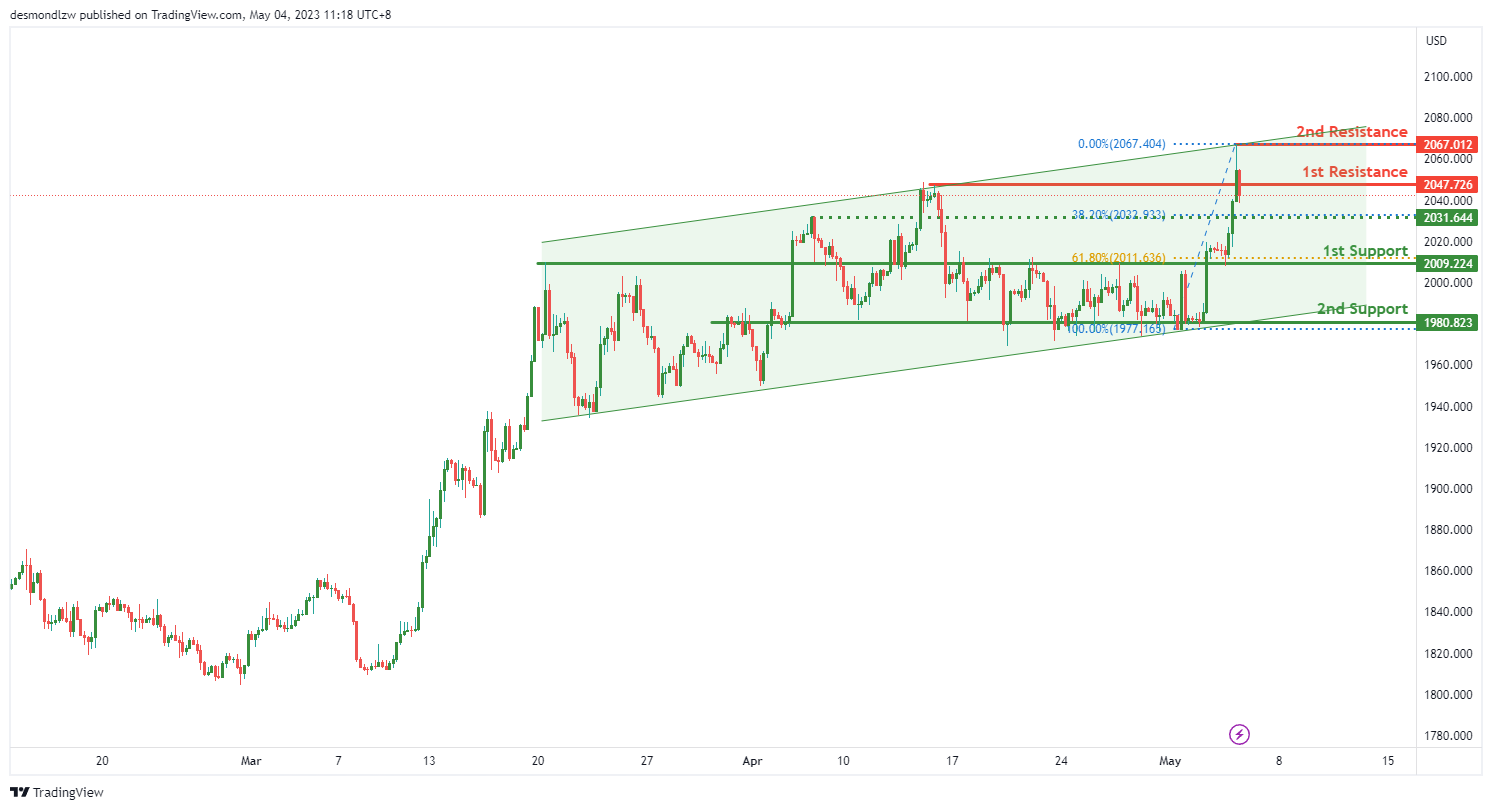
XAU/USD (GOLD):
Gold (XAU/USD) is currently showing bullish momentum as the price is in an ascending channel. However, in the short term, the price may drop further to the 1st support level before bouncing back and heading towards the 1st resistance.
The 1st support level is at 2009.22 and is a strong overlap support, coinciding with a 61.80% Fibonacci retracement level. The 2nd support level is at 1980.82 and is also an overlap support level.
On the resistance side, the 1st resistance level is at 2047.72, which is a swing high resistance. The 2nd resistance level is at 2067.01 and is also a swing high resistance.
There is also an intermediate support level at 2031.64 which coincides with a 38.20% Fibonacci retracement level.
In conclusion, Gold is showing bullish momentum in the long term but may experience some short-term bearish pressure before continuing its bullish trend. The 1st support level at 2009.22 is a critical level to watch, as a bounce from this level could trigger a move towards the 1st resistance at 2047.72. If the price breaks below the 1st support level, the 2nd support level at 1980.82 could provide some support. On the upside, a break of the 1st resistance level could lead to a move towards the 2nd resistance at 2067.01.


