
DXY:
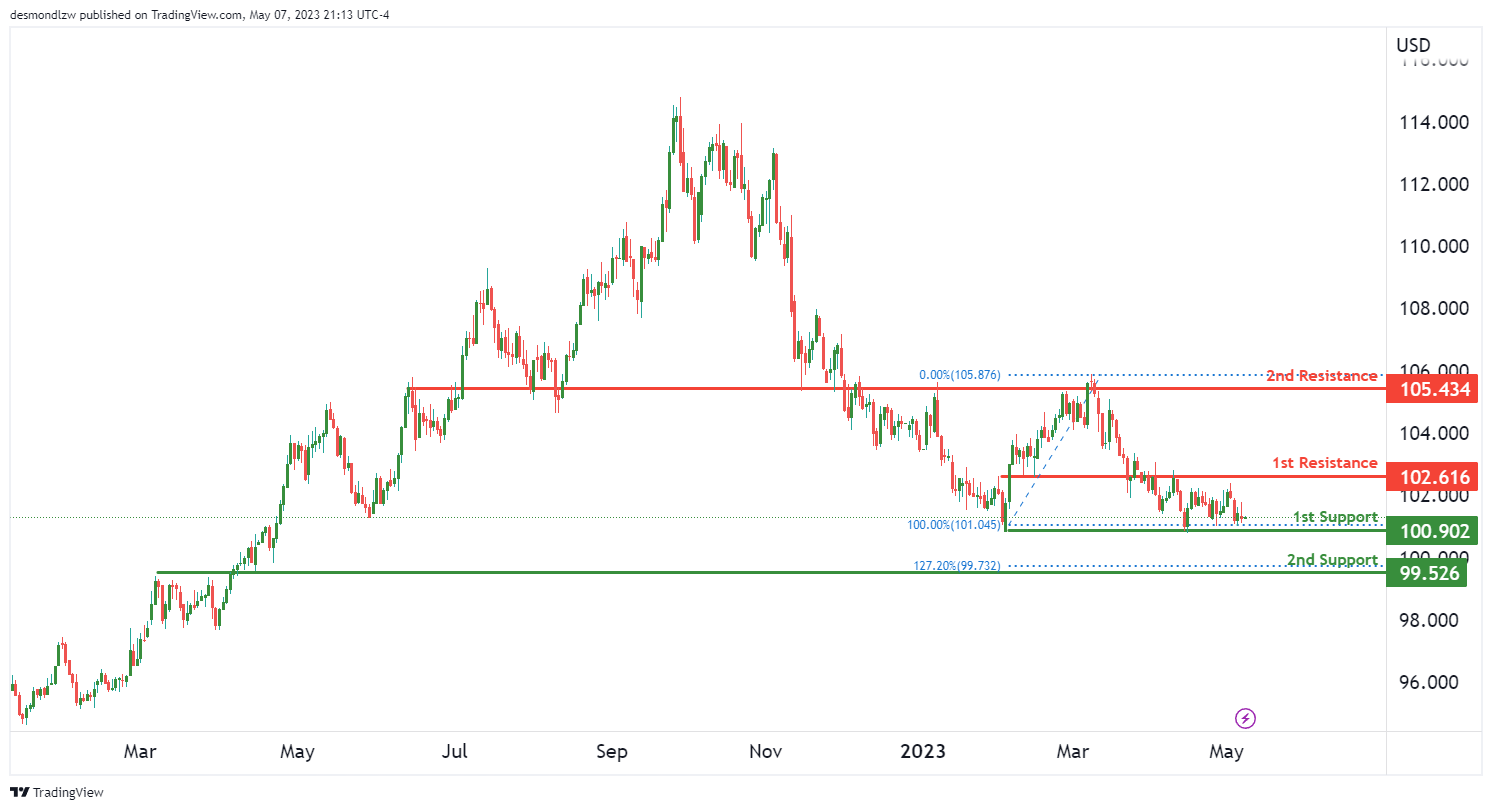
The DXY chart currently shows bullish momentum, indicating a potential for prices to rise in the short term. The price is also currently above the Ichimoku cloud, which is a bullish signal.
The first support level for the DXY chart is located at 100.90, which is a multi-swing low support level. This level is a good potential point for the price to bounce off of, as it has done in the past. If the price bounces from this level, it could head towards the first resistance level at 102.61, which is an overlap resistance level. This level has the potential to push prices even higher.
If the price breaks above the first resistance level, it could potentially rise towards the second resistance level at 105.43. This is another overlap resistance level that could provide significant bullish momentum.
However, if the price were to break below the first support level at 100.90, it could potentially drop to the second support level at 99.52. This level is also significant, as it’s an overlap support level and has a 127.20% Fibonacci extension lining up with it.
EUR/USD:
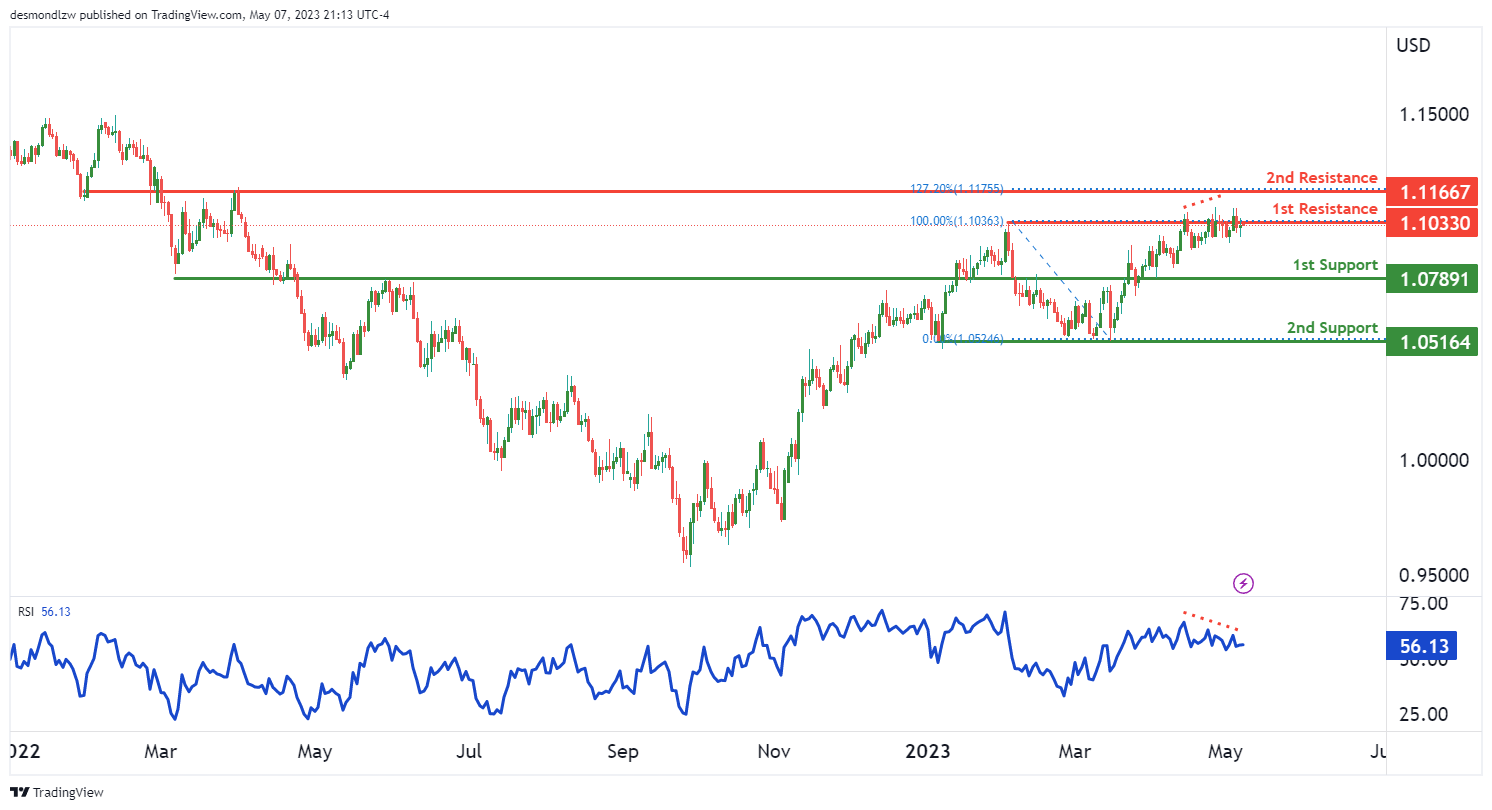
The EUR/USD chart currently shows bearish momentum, indicating a potential for prices to drop in the short term. The price is also below the Ichimoku cloud, which is a bearish signal.
The first resistance level for the EUR/USD chart is located at 1.1033, which is a multi-swing high resistance level. This level is a good potential point for the price to react off of, and potentially drop towards the first support level at 1.0789. This level is an overlap support level and has the potential to push prices even lower.
If the price breaks below the first support level, it could potentially drop to the second support level at 1.0516. This level is also significant, as it’s a multi-swing low support level.
However, if the price were to break above the first resistance level at 1.1033, it could potentially rise towards the second resistance level at 1.1166. This level is also significant, as it’s an overlap resistance level.
It’s worth noting that the RSI is displaying bearish divergence versus price, which suggests that a reversal might occur soon
GBP/USD:
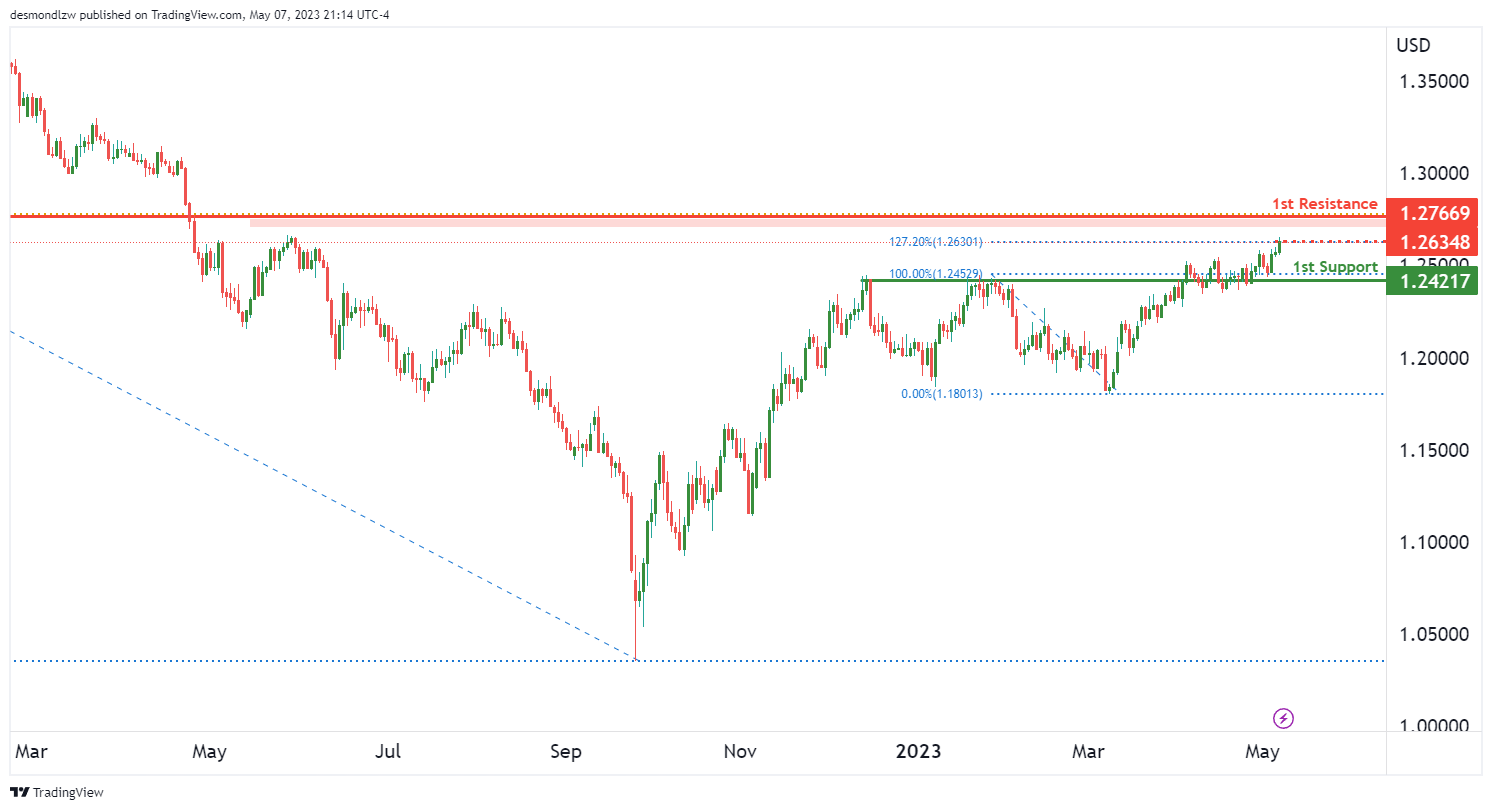
The GBP/USD chart is currently showing bearish momentum, indicating a potential for prices to drop in the long term. However, in the short term, there could be a potential rise towards the first resistance level at 1.2766.
This level is a pullback resistance and a potential point for the price to reverse off of, and potentially drop towards the first support level at 1.2421. This level is an overlap support level and has the potential to push prices even lower.
If the price breaks below the first support level, it could potentially drop even lower in the long term.
There is also an intermediate resistance level at 1.2634, which is a swing high resistance level and coincides with the 127.20% Fibonacci extension level. If the price were to break above this level, it could potentially continue to rise towards the first resistance level at 1.2766.
However, the overall momentum of the chart is still bearish, indicating that any rise towards the first resistance level should be seen as a potential opportunity to sell and take advantage of the long-term bearish trend.
USD/CHF:
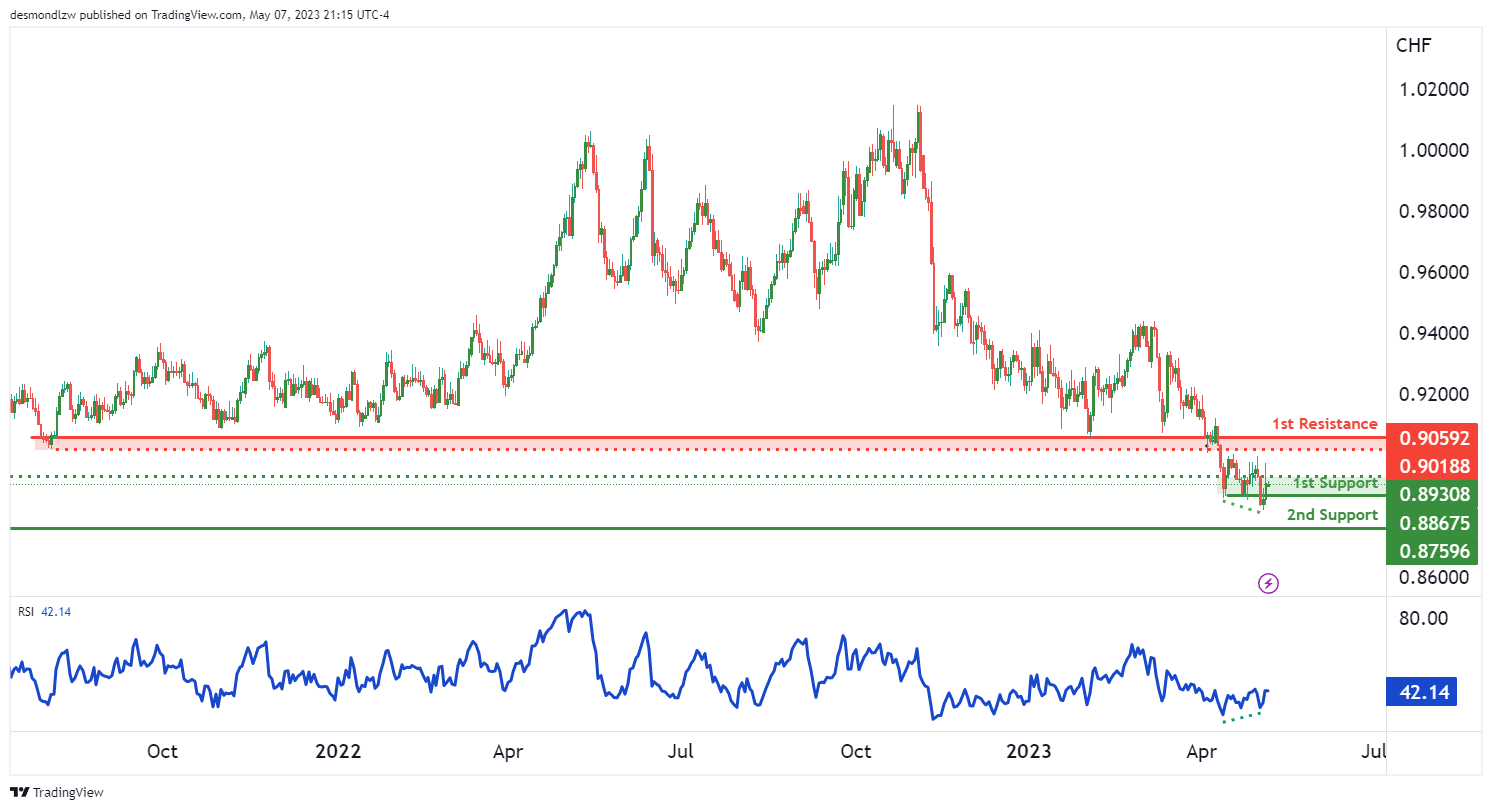
The overall momentum of the USD/CHF chart is bullish. The first support level is at 0.8867, which is a multi-swing low support level. This is a good level for buyers to step in and push the price higher. The second support level is at 0.8759, which is a swing low support level. This level also provides a good buying opportunity.
The first resistance level is at 0.9059, which is an overlap resistance level. This level may provide some resistance to the price, but if it can break above this level, it could potentially rise towards the intermediate resistance level at 0.9018. This level is also an overlap resistance level and coincides with a 127.2% Fibonacci extension.
On the downside, there is an intermediate support level at 0.8930 which could provide a cushion for the price if it drops. If the price breaks below this level, it could drop towards the first support level at 0.8867.
It’s worth noting that the RSI is displaying bullish divergence versus price, which suggests that there could be a rapid incline in price. This provides additional evidence that the overall momentum of the chart is bullish.
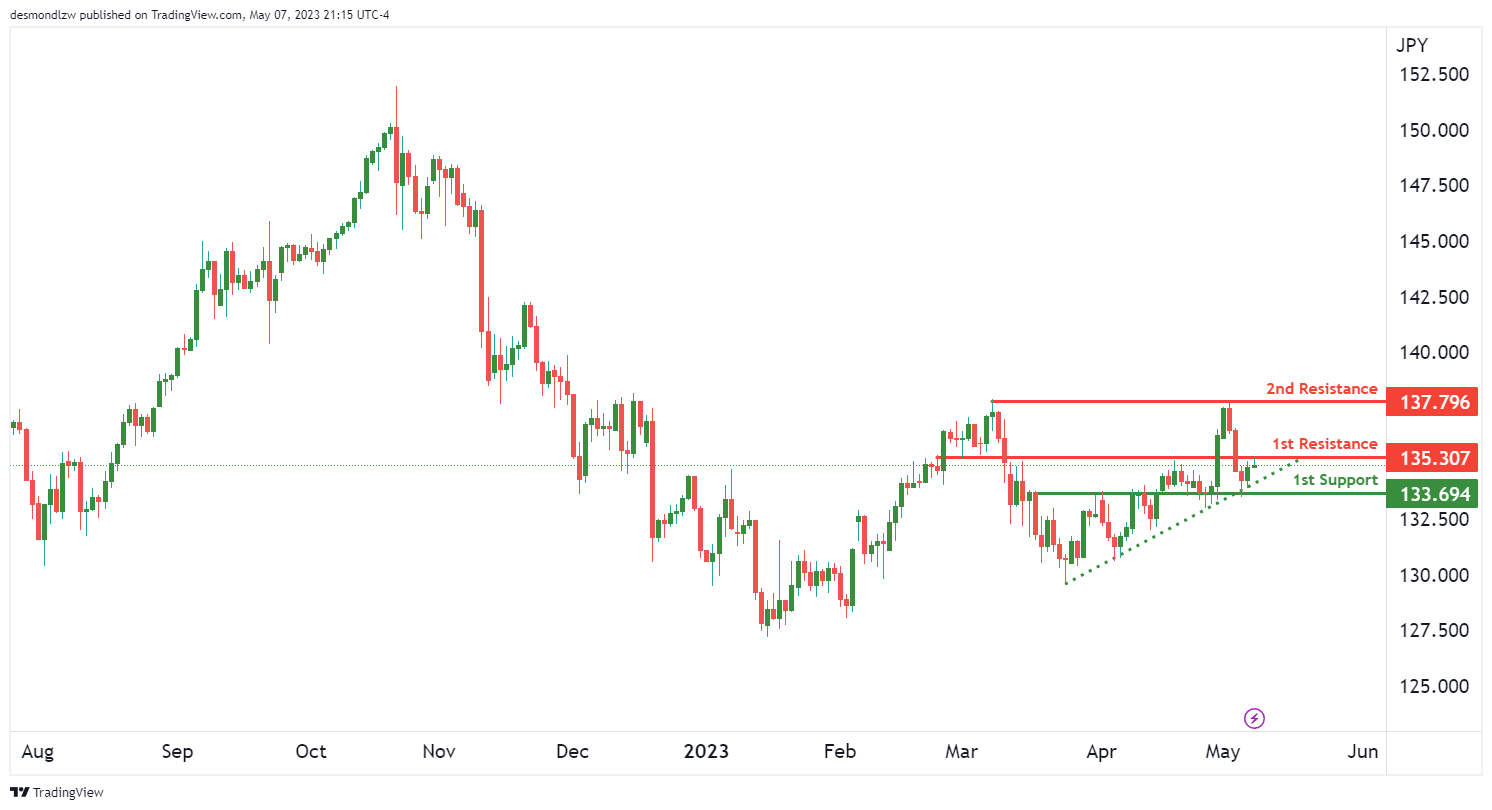
USD/JPY:
USD/JPY is currently experiencing a strong bullish momentum, as indicated by the fact that price is above a major ascending trend line. This suggests that there could be further upward momentum in the near future.
The first support level for USD/JPY is at 133.69, which is an overlap support. Additionally, the price is testing a major support level which has a 38.2% Fibonacci retracement lining up with it. If price bounces off this level, it could rise towards the first resistance level at 135.30, which is a pullback resistance that also coincides with a descending trend line.
There is an intermediate resistance at 136.04, which is between where the price is currently and our first resistance. If price were to break this intermediate resistance, it could trigger a stronger bullish acceleration towards our first resistance.
If it breaks the first resistance level, it could potentially rise towards the second resistance at 137.79, which is a multi-swing high resistance.
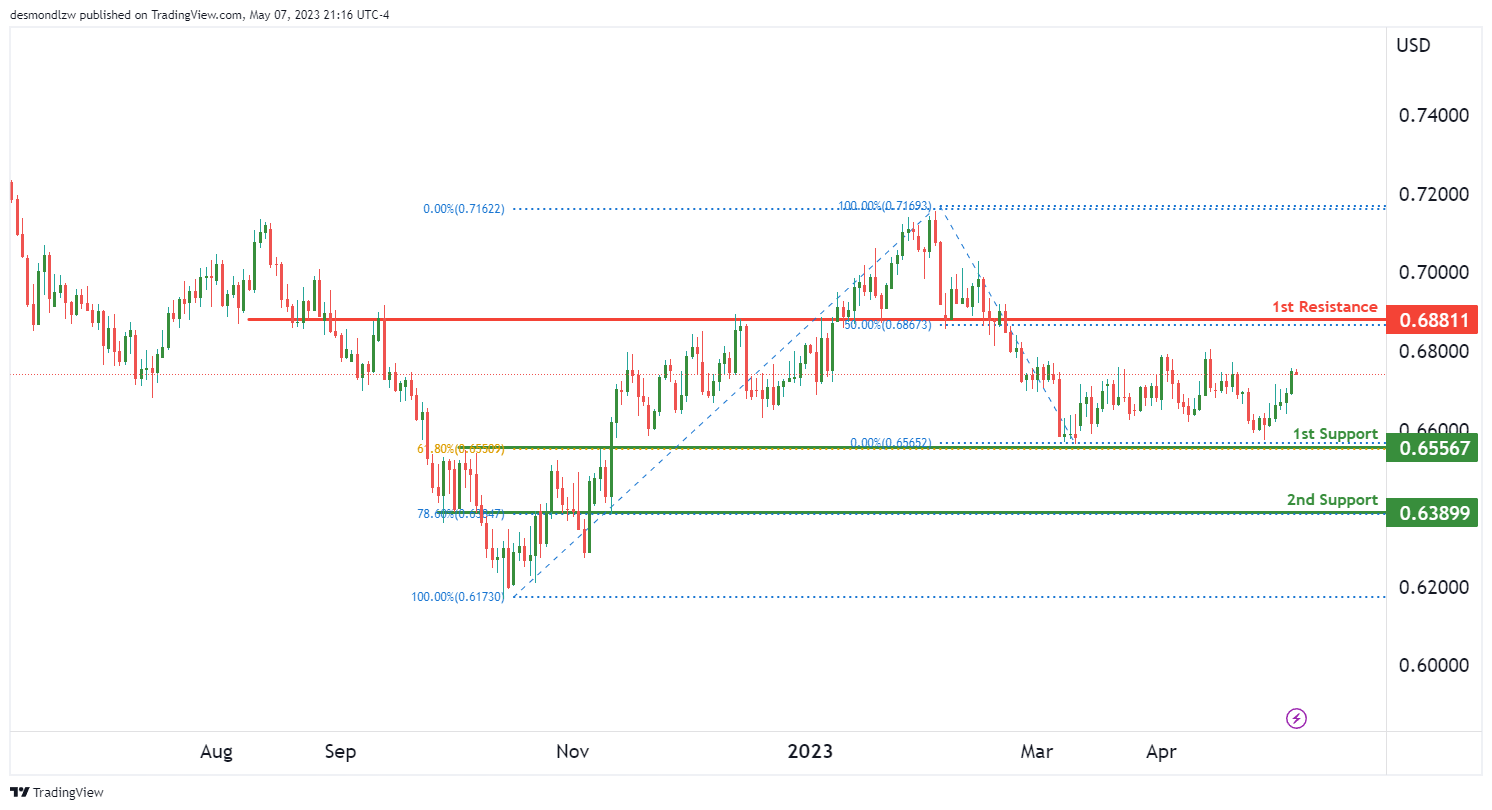
AUD/USD:
The AUD/USD chart is showing strong bullish momentum and is potentially heading towards the first resistance level. The first support at 0.6556 is a good level as it is an overlap support and coincides with a 61.80% Fibonacci retracement. Another support level to keep an eye on is the 0.6389 level, which is also an overlap support and lines up with a 78.60% Fibonacci retracement.
On the other hand, the first resistance at 0.6881 is a level to watch as it is a pullback resistance and coincides with a 50% Fibonacci retracement. If price manages to break through this resistance, it could potentially continue towards higher levels.
Overall, the chart is showing bullish momentum and a potential for a continuation towards the first resistance level. However, it’s important to keep an eye on the support levels as a break below these levels could indicate a shift in momentum towards the downside.
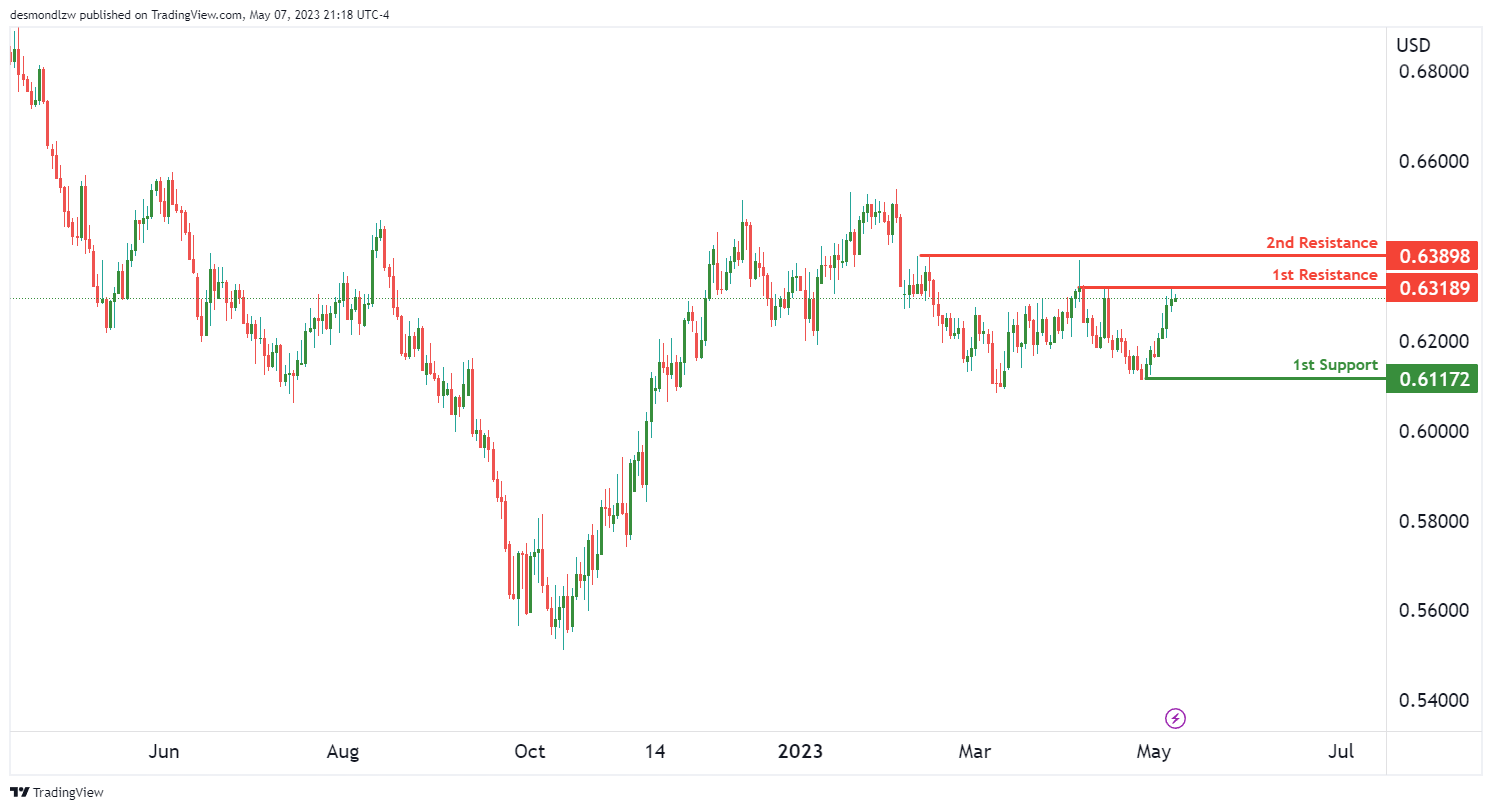
NZD/USD:
The NZD/USD chart is currently displaying bearish momentum, with the potential for a drop in the near future. The overall bias of the chart is bearish, indicating that prices may fall in the short term.
The price could potentially make a bearish reaction off the 1st resistance and drop to the 1st support. The 1st support level is at 0.6117, which is a swing low support. If the price were to drop further, it may hit our 2nd support level at 0.0000, which is also a swing low support level.
On the other hand, the 1st resistance level is at 0.6318, which is a multi-swing high resistance level. If the price were to break this resistance, it may rise to our 2nd resistance level at 0.6389, which is also a multi-swing high resistance level.
It’s important to note that RSI is not providing any bullish or bearish signals at the moment. However, the bearish momentum on the chart is indicating that the price may drop in the near future.
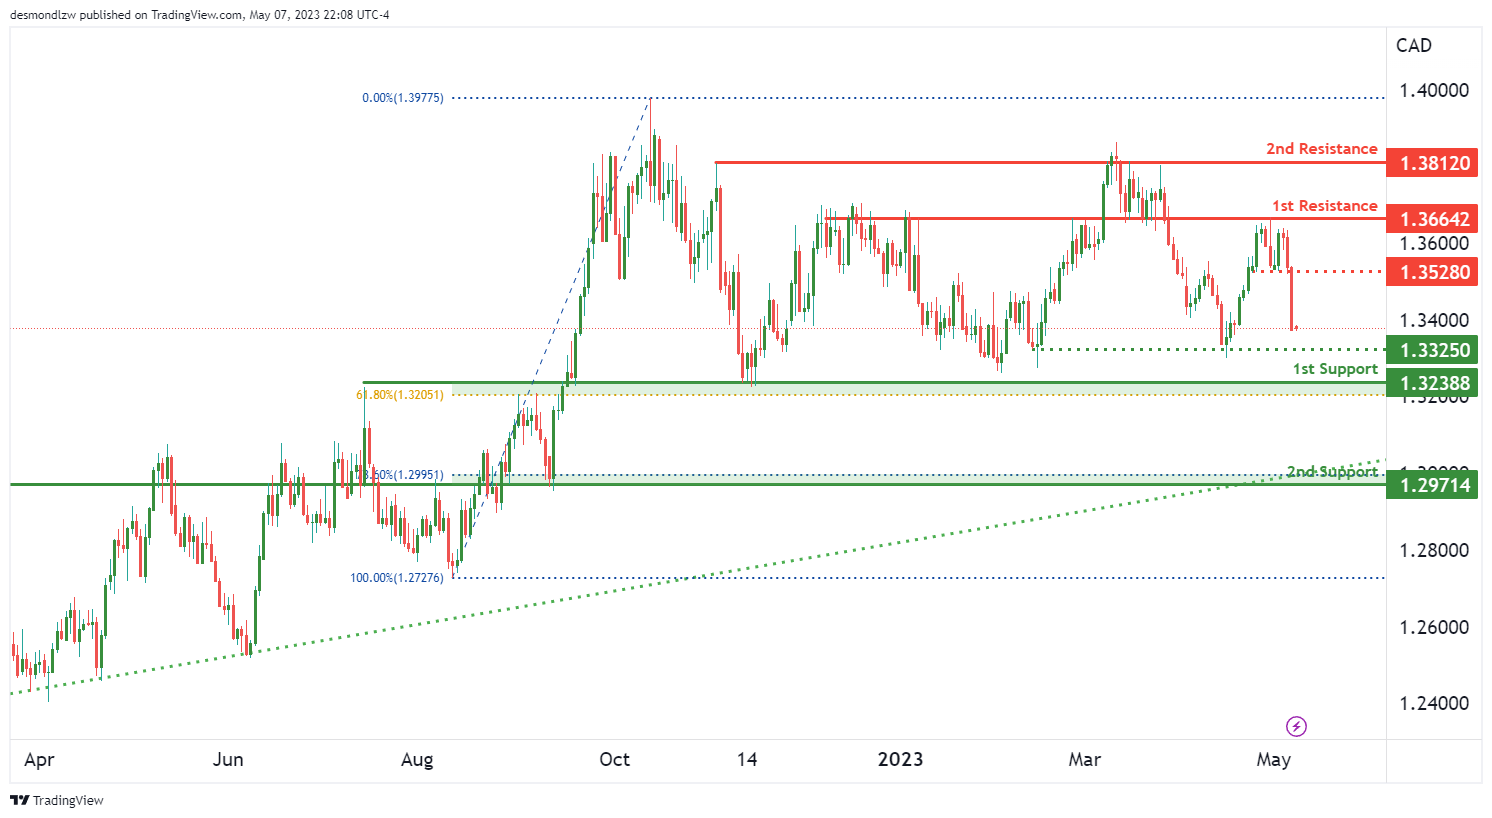
USD/CAD:
The USD/CAD chart has an overall bearish momentum. The potential price movement is a continuation of the bearish trend towards the first support level at 1.3239. This support level is significant as it is an overlap support and is also aligned with a 61.80% Fibonacci retracement level.
If the price continues to drop, it may reach the second support level at 1.2971, which is also an overlap support level and coincides with a 78.60% Fibonacci retracement level.
On the other hand, the first resistance level is at 1.3664, which is a significant overlap resistance level. The second resistance level is at 1.3812, which is also an overlap resistance level.
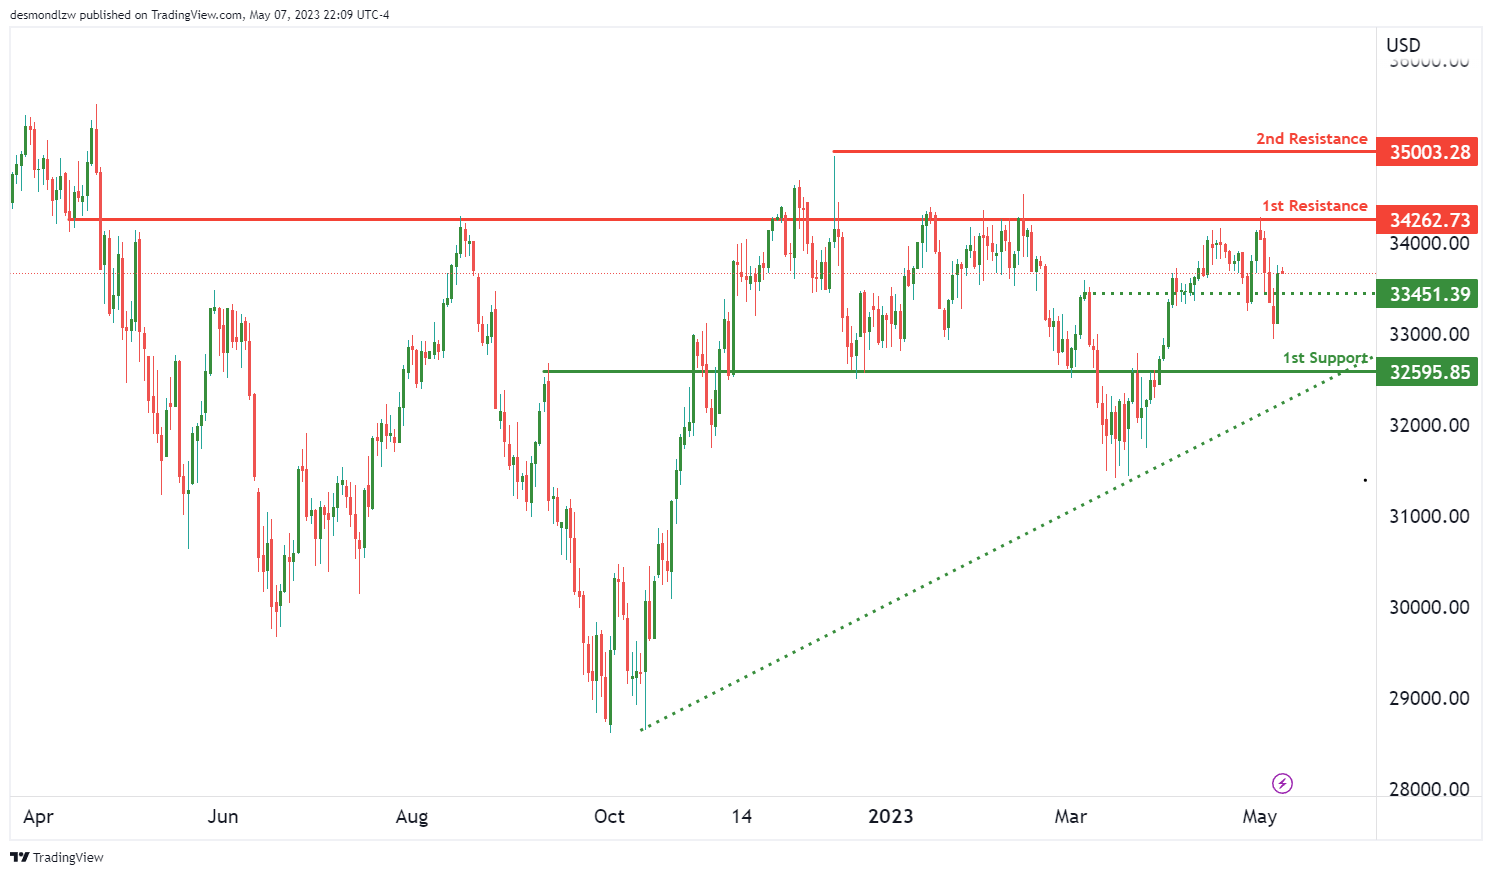
DJ30:
The DJ30 chart currently has a bearish momentum. If the trend continues, the price could potentially make a bearish continuation towards the first support.
The intermediate support level is at 33,451.39 and is an overlap support. If the price breaks through this level, it could potentially drop further towards the first support at 32,595.85, which is also an overlap support.
On the other hand, if the price manages to break through the resistance levels, it could potentially turn bullish. The first resistance level is at 34,262.73 and is an overlap resistance. The second resistance level is at 3,5003.28 and is also an overlap resistance.
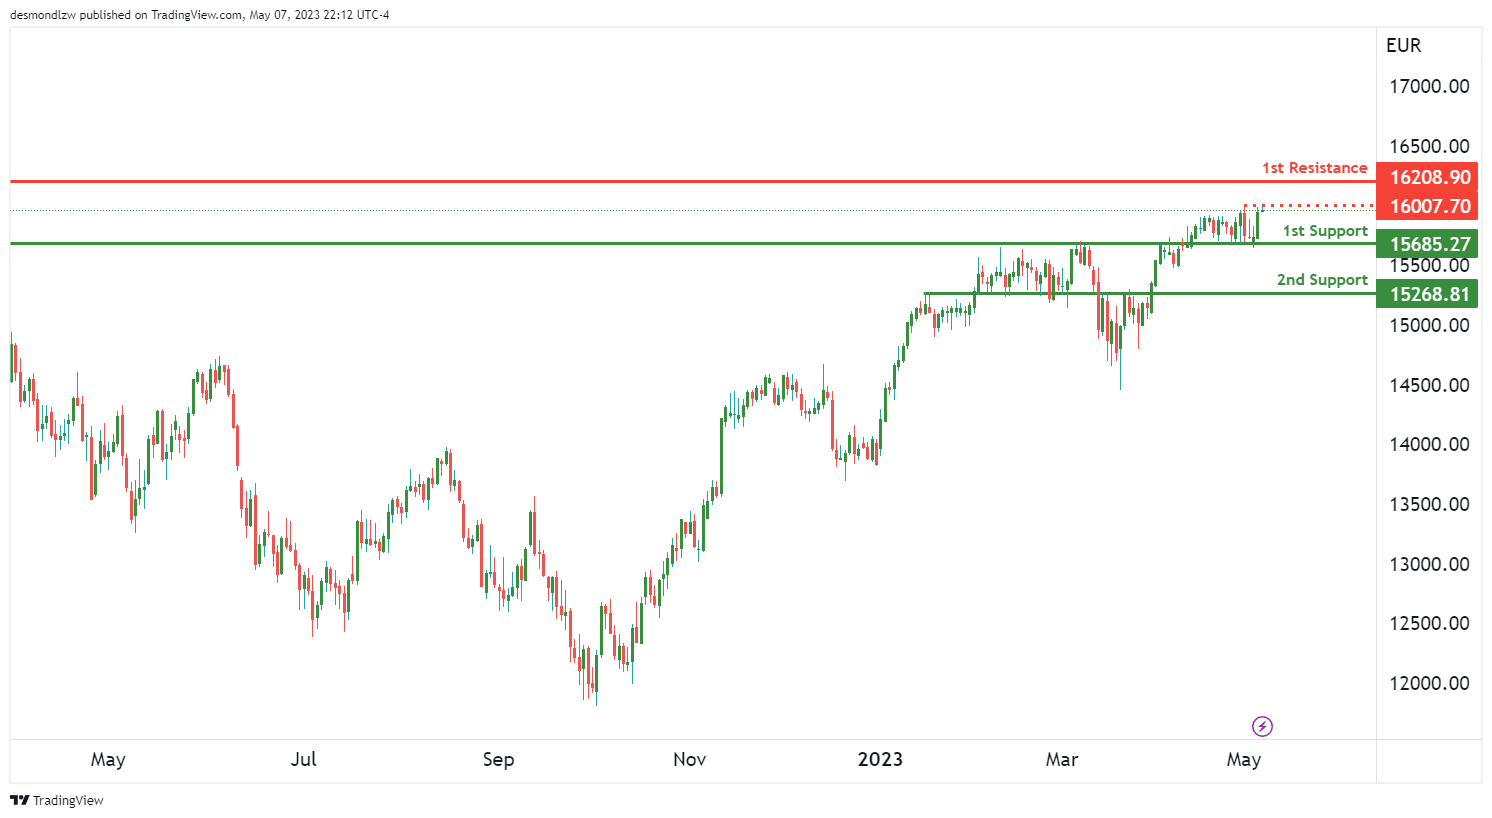
GER30:
The GER30 chart is currently showing a bullish momentum, with potential for price to continue rising towards the 1st resistance level. There are several key support and resistance levels to watch out for.
The 1st support level is at 15,685.27, which is a strong overlap support level. If price were to drop to this level, it could potentially bounce back up towards the intermediate resistance level at 16,007.70.
The 2nd support level is at 15,268.81, another overlap support level. This level could provide further support if price were to drop below the 1st support level.
On the other hand, the 1st resistance level at 16,208.90 is a strong overlap resistance level. If price were to break through the intermediate resistance level at 16,007.70, it could potentially rise towards the 1st resistance level.
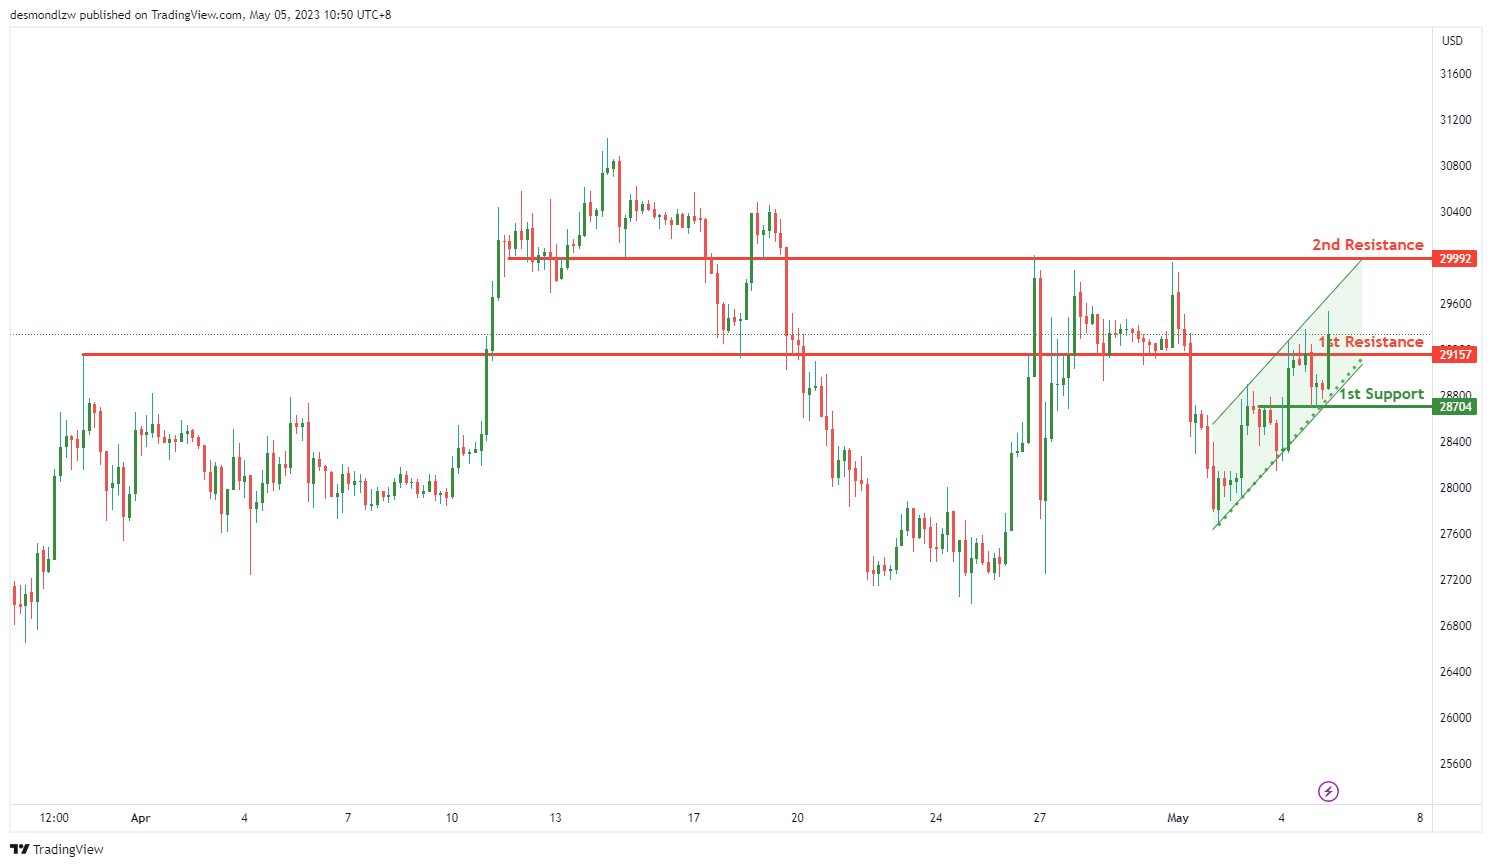
BTC/USD:
BTC/USD is currently seeing strong bullish momentum, as indicated by its position in a bullish ascending channel. The overall momentum of the chart is bullish, and this is reinforced by the fact that price is within a bullish ascending channel, which suggests that price might continue to rise due to its bullish momentum.
Price could potentially make a bullish break through the 1st resistance at 29157 and rise to the 2nd resistance at 29992. This is a significant level for the price of BTC/USD, as it marks an overlap resistance that has the potential to trigger a strong bullish acceleration towards the 2nd resistance level.
In terms of support, the 1st support level is at 28704, and it is an overlap support. This level is important because it can act as a base for the price to bounce off of and potentially continue its bullish trend.
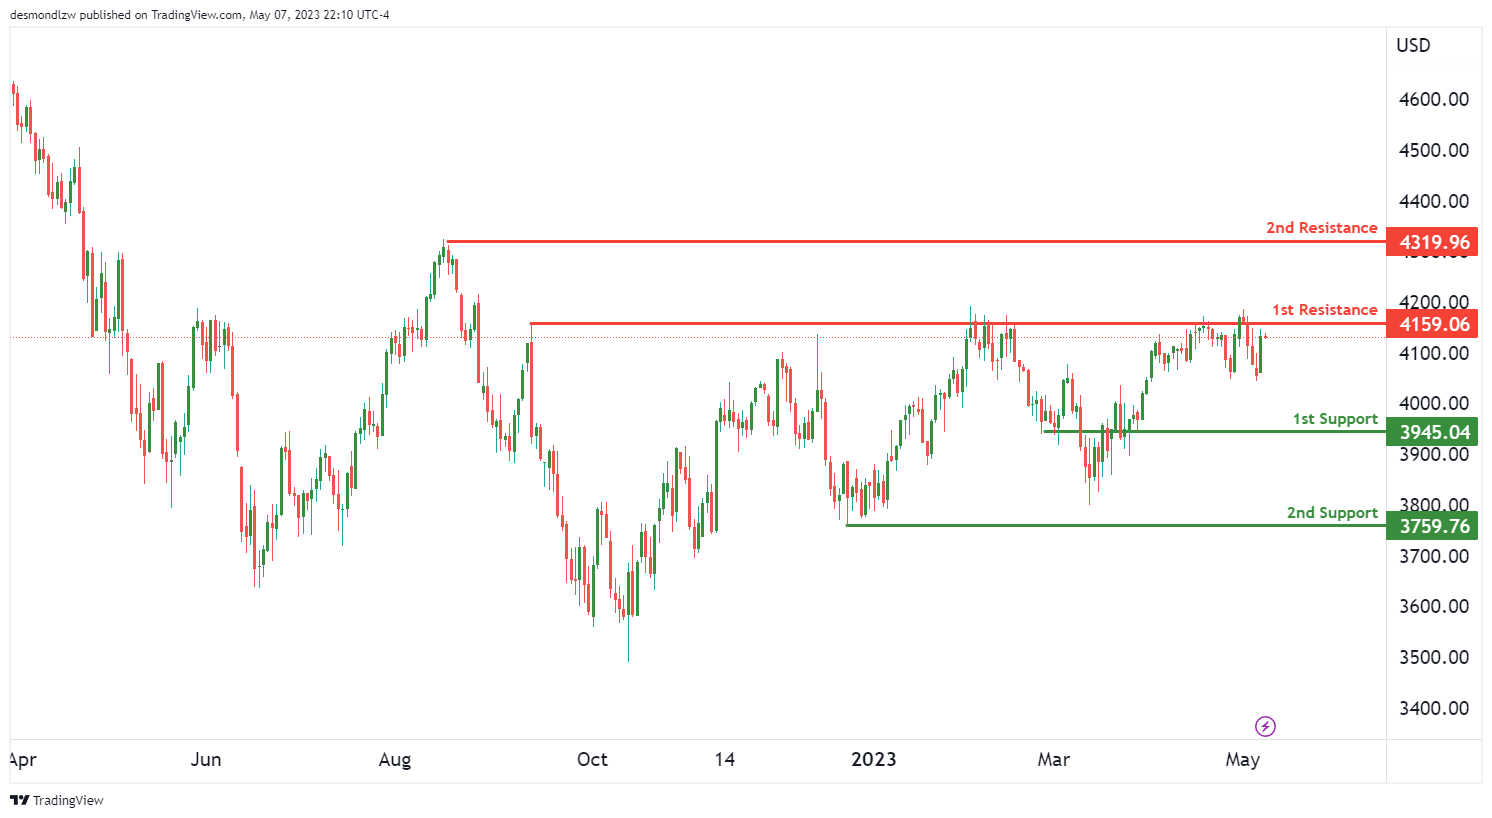
US500
The overall momentum of the US500 chart is bullish with low confidence. However, there is a potential for a bullish break through of the 1st resistance, which could lead to a rise towards the 2nd resistance.
The 1st support level is at 3,945.04, which is an overlap support level. The 2nd support level is at 3,759.76, which is also an overlap support level.
On the resistance side, the 1st resistance level is at 4,159.06, which is an overlap resistance level. The 2nd resistance level is at 4,319.96, which is also an overlap resistance level. If price does not break through the 1st resistance, it could potentially fall towards the 1st support level.
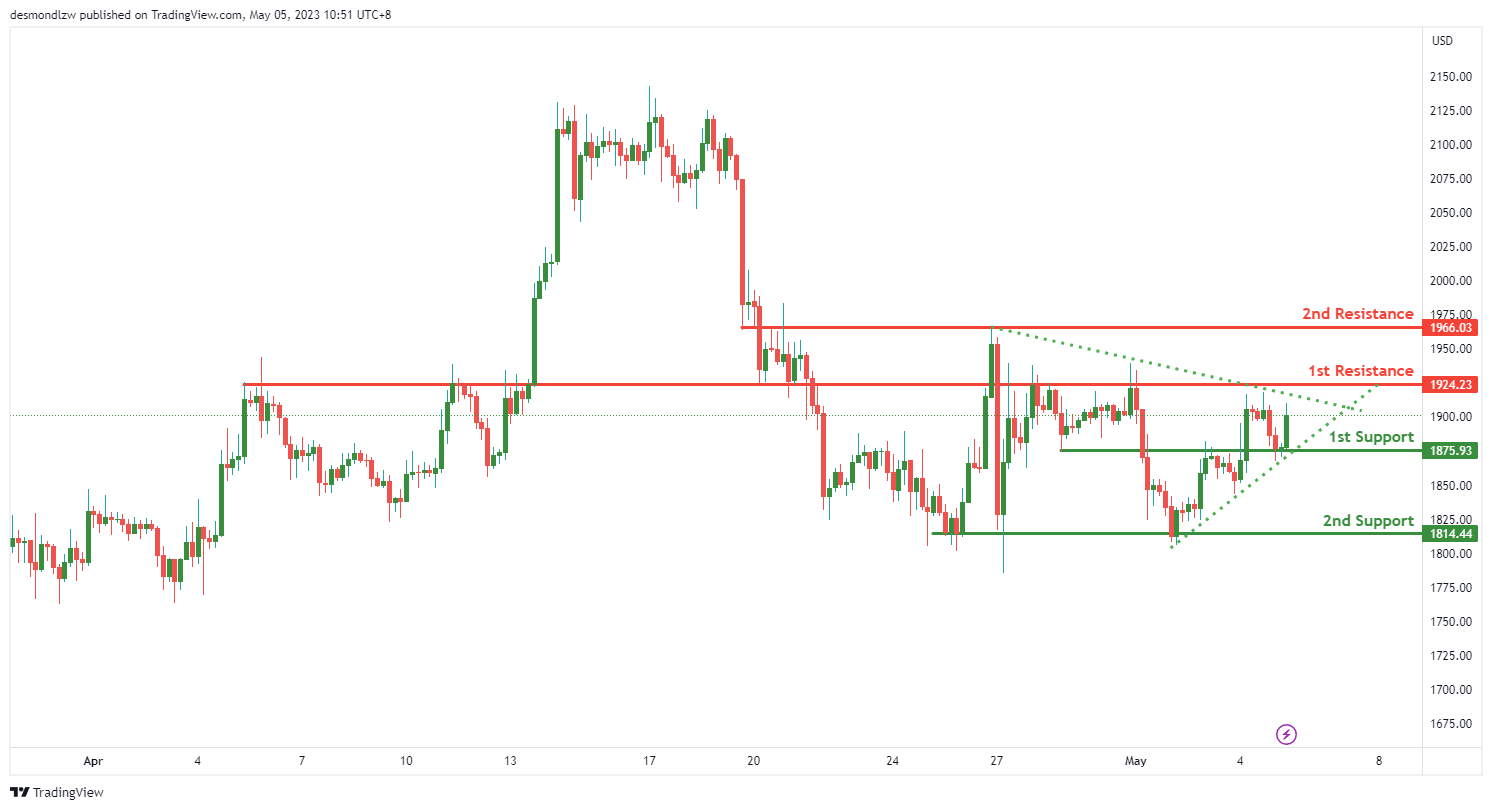
ETH/USD:
The ETH/USD chart is currently exhibiting a bullish momentum, which suggests that the price might continue to rise due to its bullish momentum. The overall momentum of the chart is bullish, and the price could potentially make a bullish continuation towards the 1st resistance level.
The 1st support level is at 1875.93, which is an overlap support level. This means that this level has been tested several times in the past and has held as a support level, which makes it a strong level to watch out for. The 2nd support level is at 1814.44, which is a multi-swing low support level.
The 1st resistance level is at 1924.23, which is an overlap resistance level. This level has been tested several times in the past and has acted as a strong resistance level. The 2nd resistance level is at 1966.03, which is also an overlap resistance level.
Additionally, there is a symmetrical triangle chart pattern on the chart, which represents a period of consolidation before the price is forced to breakout or breakdown. This suggests that there might be a potential breakout in the near future, which could lead to a bullish continuation in price.
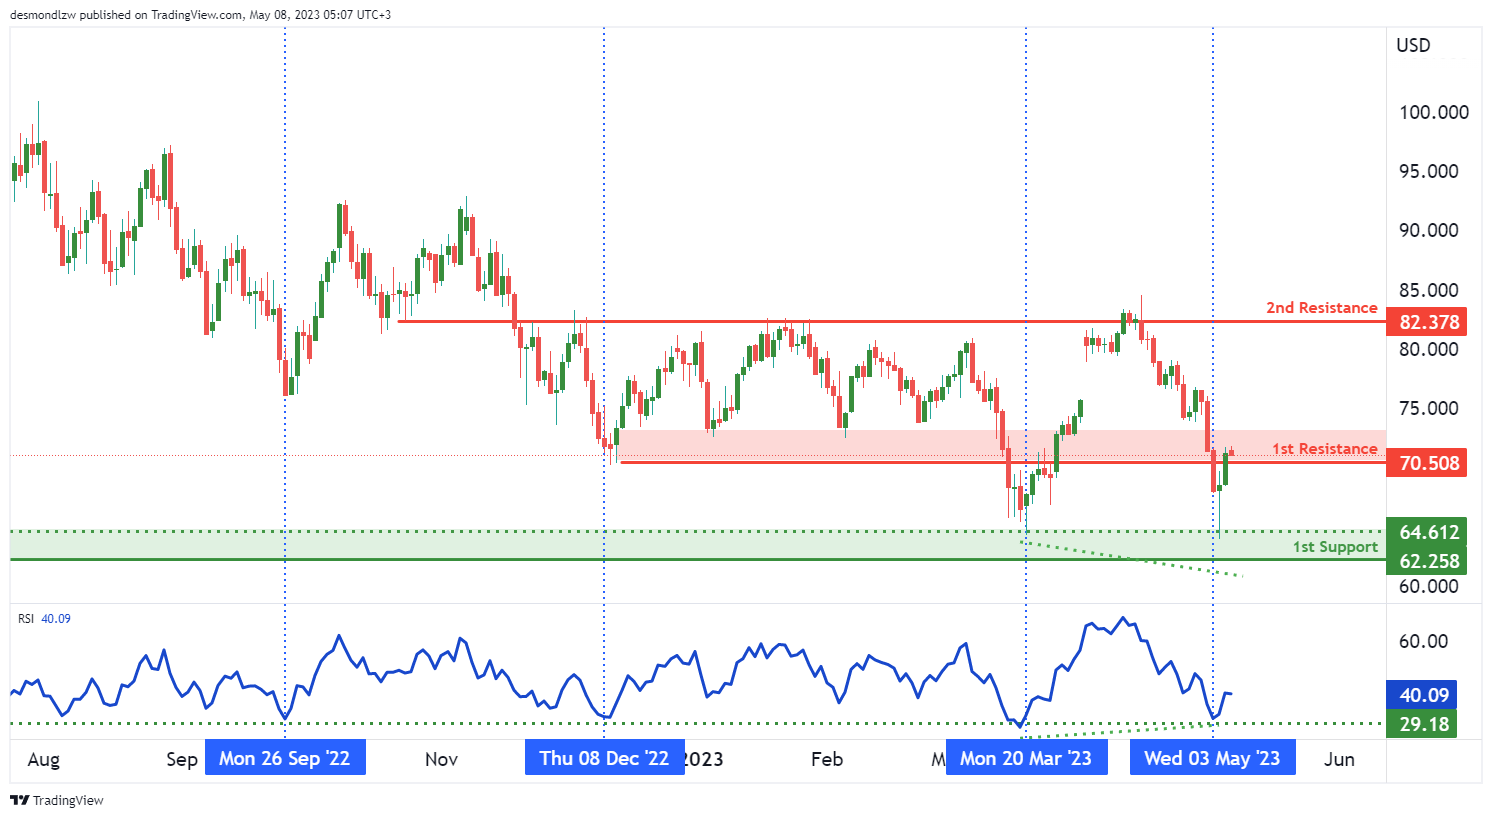
WTI/USD:
The overall momentum of WTI appears weak bullish with low confidence. However, price has broken through the 1st resistance level at 70.51 and could potentially rise towards the 2nd resistance level at 82.38. In terms of support levels, the intermediate support level is at 64.61 and the 1st support level is at 62.26.
One reason why the 1st resistance level is good is because it is an overlap resistance, meaning that it has been a significant level of price resistance in the past. If price can stay above this level, WTI could make a run towards the 2nd resistance level.
Similarly, the intermediate and 1st support levels are also good as they are both overlap supports, indicating that they have previously provided strong support for the price.
In addition, the RSI is displaying bullish divergence versus price, suggesting that a rapid incline in price may occur.
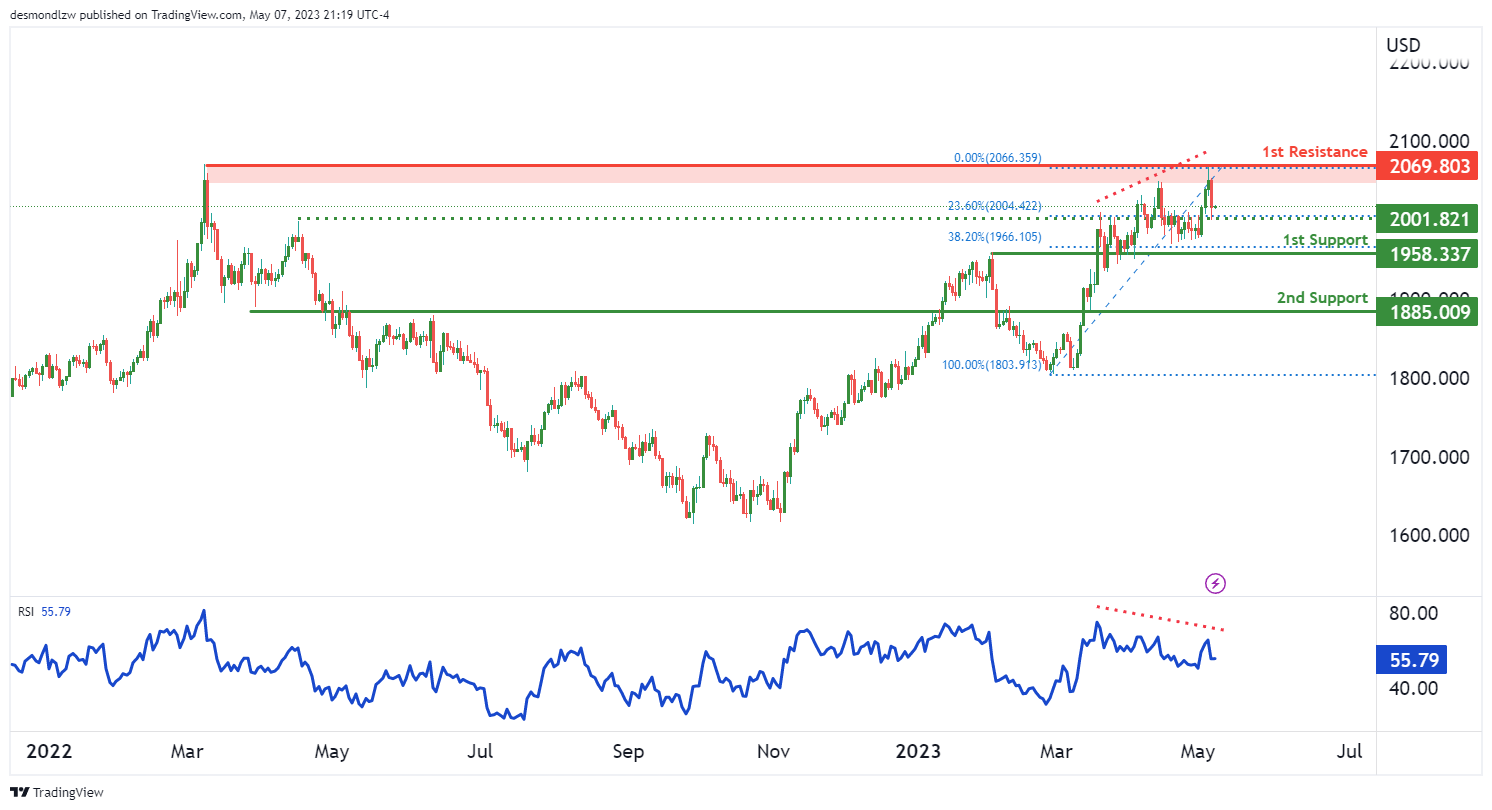
XAU/USD (GOLD):
old has been on a bearish trend in recent times, and the XAU/USD chart shows that this momentum is likely to continue in the short term. The overall momentum of the chart is bearish, indicating that prices are more likely to fall than rise. In fact, price could potentially make a bearish continuation towards the 1st support.
The 1st support is at 1958.33, and it is a strong overlap support that coincides with a 38.20% Fibonacci retracement. If the price were to break below this support level, it could drop to the 2nd support at 1885.00, which is also an overlap support.
On the other hand, the 1st resistance is at 2069.80, and it is a multi-swing high resistance level. If the price were to break above this resistance level, it could potentially rise towards the next resistance level at 2183.00.
However, the RSI indicator is also displaying bearish divergence versus price, which suggests that a reversal might occur soon. This reinforces the likelihood of a bearish continuation towards the 1st support.
It’s worth noting that there is an intermediate support level at 2001.82, which is also an overlap support and coincides with a 23.60% Fibonacci retracement. This level could provide a temporary bounce if the price were to drop towards the 1st support.


