
DXY:
The DXY chart is currently showing a bullish momentum overall, but a short-term drop to the 1st support level is possible before a rise to the 1st resistance level.
Currently, the DXY chart is seeing a multi-swing low support level at 101.02, which is a strong reason for its potential to be a good support level. Additionally, there is a swing low support level at 100.82, further reinforcing the strength of the support levels.
On the other hand, the 1st resistance level at 101.79 is a multi-swing high resistance level, which coincides with a 61.80% Fibonacci retracement. This makes it a strong level of resistance, suggesting that if the price were to rise to this level, it may struggle to break through.
The 2nd resistance level at 102.26 is another multi-swing high resistance level, adding to the potential resistance that the price may face if it were to rise further.
EUR/USD:
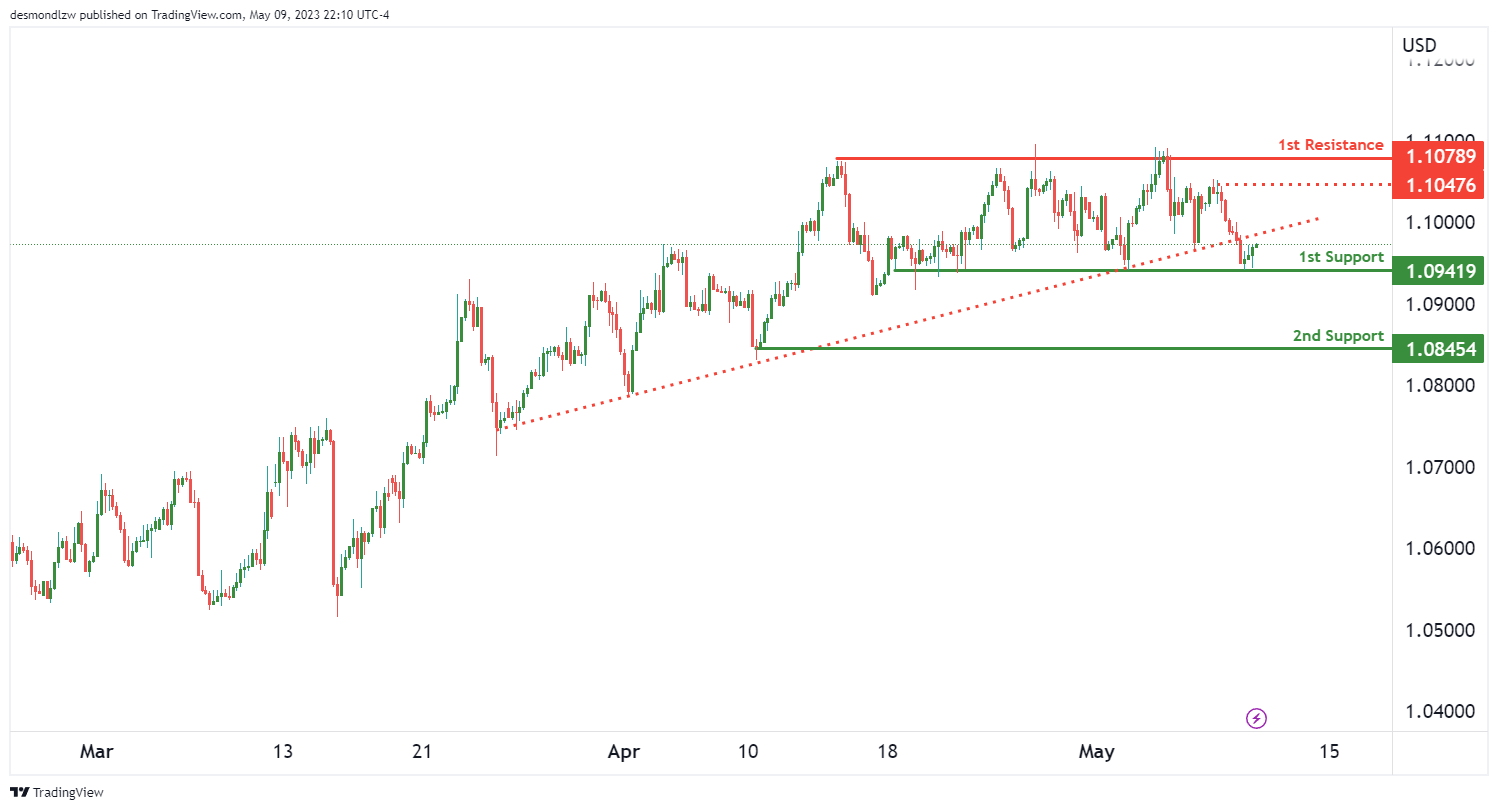
The EUR/USD chart is currently showing a bearish momentum overall, with the price having broken below an ascending support line, triggering a potential bearish move.
The 1st support level at 1.0941 is a multi-swing low support level, making it a strong level of support. Additionally, there is a swing low support level at 1.0945, which further reinforces the strength of the support levels.
However, the potential for a bearish break off the 1st support level may see the price drop towards the 2nd support level.
On the resistance side, there is a multi-swing high resistance level at 1.1078, which is a strong level of resistance that the price may struggle to break through. Additionally, there is an intermediate resistance level at 1.1047, which is another multi-swing high resistance level adding to the potential resistance that the price may face.
GBP/USD:
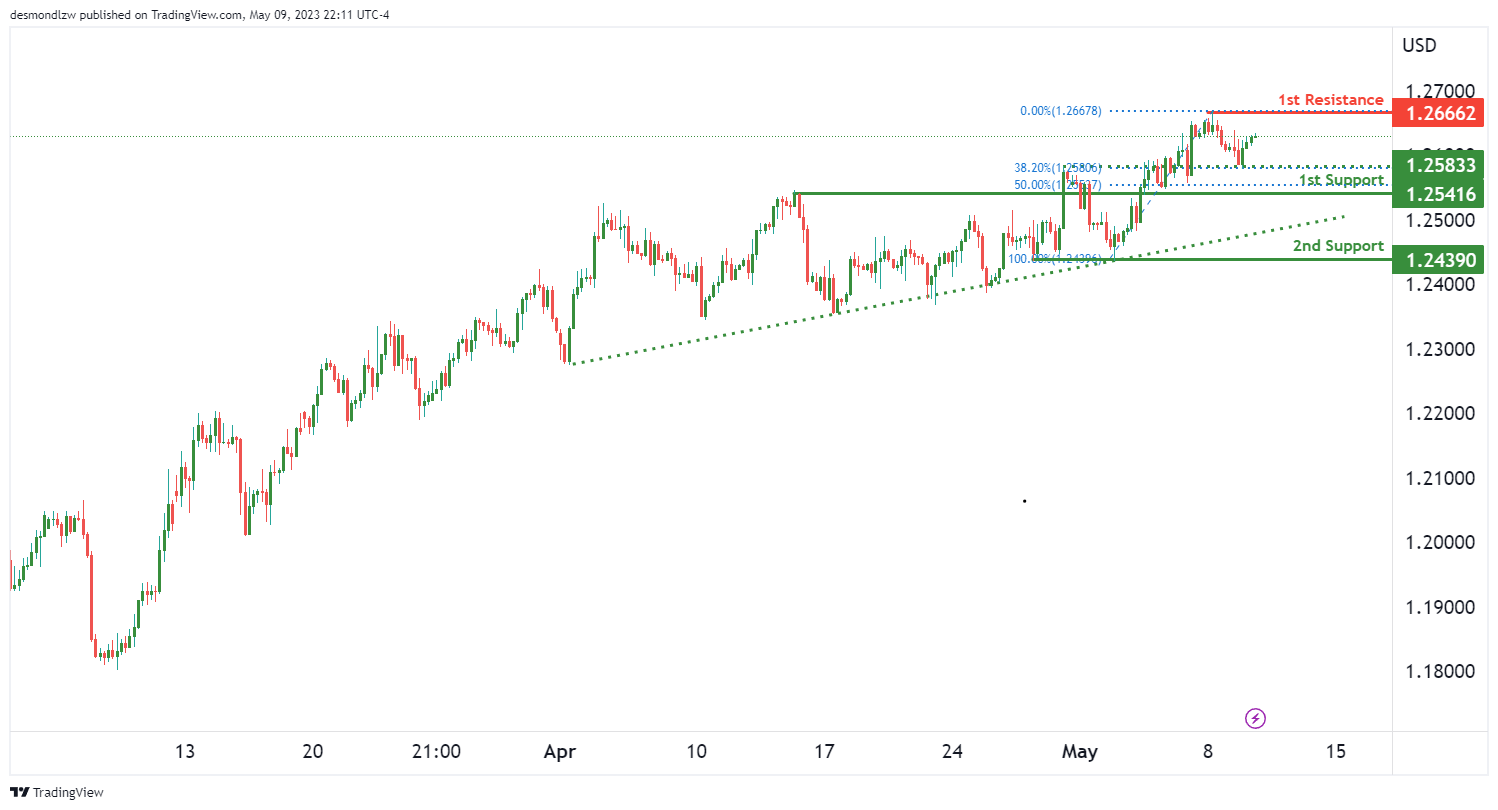
The GBP/USD chart is currently showing a bullish momentum overall, with the price being above a major ascending trend line, which suggests that further bullish momentum may be on the cards.
The 1st support level at 1.2541 is an overlap support level, with a 50% Fibonacci retracement, making it a strong level of support. Additionally, there is a multi-swing low support level at 1.2439, which further reinforces the strength of the support levels.
On the resistance side, there is a swing high resistance level at 1.2662, which is a strong level of resistance that the price may struggle to break through. Furthermore, there is an intermediate support level at 1.2583, which is an overlap support level, coinciding with a 38.20% Fibonacci retracement and adding to the potential support that the price may face.
The potential for a bullish continuation towards the 1st resistance level is seen, given the strong momentum of the chart.
It is important to note that the current price is above the major ascending trend line, suggesting that further bullish momentum may be expected.

USD/CHF:
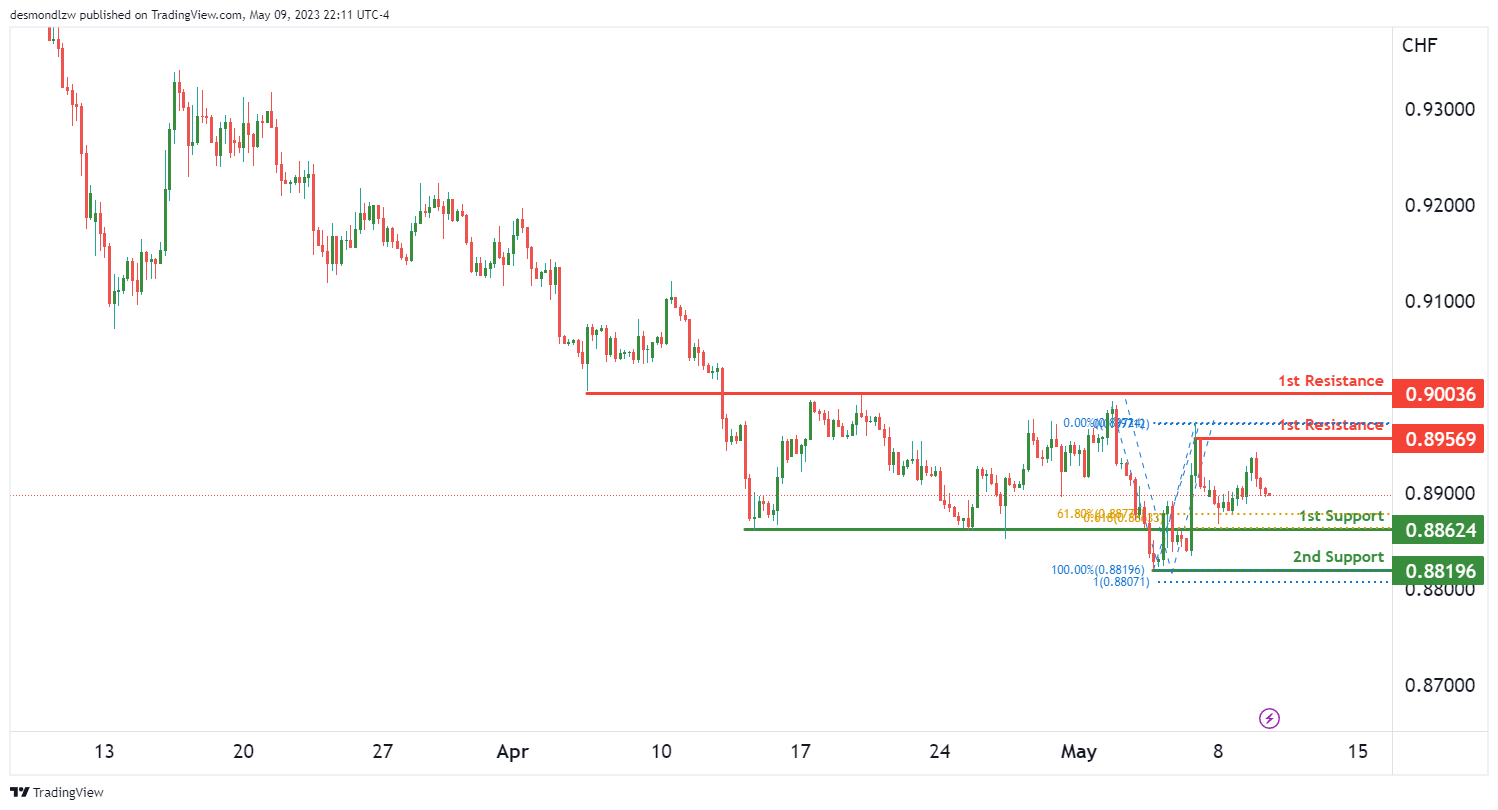
The USD/CHF chart is currently showing a bearish momentum overall, with the potential for a continuation towards the 1st support level.
The 1st support level at 0.8862 is an overlap support level, with a 61.80% Fibonacci retracement and a 61.80% Fibonacci projection, making it a strong level of support due to Fibonacci confluence. Additionally, there is a multi-swing low support level at 0.8819, which further reinforces the strength of the support levels, as it is a 100% Fibonacci projection.
On the resistance side, there is a swing high resistance level at 0.8959, which is a strong level of resistance that the price may struggle to break through. Furthermore, there is an overlap resistance level at 0.9003, which adds to the potential resistance that the price may face.
The potential for a bearish continuation towards the 1st support level is seen, given the strong momentum of the chart.
USD/JPY:
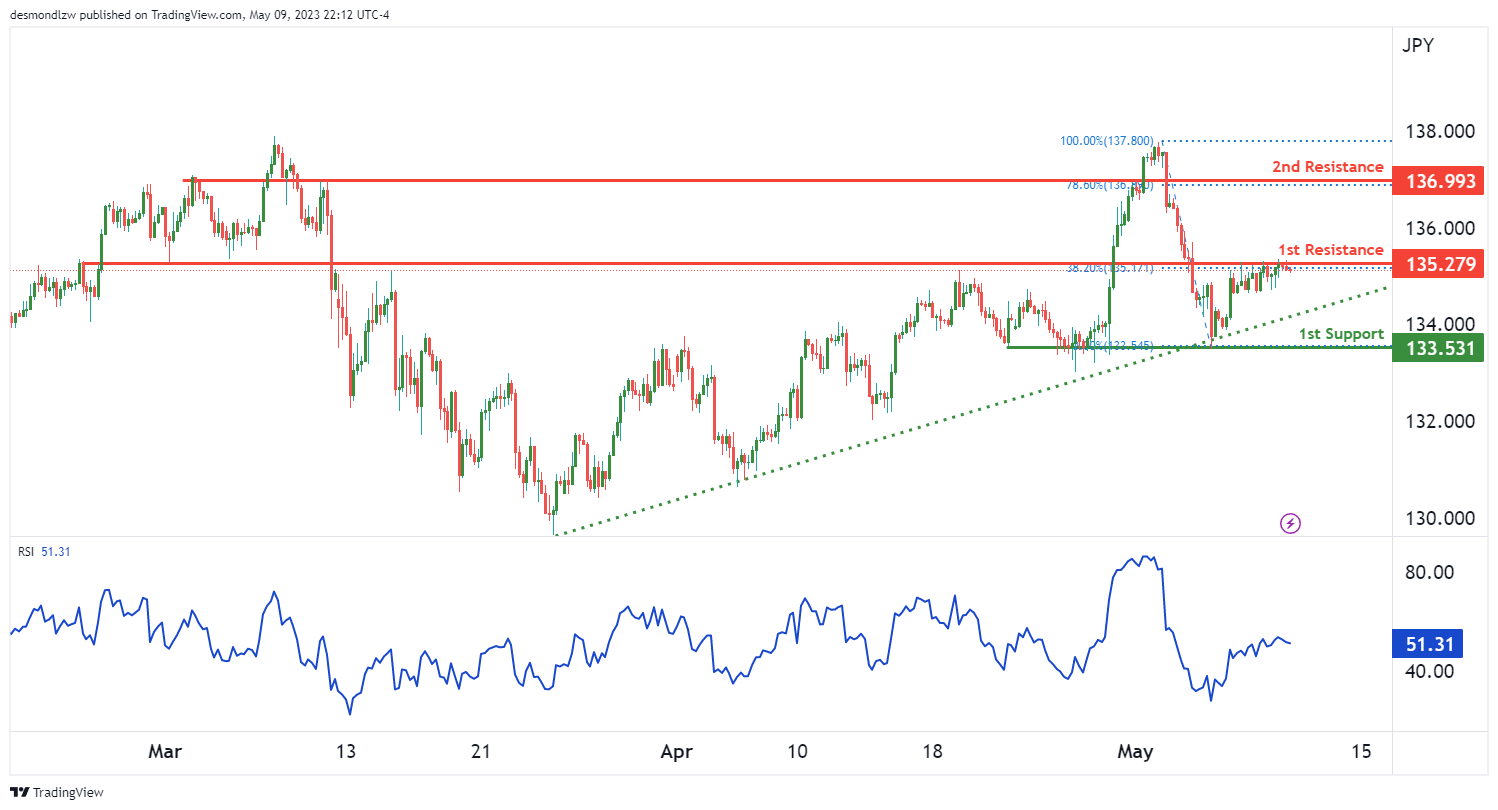
The USD/JPY chart is currently showing a bullish momentum overall, with the price being above a major ascending trend line, which suggests that further bullish momentum may be on the cards.
The 1st support level at 133.53 is a multi-swing low support level, making it a strong level of support.
On the resistance side, there is an overlap resistance level at 135.27, which is a strong level of resistance that the price may struggle to break through. Furthermore, there is another overlap resistance level at 136.99, which is a strong level of resistance and coincides with a 78.60% Fibonacci retracement.
The potential for a bullish break through of the 1st resistance level and a rise towards the 2nd resistance level is seen, given the strong momentum of the chart.
It is important to note that the current price is above the major ascending trend line, suggesting that further bullish momentum may be expected.
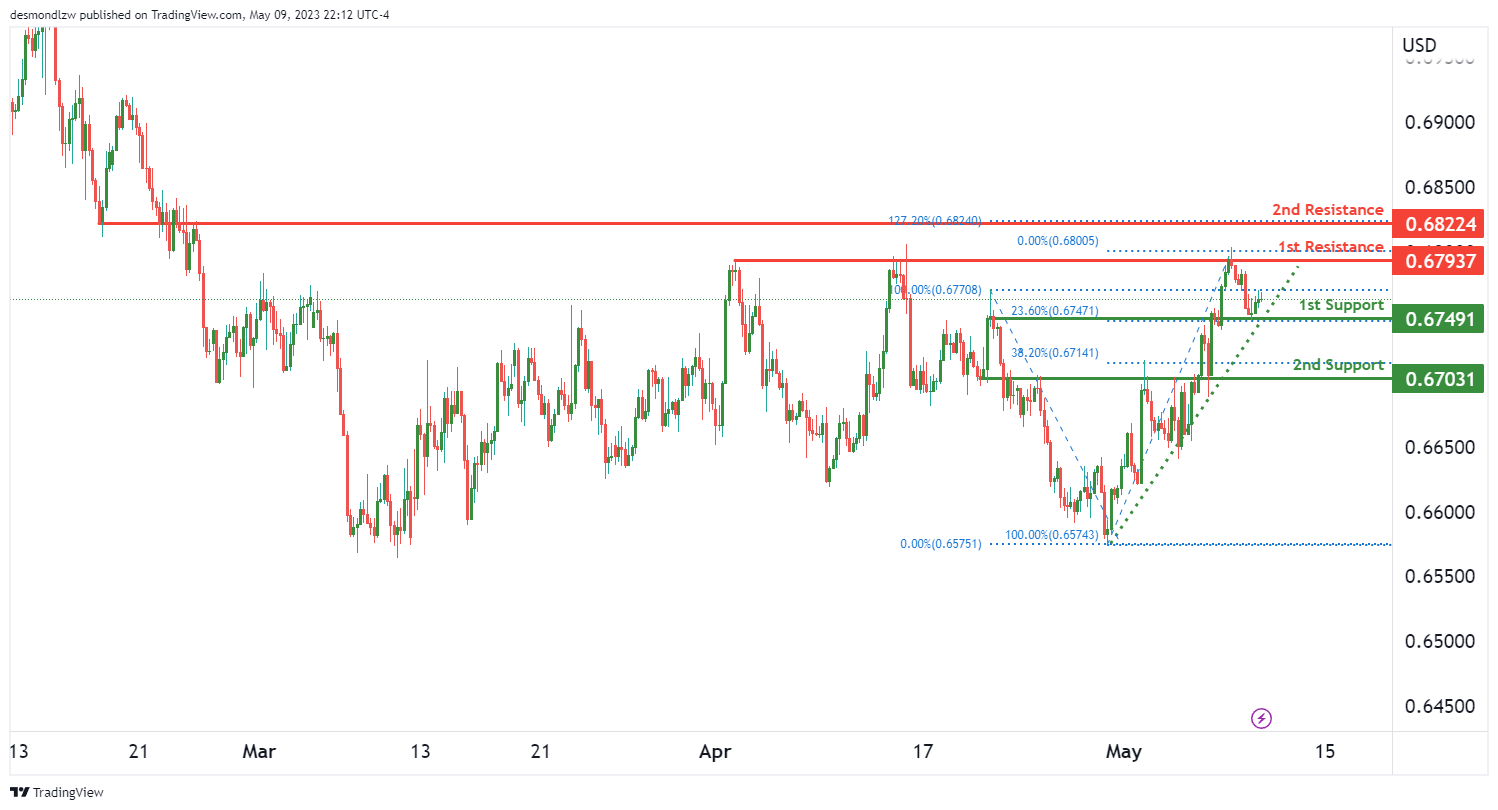
AUD/USD:
The AUD/USD chart is currently showing a bullish momentum overall, with the price being above a major ascending trend line, which suggests that further bullish momentum may be on the cards.
The 1st support level at 0.6749 is an overlap support level, with a 23.60% Fibonacci retracement, making it a strong level of support. Additionally, there is another overlap support level at 0.6703, which coincides with a 38.20% Fibonacci retracement and adds further to the potential support that the price may face.
On the resistance side, there is a multi-swing high resistance level at 0.6793, which is a strong level of resistance. Furthermore, there is an overlap resistance level at 0.6822, which coincides with a 127.20% Fibonacci extension and adds to the potential resistance that the price may face.
The potential for a bullish continuation towards the 1st resistance level is seen, given the strong momentum of the chart.
It is important to note that the current price is above the major ascending trend line, suggesting that further bullish momentum may be expected.
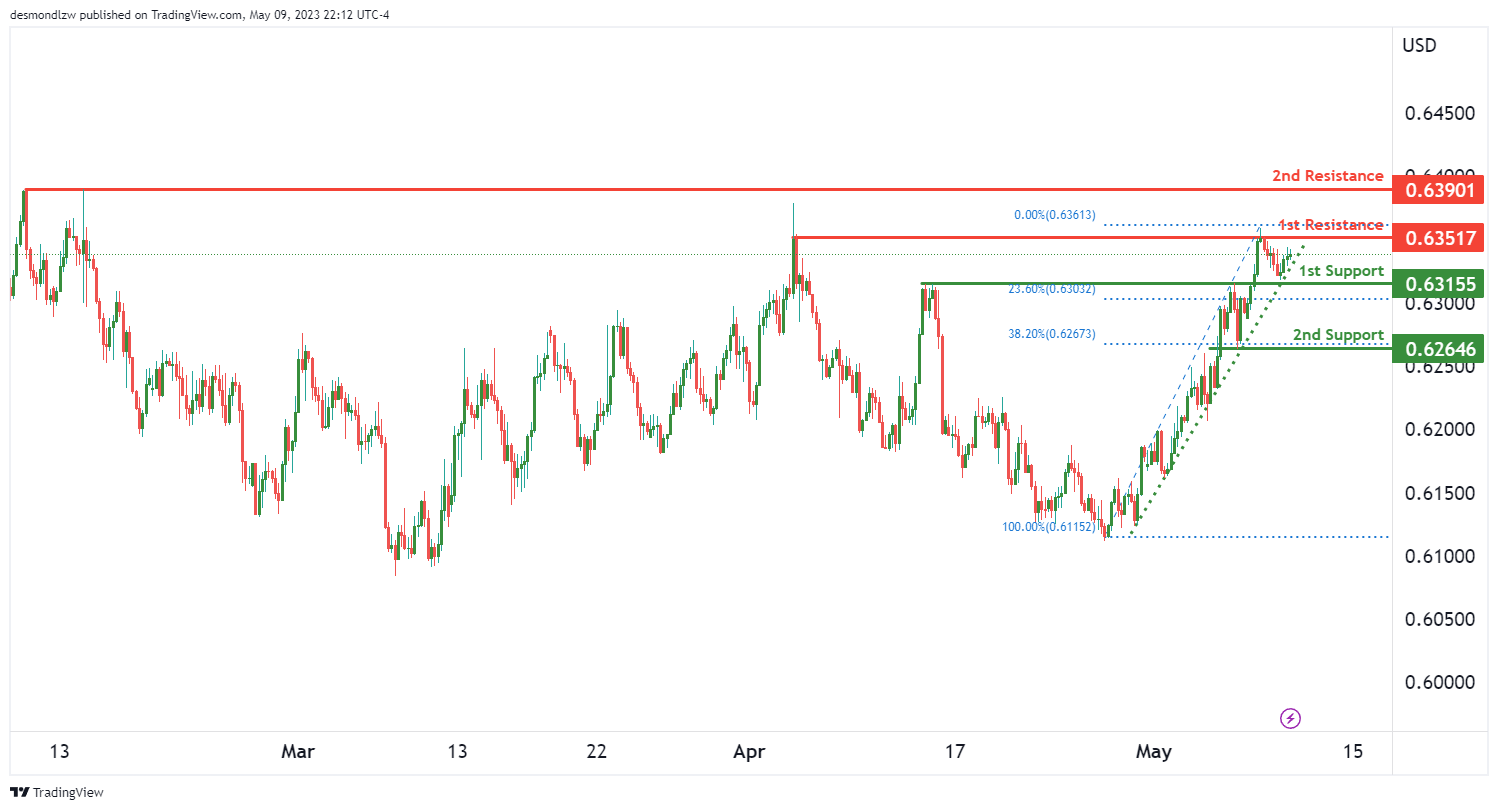
NZD/USD
The NZD/USD chart is currently showing a bullish momentum overall, with the price being above a major ascending trend line, which suggests that further bullish momentum may be on the cards.
The 1st support level at 0.6315 is an overlap support level, with a 23.60% Fibonacci retracement, making it a strong level of support. Additionally, there is another overlap support level at 0.6264, which coincides with a 38.20% Fibonacci retracement and adds further to the potential support that the price may face.
On the resistance side, there is a multi-swing high resistance level at 0.6351, which is a strong level of resistance. Furthermore, there is an overlap resistance level at 0.6390, which adds to the potential resistance that the price may face.
The potential for a bullish continuation towards the 1st resistance level is seen, given the strong momentum of the chart.
It is important to note that the current price is above the major ascending trend line, suggesting that further bullish momentum may be expected.
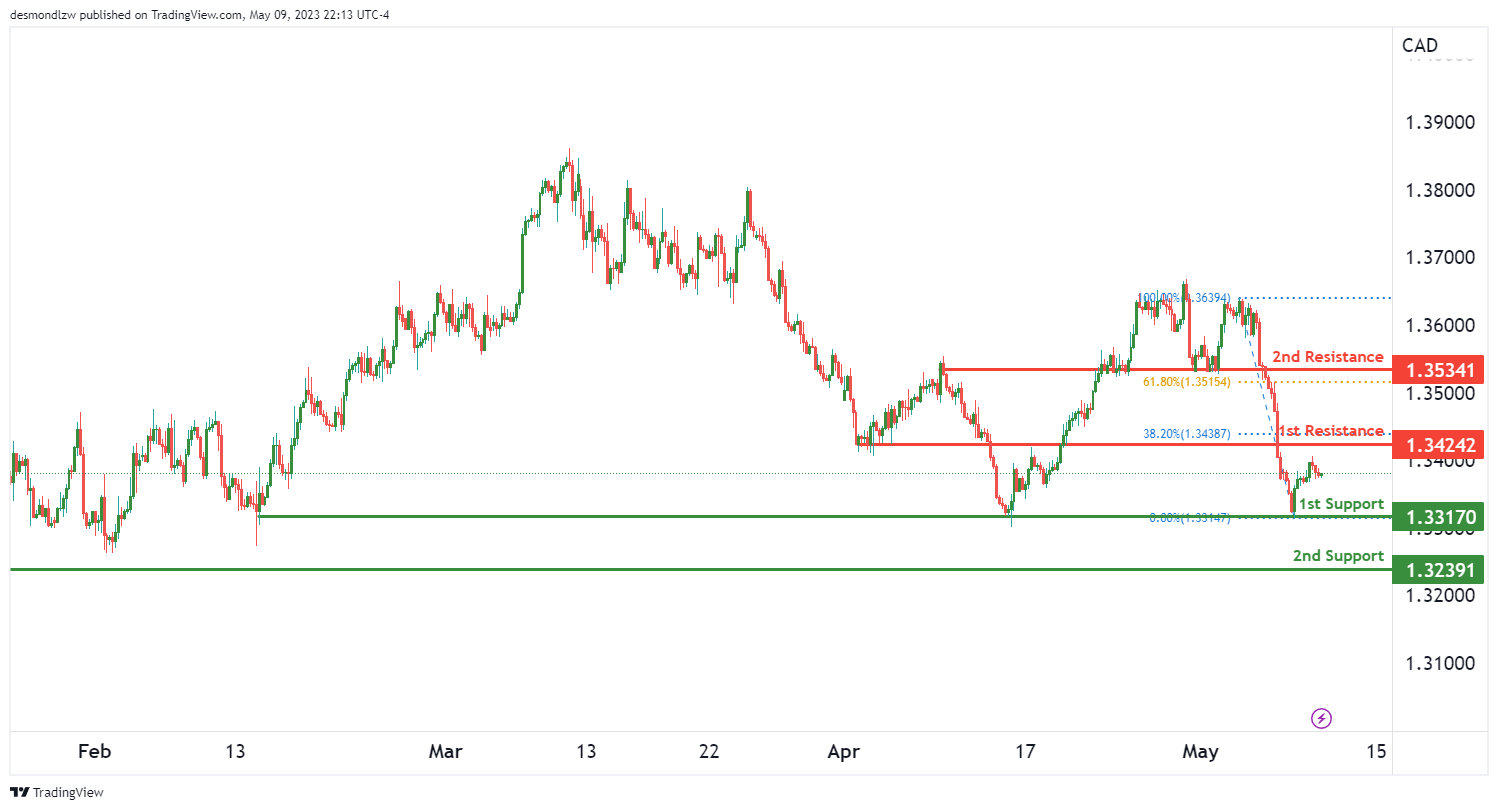
USD/CAD:
The USD/CAD chart is currently showing a bullish momentum overall, with a potential for a bullish continuation towards the 1st resistance level.
The 1st support level at 1.3317 is a multi-swing low support level, making it a strong level of support. Additionally, there is an overlap support level at 1.3239, which adds further to the potential support that the price may face.
On the resistance side, there is an overlap resistance level at 1.3424, which coincides with a 38.20% Fibonacci retracement and is a strong level of resistance. Furthermore, there is a pullback resistance level at 1.2534, which coincides with a 61.80% Fibonacci retracement and adds to the potential resistance that the price may face.
The potential for a bullish continuation towards the 1st resistance level is seen, given the bullish momentum of the chart.
It is important to note that the current momentum of the chart is bullish, suggesting that further bullish momentum may be expected.
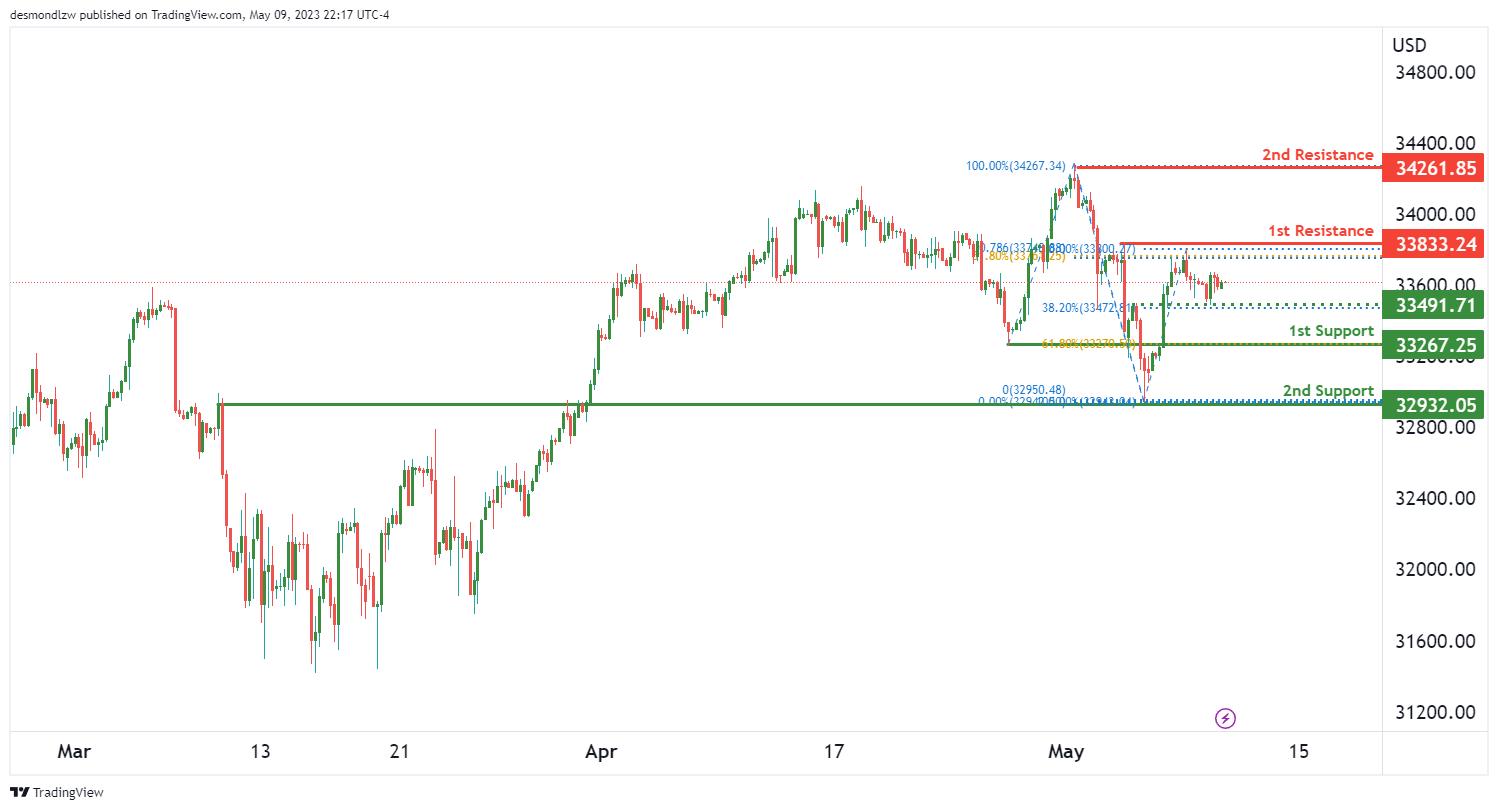
DJ30:
The DJ30 chart is currently showing a neutral momentum overall, with the potential for fluctuations between the 1st resistance and 1st support level.
The 1st support level at 33267.25 is a pullback support level, with a 61.80% Fibonacci retracement, making it a strong level of support. Additionally, there is an overlap support level at 32932.05, which adds further to the potential support that the price may face.
On the resistance side, there is a multi-swing high resistance level at 33833.24, which is a strong level of resistance. Furthermore, there is a swing high resistance level at 34261.85, which adds to the potential resistance that the price may face.
It is important to note that there is an intermediate support level at 33491.71, which coincides with a 38.20% Fibonacci retracement, and may act as a potential support level in case of a fluctuation.
Given the current neutral momentum of the chart, it is likely that the price may fluctuate between the support and resistance levels.
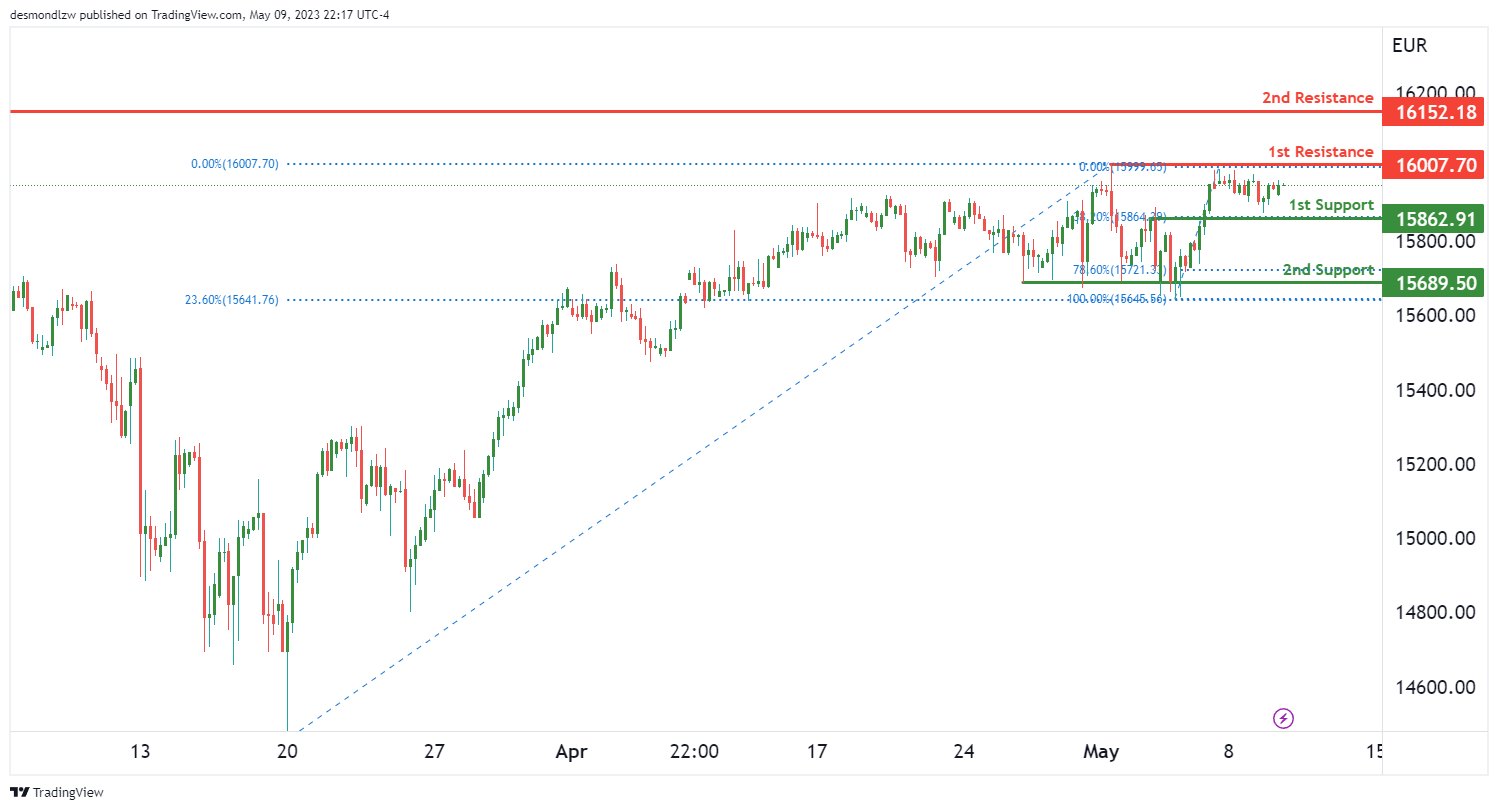
GER30:
The GER30 chart is currently showing a neutral momentum overall, with the potential for fluctuations between the 1st resistance and 1st support level.
The 1st support level at 25862.91 is an overlap support level, coinciding with a 38.20% Fibonacci retracement. This makes it a strong level of support. Additionally, there is a multi-swing low support level at 15689.50, which has a 78.60% Fibonacci retracement and a 23.60% Fibonacci retracement, creating a Fibonacci confluence that further reinforces the level of support.
On the resistance side, there is a multi-swing high resistance level at 26007.70, which is a strong level of resistance. Furthermore, there is a swing high resistance level at 16152.18, which adds to the potential resistance that the price may face.
Given the current neutral momentum of the chart, it is likely that the price may fluctuate between the support and resistance levels.
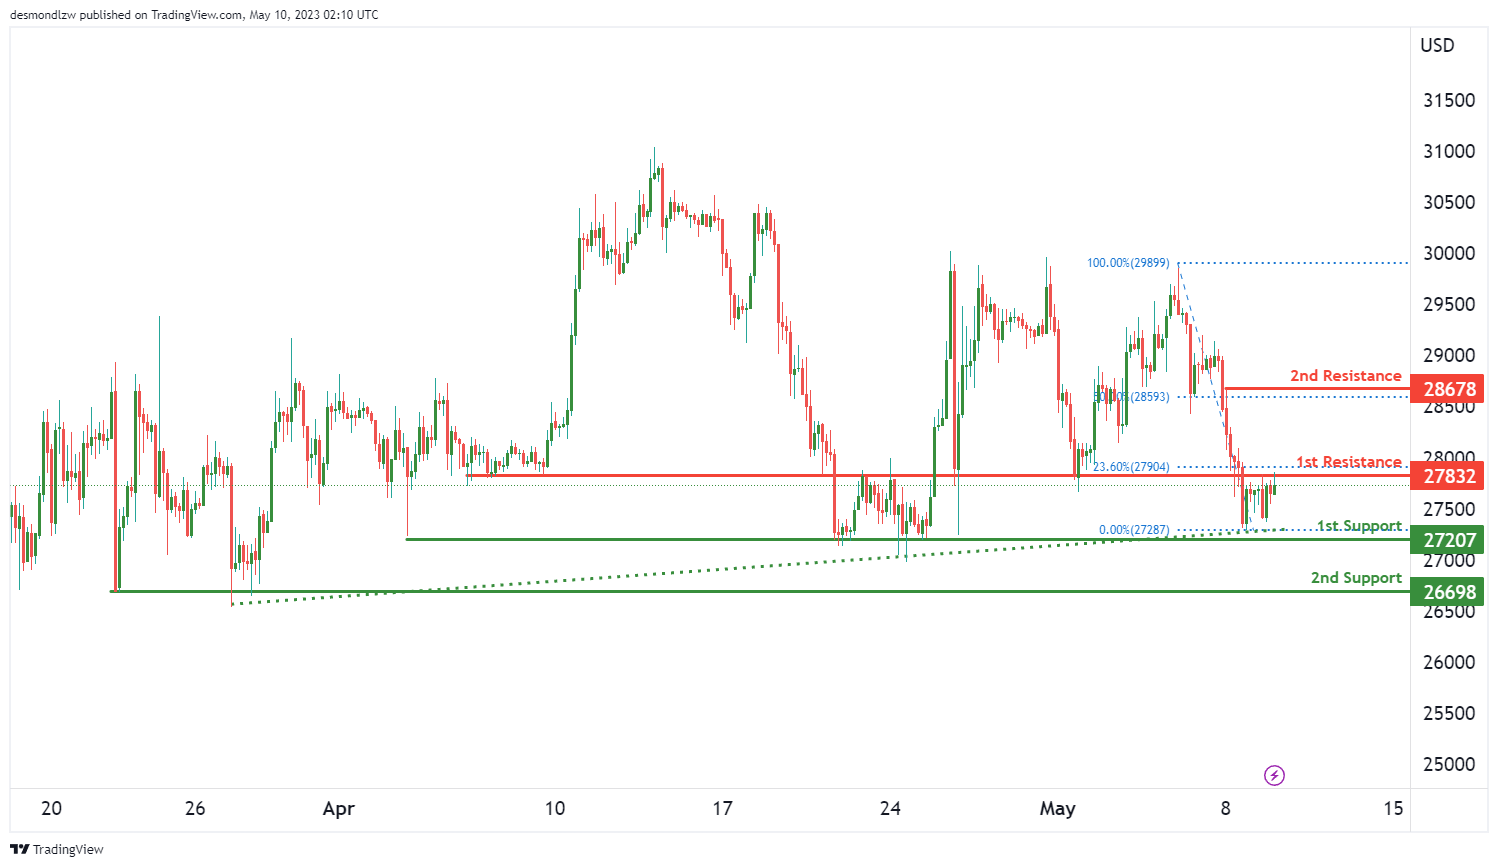
BTC/USD:
The overall momentum of the BTC/USD chart is bullish, with price currently above a major ascending trend line, suggesting that further bullish momentum is on the cards.
In the short term, price could potentially make a bullish break through of the 1st resistance at 27832 and rise to the 2nd resistance at 28678.
However, if price were to drop, the first support level is at 27207, which is a multi-swing low support. If price were to drop below this level, it could move towards the 2nd support at 26698, which is also a multi-swing low support.
It’s worth noting that the 1st resistance level is an overlap resistance and has a 23.60% Fibonacci retracement lining up with it. If price were to break through this level, it could potentially rise towards the 2nd resistance at 28678, which is a swing high resistance and coincides with a 50% Fibonacci retracement.
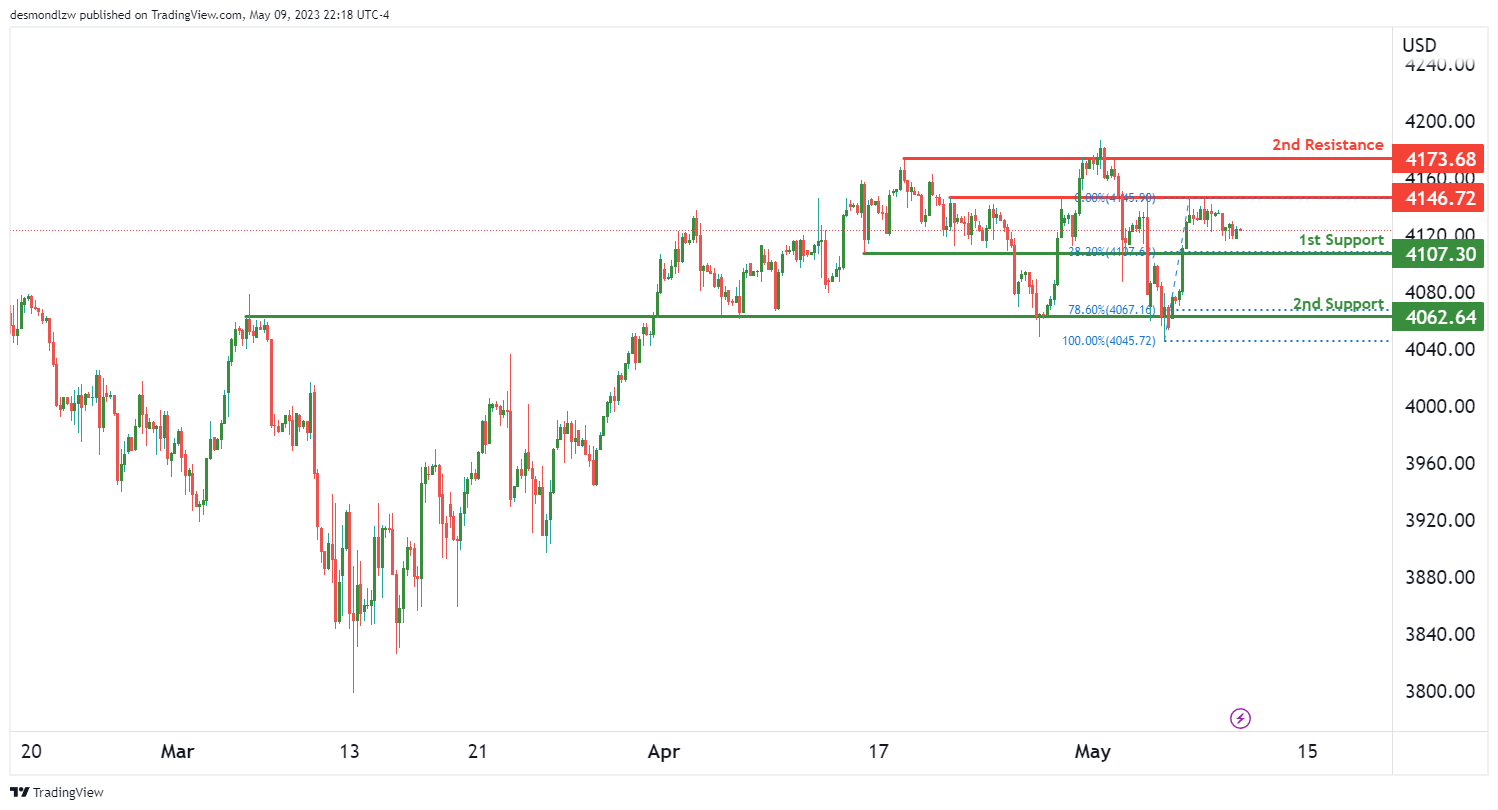
US500
The US500 chart is currently showing bearish momentum, with potential for the price to continue dropping towards the first support level. The chart’s overall trend is bearish, with factors contributing to the momentum being a break below the ascending trend line. The price could potentially make a bearish continuation towards the first support level.
The first support level is at 4107.30 and is a good level for support as it is an overlap support and has a 38.20% Fibonacci retracement lining up with it. The second support level at 4062.64 is another good support level as it is also an overlap support and has a 78.60% Fibonacci retracement lining up with it.
In terms of resistance levels, the first resistance level is at 4146.72 and is a good level for resistance as it is an overlap resistance. The second resistance level at 4173.68 is another good resistance level as it is a multi-swing high resistance.
ETH/USD:
The overall momentum of the ETH/USD chart is currently neutral. However, price could potentially fluctuate between the 1st resistance and 1st support level. This suggests that there may be trading opportunities available in the cryptocurrency market.
The 1st support level is at 1806.14, which is a multi-swing low support. The 2nd support level is at 1764.75, which is another multi-swing low support. These levels could potentially act as good support levels in case the price drops.
On the other hand, the 1st resistance level is at 1872.34, which is an overlap resistance and also marks the 38.20% Fibonacci retracement level. The 2nd resistance level is at 1939.35, which is a multi-swing high resistance and also marks the 61.80% Fibonacci retracement level. These levels could potentially act as good resistance levels in case the price rises.
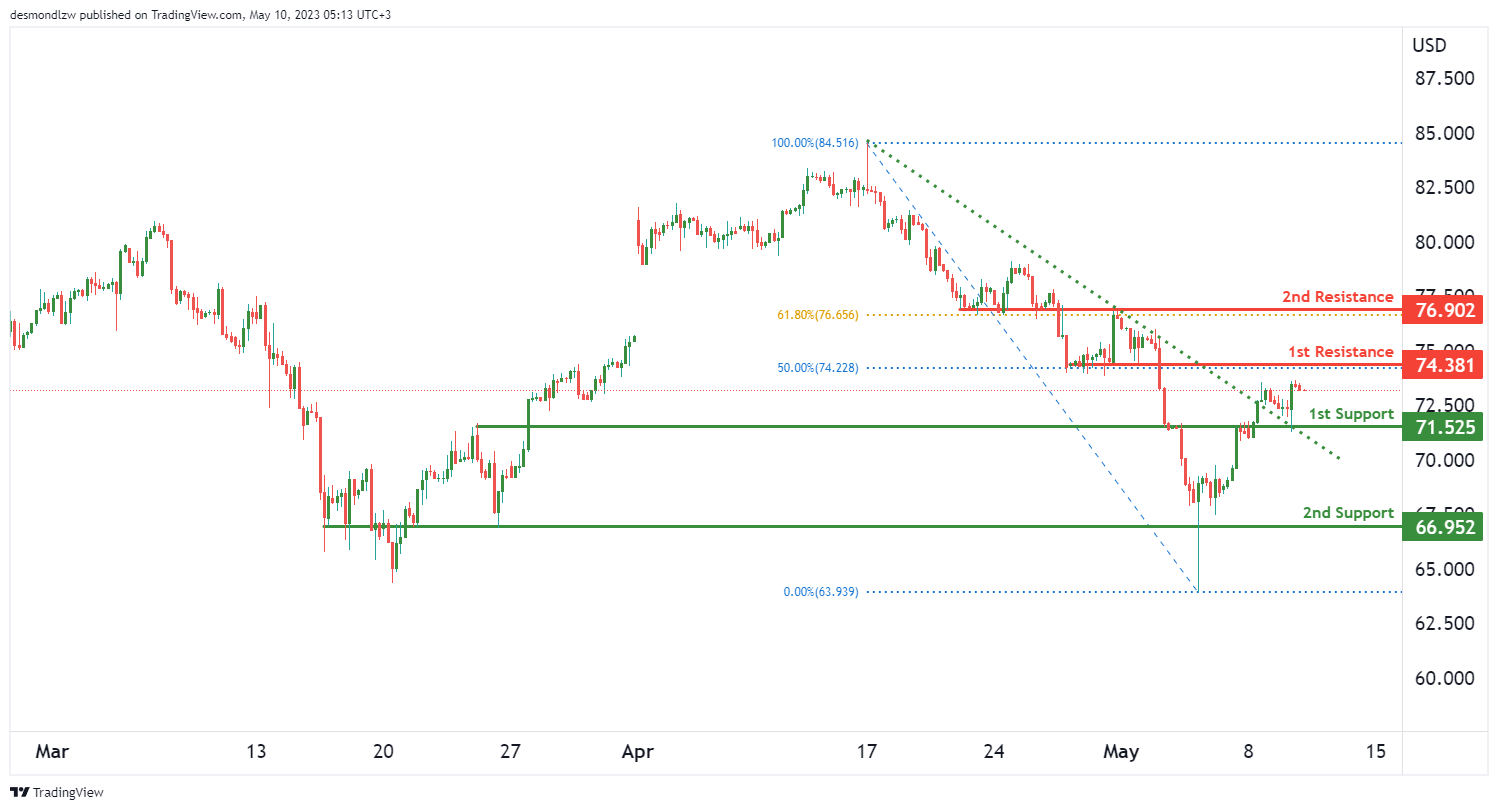
WTI/USD:
The price of WTI crude oil has been showing a bullish momentum on the chart. This is due to the fact that the price has broken above a descending resistance line, which has triggered a potential bullish move. As such, the price could potentially make a bullish continuation towards the 1st resistance level.
The 1st support level for WTI crude oil is at 71.52. This level is a good support because it is an overlap support, indicating that it has acted as both support and resistance in the past. The 2nd support level is also at 71.52 and is another overlap support.
The 1st resistance level is at 74.38. This level is a good resistance because it is a pullback resistance and also coincides with the 50% Fibonacci retracement level. This indicates that there may be selling pressure at this level. The 2nd resistance level is at 76.90 and is also an overlap resistance. It coincides with the 61.80% Fibonacci retracement level, which adds further confluence to this level.
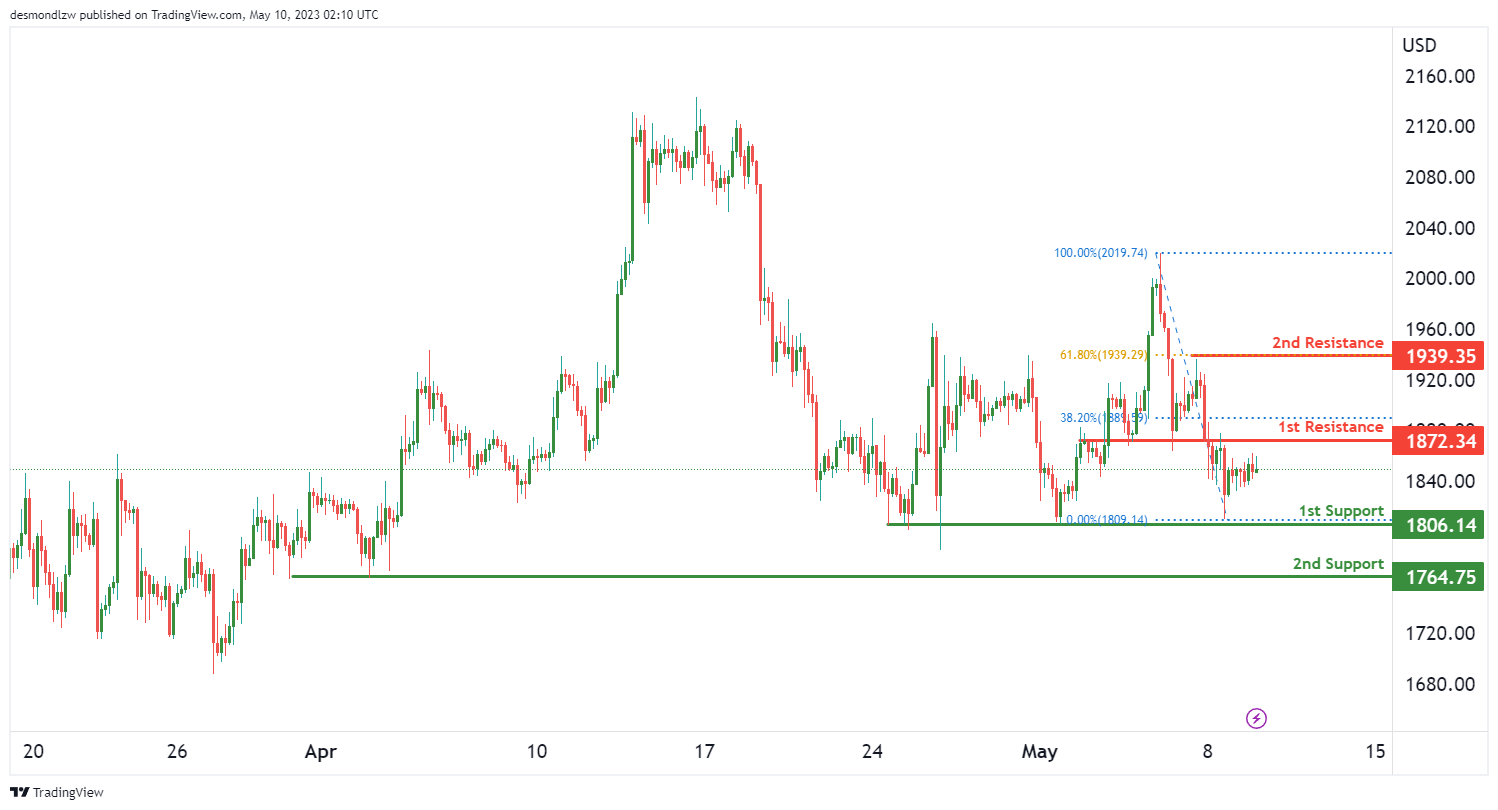
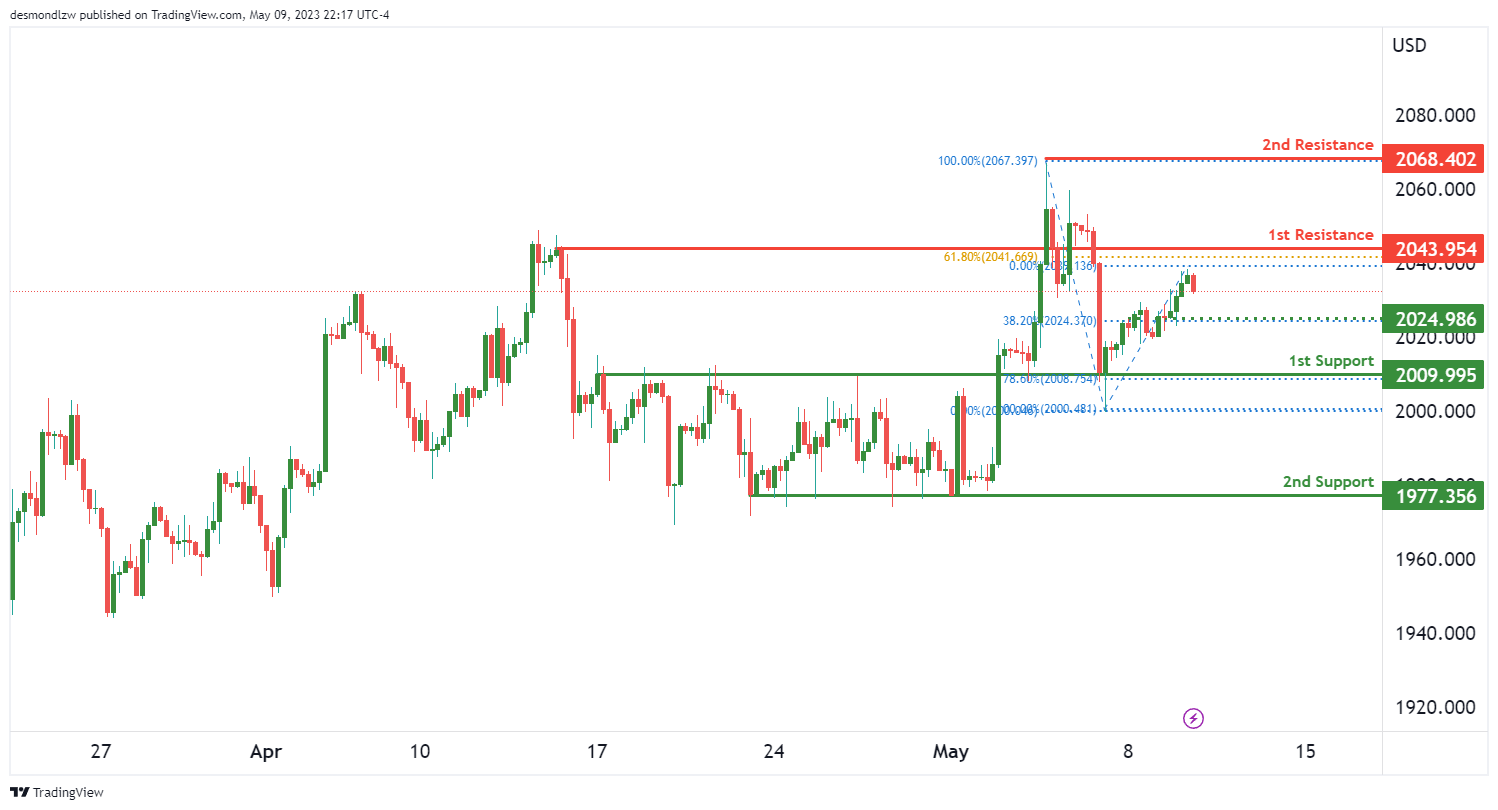
XAU/USD (GOLD):
Gold, represented by XAU/USD, has been in a bearish momentum, indicating that sellers have been in control of the market. The price has the potential to continue dropping towards the first support level.
The first support level is at 2009.99, which is an overlap support level and coincides with the 78.60% Fibonacci retracement level. This level has been tested multiple times in the past and has held as a strong support level.
The second support level is at 1977.35, which is a multi-swing low support level. This level has also been tested multiple times in the past and has held as a strong support level.
On the other hand, the first resistance level is at 2043.95, which is a pullback resistance level and coincides with the 61.80% Fibonacci retracement level. This level has been tested multiple times in the past and has held as a strong resistance level.
The second resistance level is at 2068.40, which is a swing high resistance level. This level has also been tested multiple times in the past and has held as a strong resistance level.
If the price manages to break through the first resistance level, it could potentially rise towards the second resistance level. However, the overall bias remains bearish, and a continuation of the downward trend towards the support levels is more likely.
An intermediate support level at 2024.98, which is an overlap support level coinciding with the 38.20% Fibonacci retracement level, could provide a temporary pause in the downward trend.


