
Gold prices have stabilized at around $2,020 ahead of Tuesday’s trading session, following last Friday’s dip. Recent fluctuations in risk sentiment have been the driving force behind the pricing of the precious metal. How does this look on the charts? Let’s find out.
Treasury yields have increased across the board since the Federal Open Market Committee raised its target rate by 25 basis points to 5-5.25% last week. Similarly, real yields appear to have moved with an inverse correlation to the recent gold price. The gold price has been influenced by Wednesday’s US CPI data for clues on the Fed’s rate path going forward, and the market is anticipating headline inflation of 5.0% year-on-year to the end of April.
US Dollar – H4 Timeframe
The US Dollar based on the price action from the charts is currently consolidating inside a wedge pattern. As we look forward to the CPI figures and the aftermath of the publication, I am confident we should get to see a break out of the wedge pattern – a positive sign for trading opportunities. It is on this note that I will personally be following the price action in hopes of a clear breakout soon. In the meantime, my sentiment is that price will continue to tow its recent bearish path and possibly create a new low on the H4 timeframe.
Analyst’s Expectations:
- Direction: Bearish
- Target: 101.248
- Invalidation: 101.841

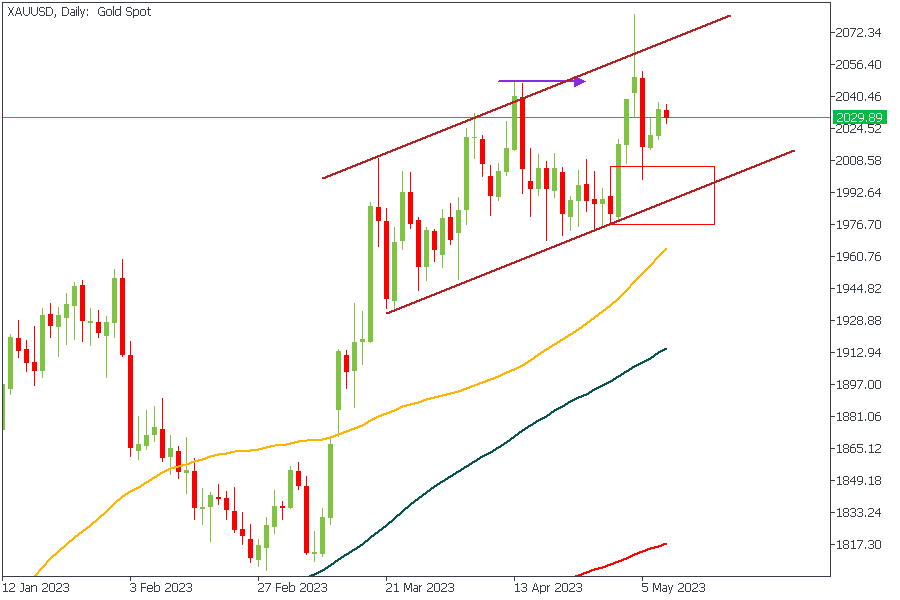
XAUUSD – Daily Timeframe
The daily timeframe on Gold (XAUUSD) is clearly bullish; as we can deduce from the recent break above the high I marked with a horizontal arrow. The rectangle overlapping the trendline support represents a drop-base-rally demand zone to which price has already reacted. Now let’s check the lower timeframe for confirmation.
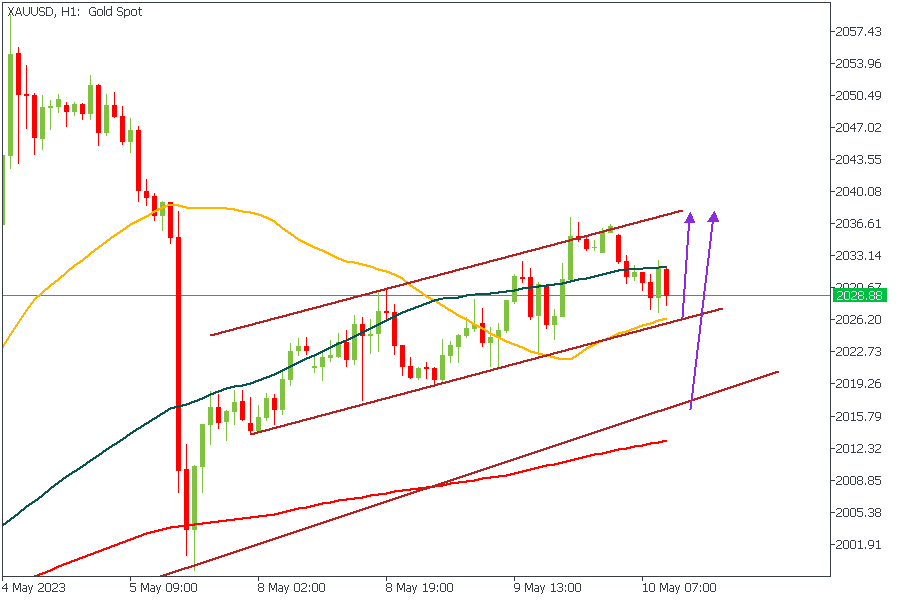
XAUUSD – H1 Timeframe
Now that we’ve confirmed the price action on XAUUSD to be bullish from the daily timeframe, what remains now is to establish the appropriate point of entry on the lower timeframe based on support and resistance levels. Looking at the 1-hour chart, I can see price consolidating to form a rising channel so my entry will be based on either of the two plotted support trendlines. The first one has extra confirmation based on the 50-period moving average, while the other one fits well within the vicinity of the 200-period moving average.
Analyst’s Expectations:
- Direction: Bullish
- Target: $2043.57
- Invalidation: $2014.50
CONCLUSION
The trading of CFDs comes at a risk. Thus, to succeed, you have to manage risks properly. To avoid costly mistakes while you look to trade these opportunities, be sure to do your due diligence and manage your risk appropriately.


 is clearly bullish; as we can deduce from the recent break above the high I marked with a horizontal arrow. The rectangle overlapping the trendline support represents a drop-base-rally demand zone to which price has already reacted. Now let’s check the lower timeframe for confirmation.)