
DXY:
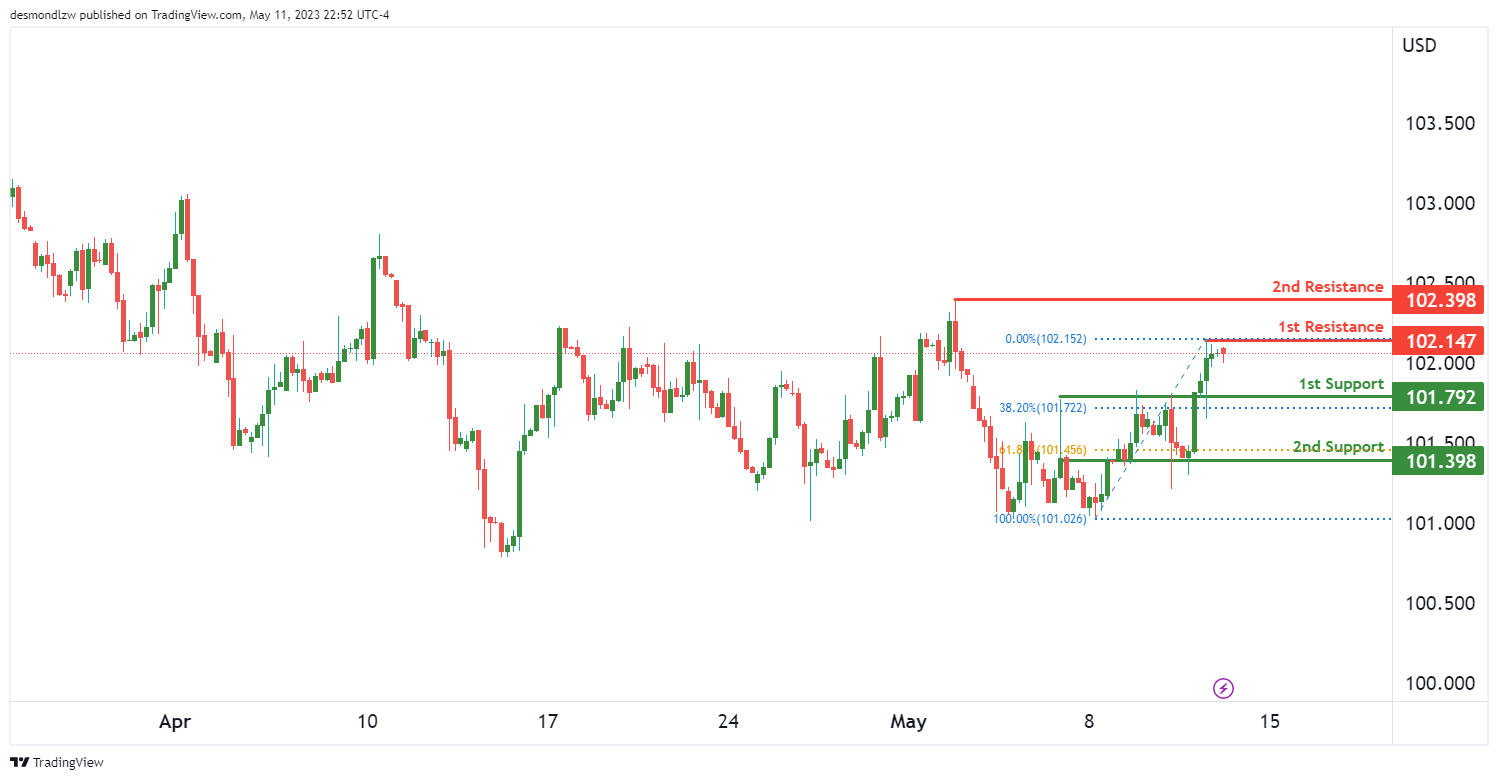
Currently, the DXY is demonstrating a robust bullish momentum. Despite this, there’s a possibility of a further drop to the 1st support in the short term. However, the bullish outlook suggests a potential rebound from this level, pushing the price upwards towards the 1st resistance.
The 1st support is situated at 101.79. This level is characterized as an overlap support, which is a point that has previously functioned as both support and resistance. Furthermore, this level coincides with a 38.20% Fibonacci retracement, providing additional strength to the support.
The 2nd support lies at 101.39. Similar to the 1st support, this level is also an overlap support, but it aligns with a 61.80% Fibonacci retracement. This deeper retracement level could serve as a robust safety net for any potential price pullbacks.
Moving upwards, the 1st resistance is at 102.14. This level has been identified as a multi-swing high resistance, suggesting that it has consistently capped price advances in the past. If the price rebounds from the 1st support and gains momentum, it could rise to meet this resistance level.
The 2nd resistance is found at 102.39. This level is known as a swing high resistance, marking a high point in a price swing. If the bullish momentum persists and the price breaches the 1st resistance, it could potentially aim for the 2nd resistance.
EUR/USD:
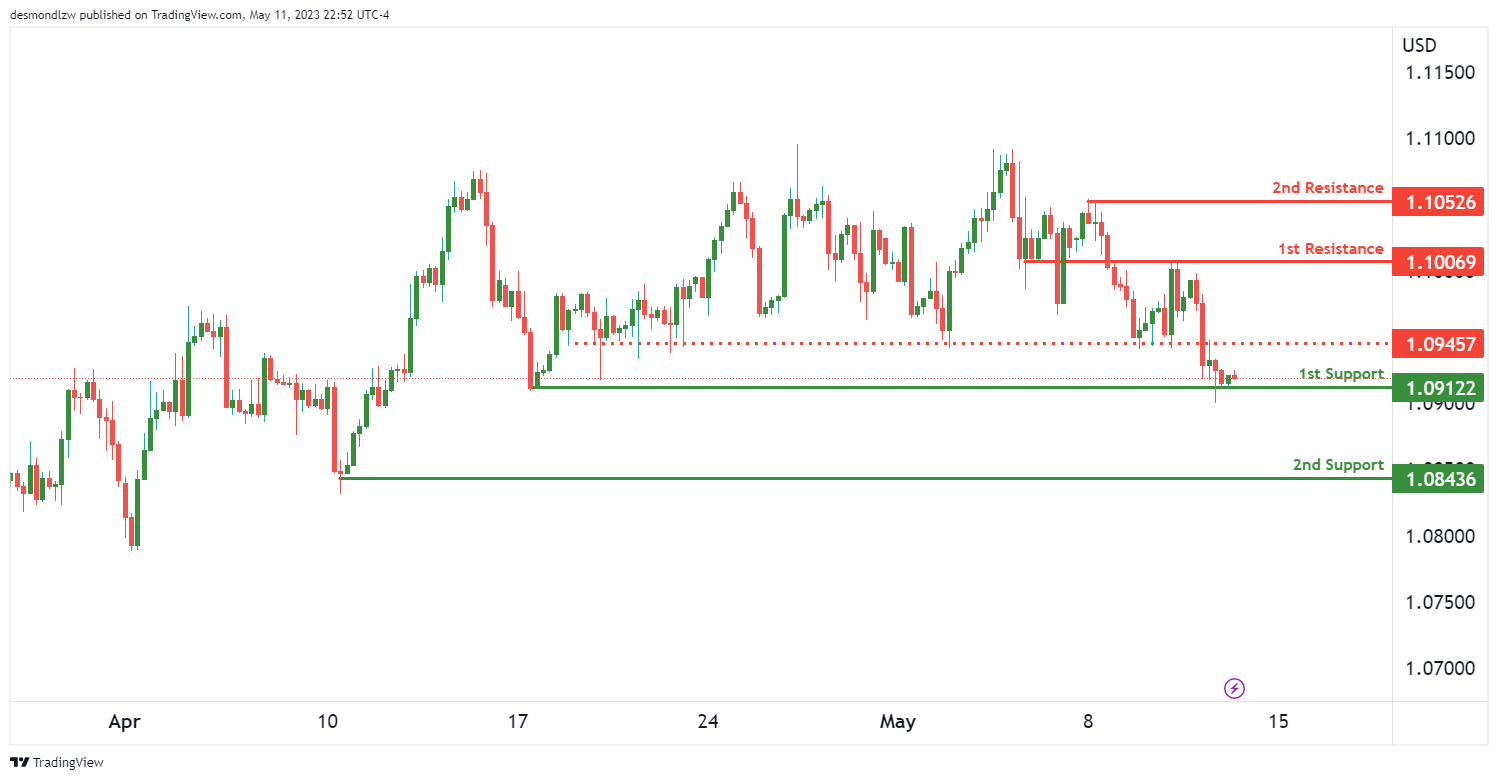
In the current situation, EUR/USD is demonstrating a bearish momentum, with the potential for a bearish break off the 1st support and a drop towards the 2nd support.
The 1st support level is found at 1.0912, which is of significance due to its multi-swing low support. This level has demonstrated its reliability over multiple trading sessions, with the price bouncing back from this point on numerous occasions. If the price were to break this first support, it could drop towards the 2nd support level.
The 2nd support is located at 1.0843. This level is known as a swing low support, which means it has previously served as a low point in the price swing. This makes it a critical level that could potentially halt further price drops, leading to a price rebound.
The 1st resistance level is at 1.1006. This level acts as an overlap resistance, which has previously served as both support and resistance. It is a critical level that could potentially halt a bullish price move and reverse the trend.
In between the current price and our 1st resistance is an intermediate resistance at 1.0945. This level is also an overlap resistance and could potentially halt a bullish price move. A break of this intermediate resistance could trigger a bearish acceleration towards our 1st resistance.
The 2nd resistance is situated at 1.1052. This level acts as a multi-swing high resistance, indicating that it has halted the price rise on multiple occasions in the past. If price were to break the 1st resistance, it could potentially rise towards the 2nd resistance. However, given the overall bearish momentum, this scenario might be less likely.
GBP/USD:
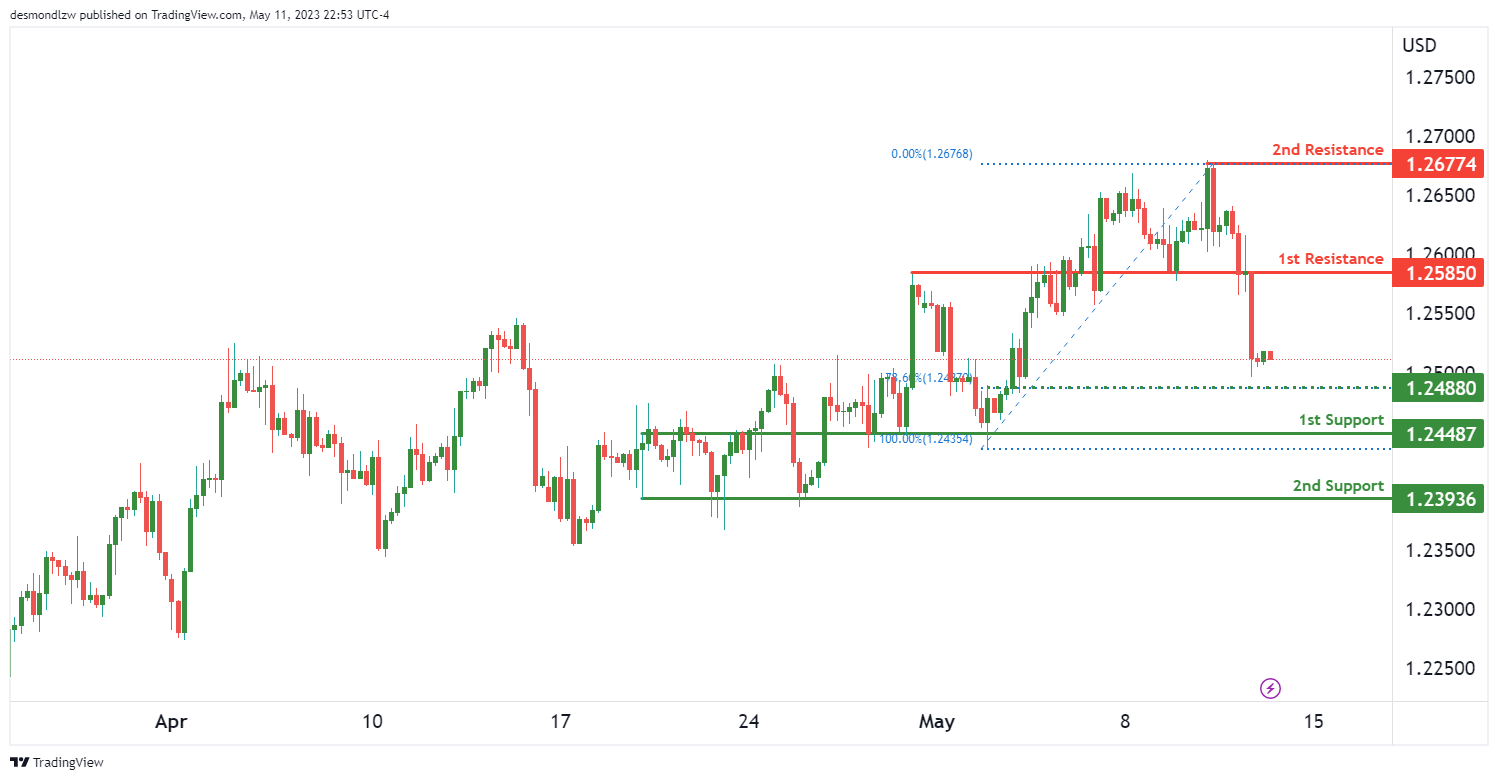
The GBP/USD is currently exhibiting a bearish momentum. The expectation is for a bearish continuation towards the 1st support.
The 1st support is located at 1.2448. This level is significant as it is an overlap support, which means it has previously acted as both a support and a resistance level. This makes it a critical level that could potentially halt further price drops, leading to a price rebound.
The 2nd support is situated at 1.2393. This level is notable for being a multi-swing low support, indicating that it has halted the price fall on multiple occasions in the past. If the price breaches the first support, it could drop towards this level.
The 1st resistance level is at 1.2585. This level is an overlap resistance, which has served as both a support and resistance point in the past. If the bearish trend reverses and the price begins to rise, this level could act as the first significant barrier to upward movement.
The 2nd resistance level is at 1.2677. This level is a swing high resistance, indicating that it has previously served as a high point in the price swing. If the price breaks through the 1st resistance, it could potentially rise towards the 2nd resistance.
In between the current price and our 1st support is an intermediate support at 1.2488. This level is also an overlap support and coincides with a 78.60% Fibonacci retracement. A break of this intermediate support could trigger a strong bearish acceleration towards our 1st support.
USD/CHF:
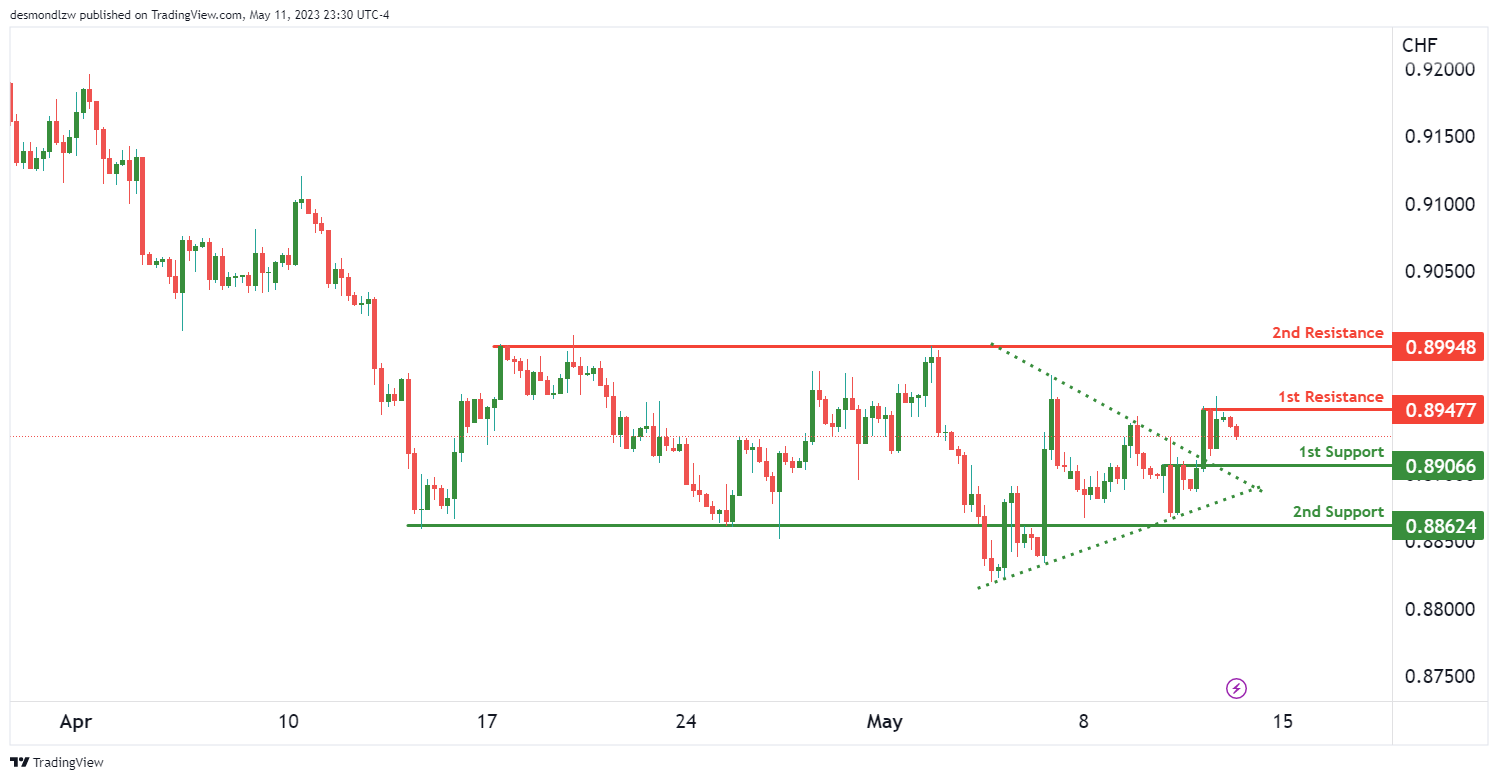
The USD/CHF is currently displaying strong bullish momentum. However, in the short term, the price could potentially drop further towards the 1st support before rebounding and rising to the 1st resistance.
The 1st support is positioned at 0.8906. This level is considered a pullback support, which signifies that it is a potential rebound point for the price following a temporary retreat from a recent upward trend.
The 2nd support is located at 0.8862. It is an overlap support, meaning it has previously acted as both a support and resistance level. If the price breaks through the first support, it could potentially drop to this level before a possible rebound.
The 1st resistance level lies at 0.8947. This level is defined as a multi-swing high resistance, indicating it has capped price advances multiple times in the past. If the price rebounds from the 1st support and gains momentum, it could rise to meet this 1st resistance.
The 2nd resistance level is situated at 0.8994. This level, similar to the 1st resistance, is a multi-swing high resistance. If the bullish momentum continues and the price breaches the 1st resistance, it could potentially aim for the 2nd resistance.
Moreover, it is worth noting that the price has broken above a symmetrical triangle chart pattern. A break above the upper trendline of the pattern could signal a bullish breakout.
USD/JPY:
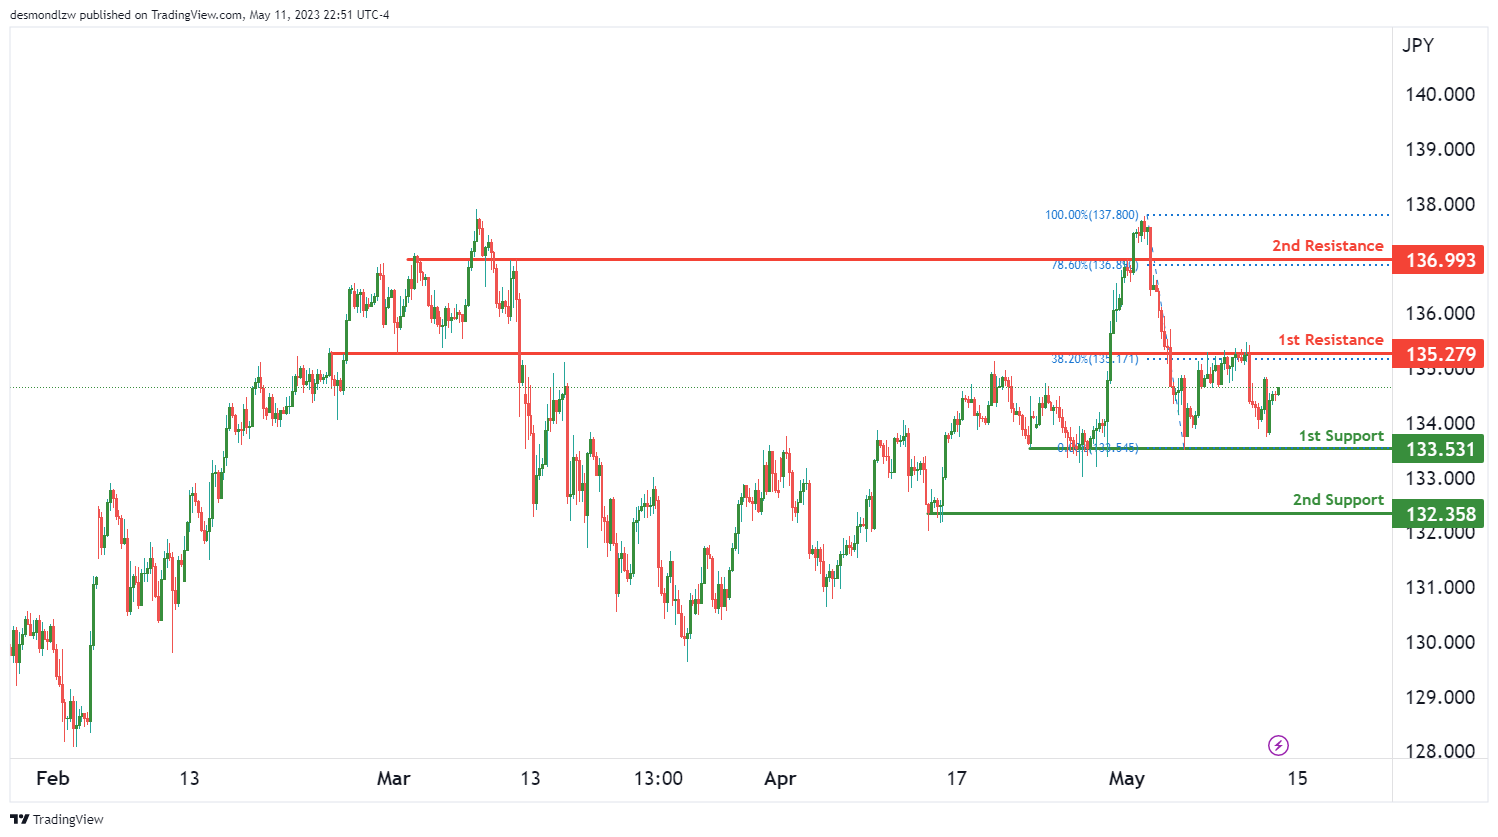
The USD/JPY is presently experiencing a bullish momentum. The price could potentially continue this trend towards the 1st resistance.
The 1st support level is found at 133.53. This level is identified as a multi-swing low support, suggesting that it has repeatedly halted price declines in the past. This level could serve as a significant barrier to further price drops and could potentially trigger a price rebound.
The 2nd support level is located at 132.35. Much like the first, it is also a multi-swing low support. If the price breaks through the 1st support, it could potentially descend to this level before a possible rebound.
Moving upwards, the 1st resistance level is at 135.27. This is an overlap resistance level, meaning it has previously acted as both support and resistance. Moreover, it coincides with a 38.20% Fibonacci retracement, adding to the strength of this resistance. If the price rebounds from the support and gains momentum, it might rise to meet this resistance level.
The 2nd resistance level is situated at 136.99. This level is also an overlap resistance but aligns with a deeper, 78.60% Fibonacci retracement. If the bullish momentum persists and the price breaches the 1st resistance, it could aim for this 2nd resistance.
AUD/USD:
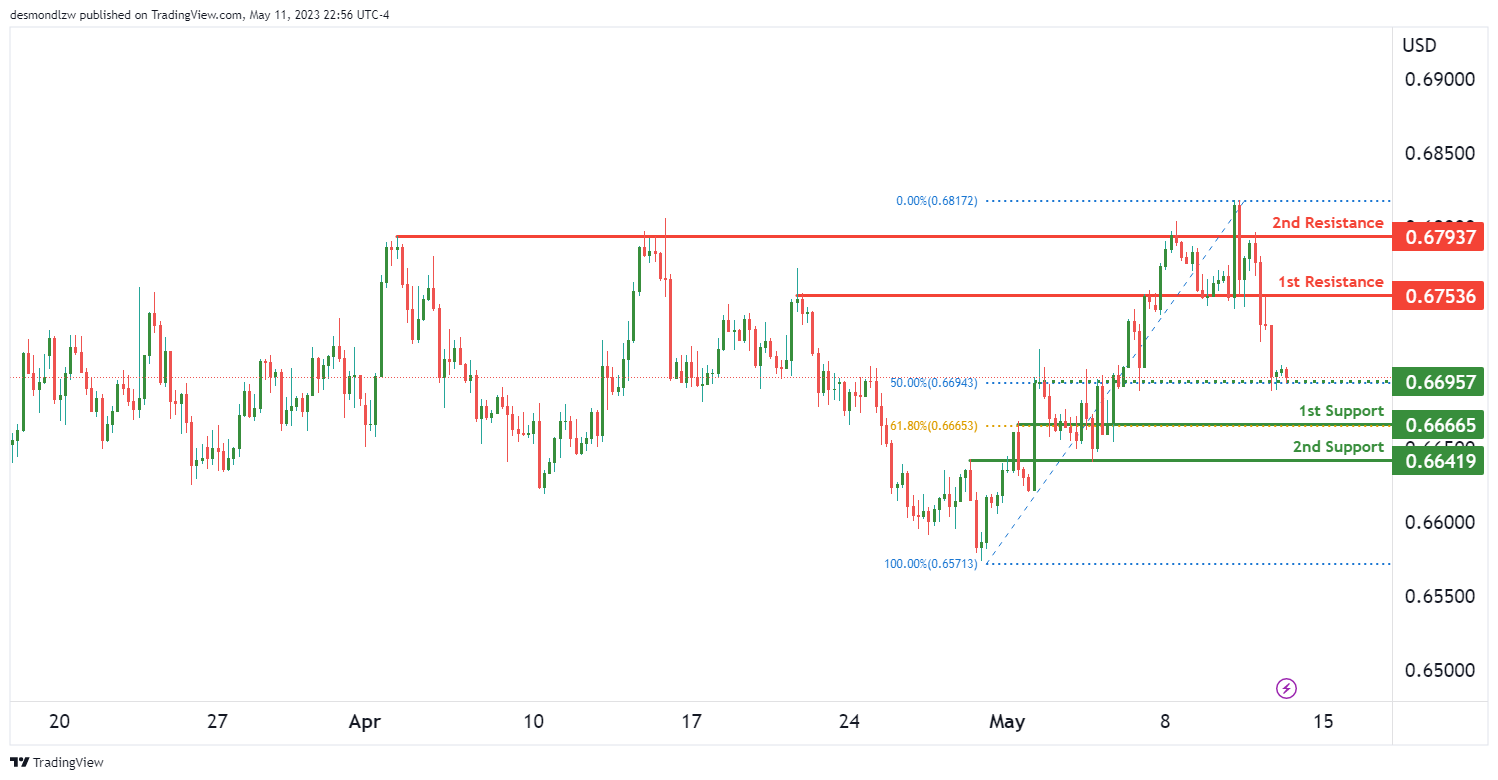
The AUD/USD is currently demonstrating a bearish momentum. The price could potentially continue this downward trend towards the 1st support.
The 1st support level is situated at 0.6666. This is a pullback support, which means it might be a potential point of price rebound following a temporary retreat from a recent upward trend. Furthermore, this support level coincides with a 61.80% Fibonacci retracement, which often serves as a crucial level in market retracements.
The 2nd support level lies at 0.6641. This level is an overlap support, indicating that it has previously served as both a support and resistance level. If the price breaks through the first support, it could potentially descend to this level before a possible rebound.
The 1st resistance level is located at 0.6753. This is an overlap resistance, meaning it has previously acted as both support and resistance. If the price reverses its current bearish momentum and begins to rise, it could potentially reach this resistance level.
The 2nd resistance level is positioned at 0.6793. This level, much like the first, is an overlap resistance. If a bullish reversal occurs and the price surpasses the 1st resistance, it could aim for this 2nd resistance.
Moreover, there is an intermediate support level at 0.6695. This level, which is an overlap support, coincides with a 50% Fibonacci retracement, further strengthening its significance.
NZD/USD
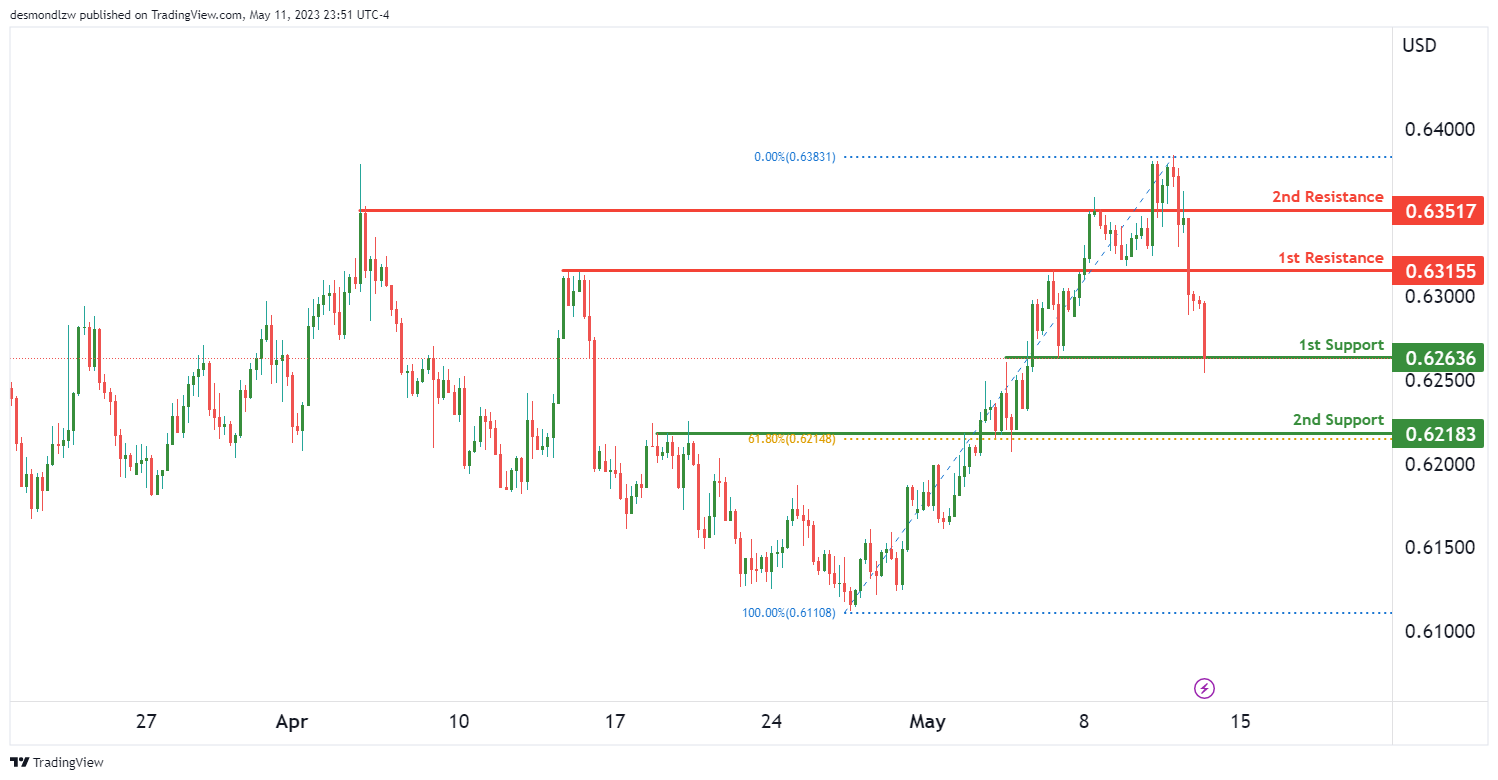
Currently, the NZD/USD is exhibiting a bearish momentum. The price may continue this downward trend, possibly moving towards the 1st support.
The 1st support level is located at 0.6263. It is an overlap support, indicating that it has previously acted as both a support and resistance level. This level may serve as a significant barrier against further price declines, potentially causing the price to bounce.
The 2nd support level is at 0.6218. This level, too, is an overlap support, but it aligns with a deeper 61.80% Fibonacci retracement, adding to its potential strength. If the price breaches the 1st support, it could continue its descent to this level before a possible rebound.
The 1st resistance level is set at 0.6315. It is a pullback resistance, meaning it could be a point where the price reverses its current downward trend. If the price were to rebound and start to rise, it might meet this resistance.
The 2nd resistance level is at 0.6351. This level is an overlap resistance, suggesting that it has previously served as both support and resistance. If the price breaks through the 1st resistance, it could potentially ascend towards this level.
USD/CAD:
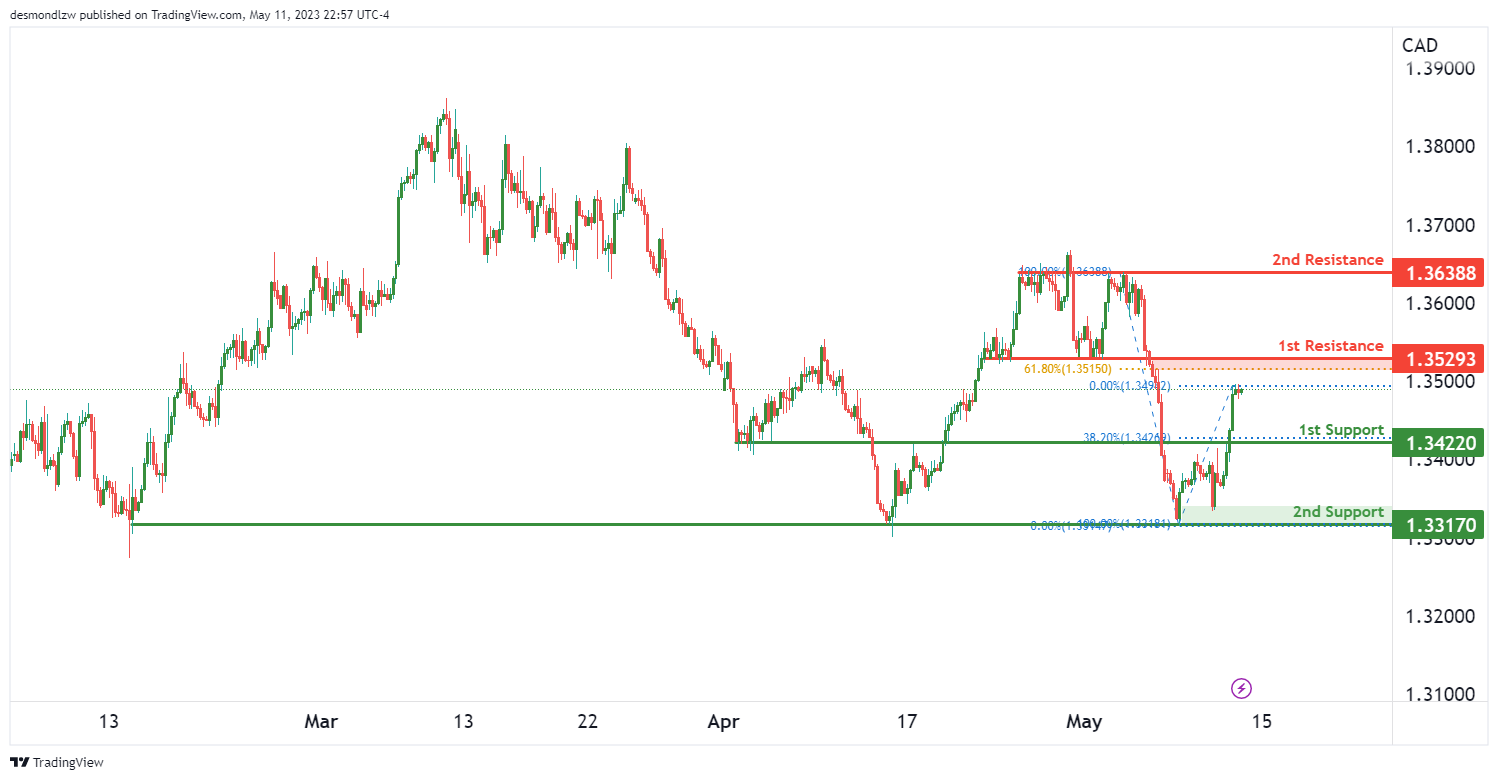
Currently, the USD/CAD is presenting a bullish momentum. The price could potentially continue this upward trajectory towards the 1st resistance.
The 1st support level is situated at 1.3422. This level serves as a pullback support, which could be an area where the price may bounce after a short-term retreat from its current upward momentum. This support aligns with a 38.20% Fibonacci retracement, further enhancing its potential strength.
The 2nd support level is set at 1.3317. It serves as a multi-swing low support, indicating that it has been a point of rebound for the price multiple times in the past. If the price falls below the 1st support, it could potentially descend to this level before experiencing a potential rebound.
The 1st resistance level is located at 1.3529. This pullback resistance could potentially be a level where the price may face resistance in its current upward movement. It coincides with a 61.80% Fibonacci retracement, which often acts as a significant barrier in a bullish market.
The 2nd resistance level is at 1.3638. This level is an overlap resistance, suggesting that it has previously acted as both support and resistance. If the price breaks through the 1st resistance, it could aim to reach this 2nd resistance.
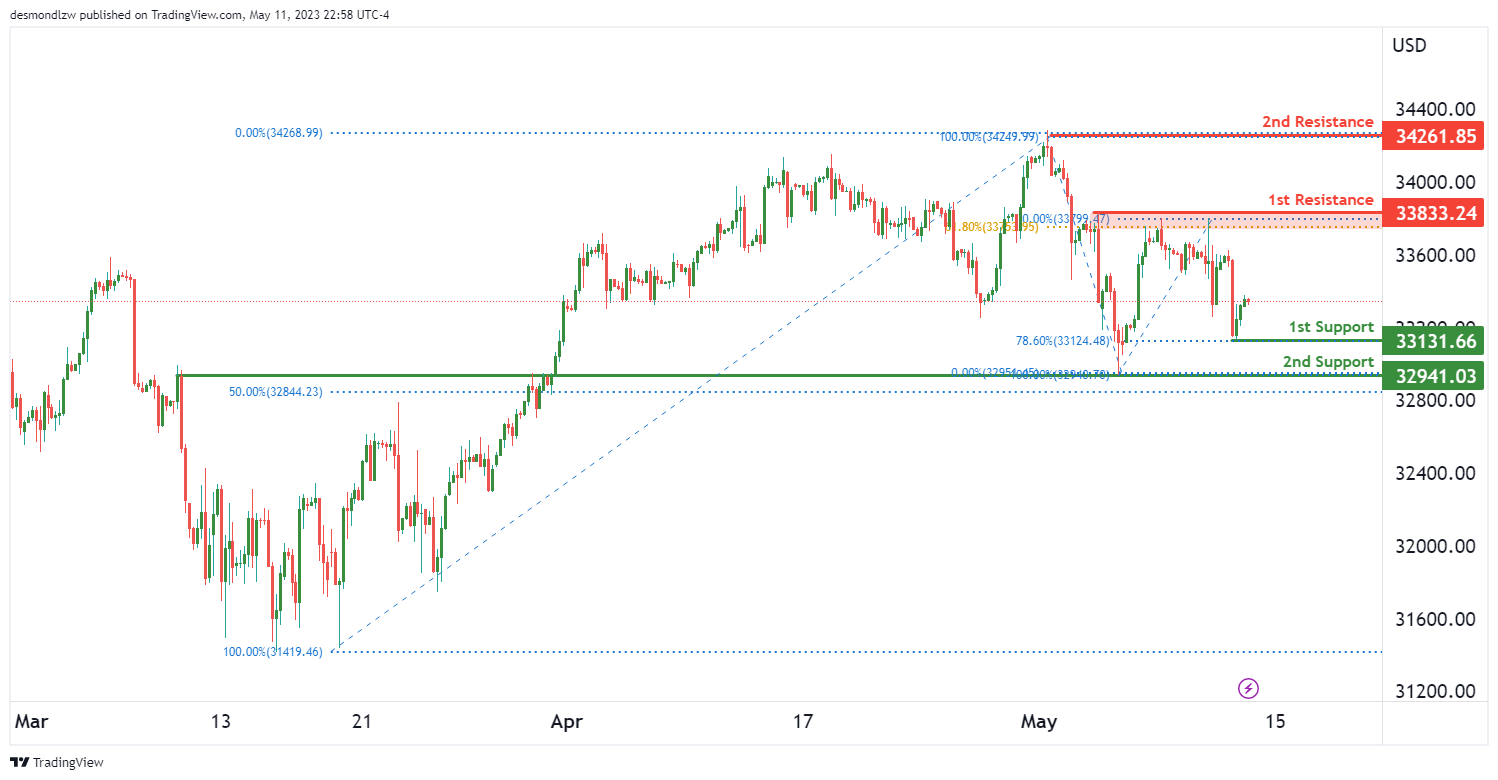
DJ30:
the Dow Jones Industrial Average (DJ30) is displaying a bullish momentum. The price could potentially continue its upward movement towards the 1st resistance.
The 1st support level is located at 33131.66. This level serves as a pullback support and is a potential area where the price may bounce after a short-term decrease from its current upward momentum. This support aligns with a 78.60% Fibonacci retracement, further strengthening its potential robustness.
The 2nd support level is set at 32941.03. This level acts as an overlap support, indicating that it has previously served as both a resistance and support level. Moreover, it coincides with a 50% Fibonacci retracement, which could reinforce this level’s significance. If the price retreats below the 1st support, it could potentially descend to this level before making a potential rebound.
The 1st resistance level is situated at 33833.24. This level is a multi-swing high resistance and could potentially be a point where the price may face resistance in its current upward movement. It coincides with a 61.80% Fibonacci retracement, adding to its significance as a potential barrier in the market.
The 2nd resistance level is at 34261.85. This level is a multi-swing high resistance, suggesting that it has been a point of reversal for the price multiple times in the past. If the price breaks through the 1st resistance, it could strive to reach this 2nd resistance.
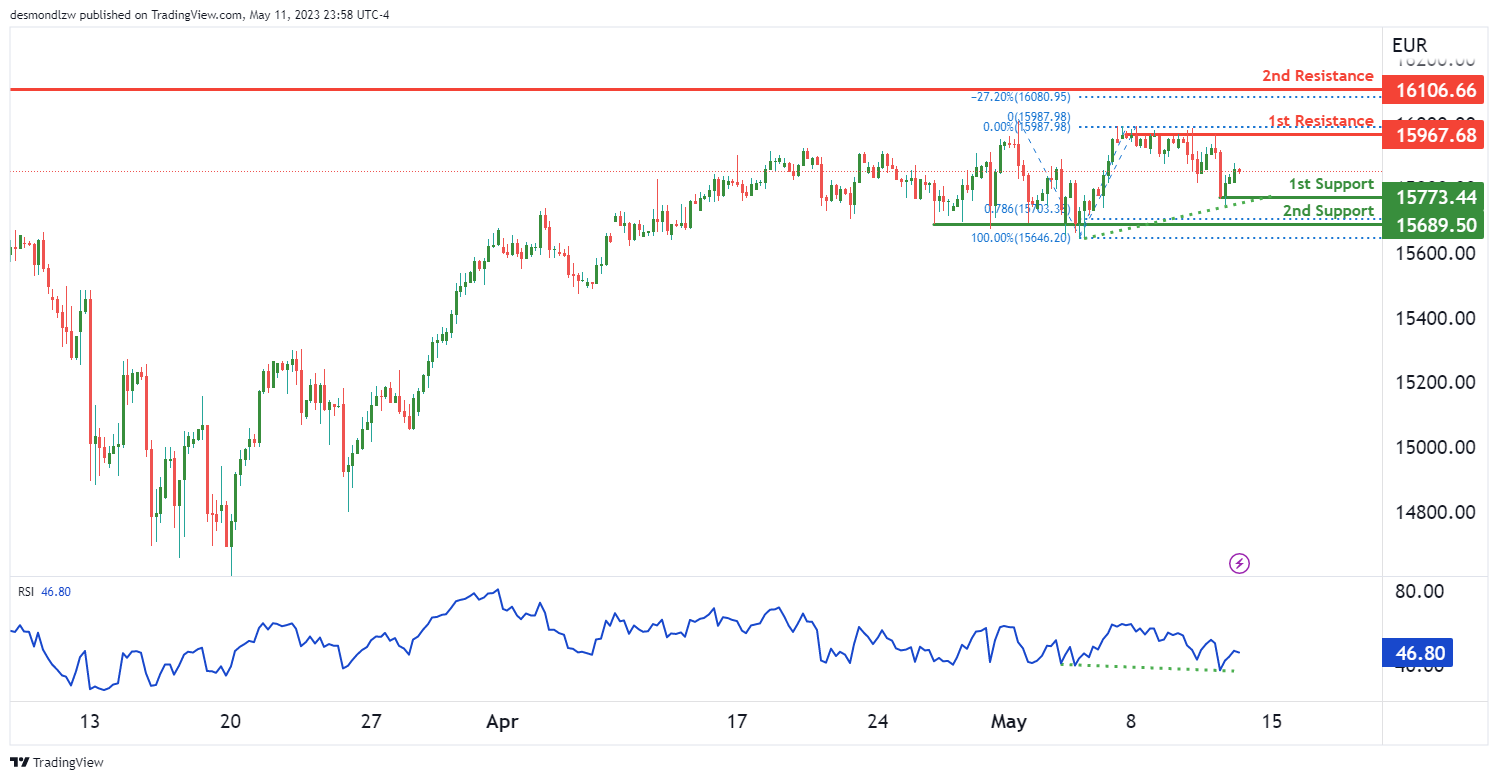
GER30:
The German Stock Index, also known as the GER30 or DAX30, currently shows bullish momentum in the chart. This suggests that we could potentially see a continuation of this upward trend, with the price aiming to reach the 1st resistance level.
The 1st support level is at 15773.44. This level is significant due to it being a swing low support, a point where the price has previously reversed direction from decreasing to increasing.
The 2nd support level is at 15689.50. It is a multi-swing low support, indicating that it has been a point of price reversal multiple times in the past. Additionally, this level aligns with a 78.60% Fibonacci projection, which strengthens its potential robustness as a support level.
Moving to resistance, the 1st resistance level is located at 15967.68. This is a multi-swing high resistance, suggesting it has previously been a point of reversal for the price. If the bullish trend continues, we may see the price aim for this level.
The 2nd resistance level, at 16106.66, is another significant level to monitor. It represents a swing high resistance and coincides with a -27% Fibonacci expansion, further highlighting its potential as a critical resistance point.
It is also worth noting that the Relative Strength Index (RSI), a momentum oscillator, is displaying hidden bullish divergence versus the price. This situation usually suggests a possible trend reversal or a strengthening of the current trend. In this case, with the existing bullish momentum, it suggests a likely rapid incline in price.
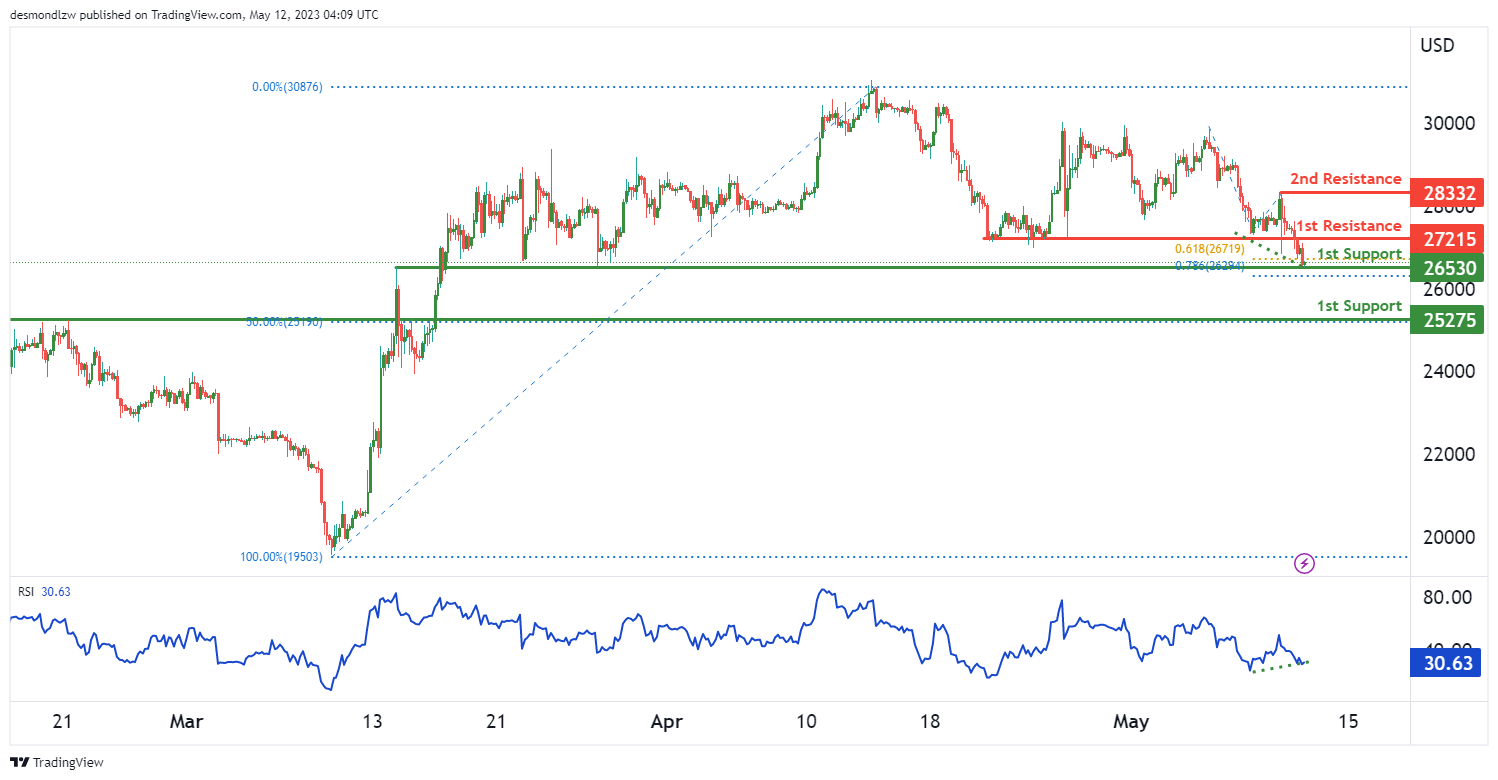
BTC/USD:
The Bitcoin to US Dollar (BTC/USD) pair currently demonstrates a bullish momentum on its chart, potentially heading for a continuation towards its 1st resistance level.
The 1st support level is stationed at 26530. It is seen as a significant point, acting as an overlap support. This level has historically served as both support and resistance, which gives it its importance.
The 2nd support level, a pullback support, is marked at 25275. A pullback support is a level where we might expect the price to ‘retrace’ during a downtrend before potentially resuming its overall bullish trend.
On the flip side, if the bullish momentum maintains its course, the 1st resistance level at 27215 could be the next target. This level acts as an overlap resistance, indicating that it has been a turning point where the price has previously switched from a rising to a falling trend.
The 2nd resistance level is set at 28332, identified as a swing high resistance. This point is where the price has previously reached a peak before reversing to a downtrend.
Another essential factor to consider is the Relative Strength Index (RSI), which is currently displaying bullish divergence versus the price. This divergence suggests that there could be a rapid incline in price in the near future.
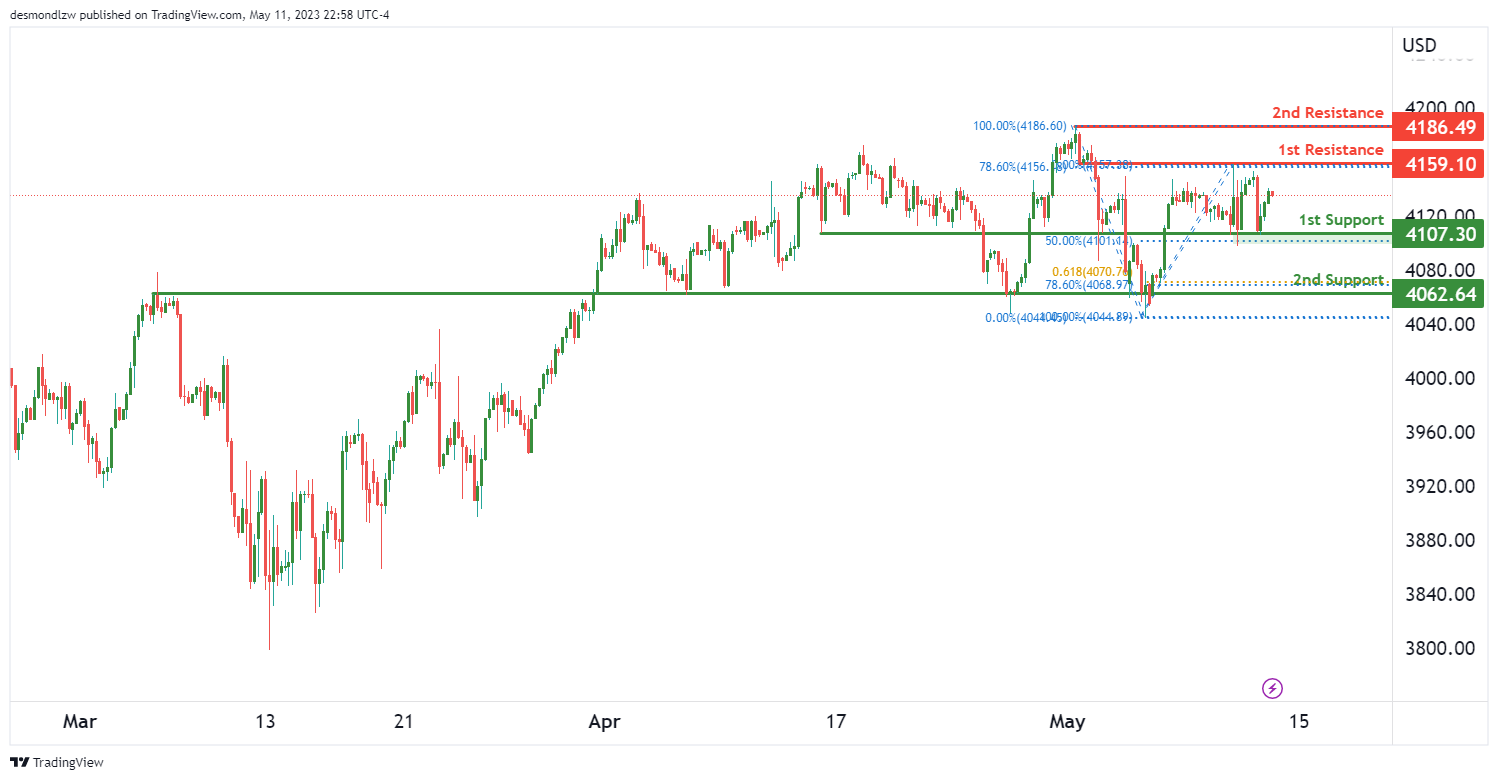
US500
The US500, also known as the S&P 500 Index, is currently showcasing a bullish momentum in its chart dynamics. The momentum indicates the potential for a bullish continuation towards the first resistance level.
The first support level is pinpointed at 4107.30. This level, identified as an overlap support, is also reinforced by its alignment with the 50% Fibonacci retracement level. The Fibonacci retracement is a popular tool among traders to predict potential areas of support and resistance. This overlap support is historically significant as it has seen the price bouncing back on previous occasions.
The second support level is situated at 4062.64, another crucial overlap support. This level further aligns with both the 78.60% Fibonacci retracement and the 61.80% Fibonacci projection, increasing its significance. These Fibonacci levels suggest that this support level might be a strong area for potential price rebounds.
Looking upward, if the bullish momentum persists, we could witness the price reaching towards the first resistance level at 4159.10. This level, identified as an overlap resistance, also aligns with the 78.60% Fibonacci retracement, making it a substantial level to overcome for the continuation of the bullish trend.
The second resistance level is observed at 4186.49, recognized as a swing high resistance. This level is important as it has historically acted as a ceiling for the price, where the price reversed its uptrend.
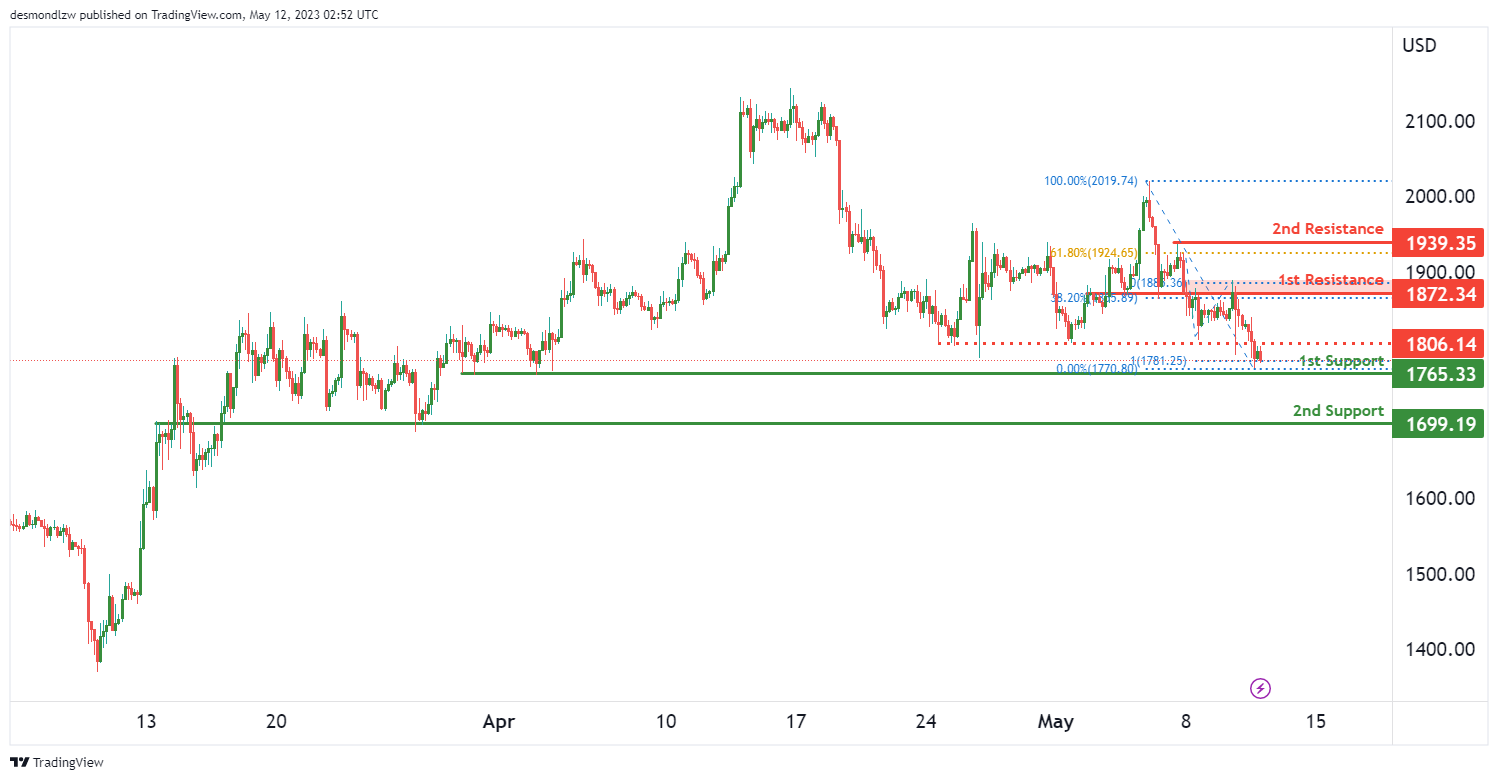
ETH/USD:
The Ethereum is currently showing bullish momentum. However, in the short term, the price could potentially drop further to the first support level before bouncing back and rising towards the first resistance level.
The first support level is identified at 1765.33. This level, designated as a multi-swing low support, is also noteworthy because of its alignment with the 100% Fibonacci projection level. This coincidence can potentially make it a strong area for price bounce-back.
The second support level is situated at 1688.19. This overlap support is also significant, as the price has previously bounced back from this level on multiple occasions.
If the price recovers from these support levels and the bullish momentum continues, the first resistance level to look out for is at 1872.34. This level, identified as an overlap resistance, also aligns with the 38.20% Fibonacci retracement level, suggesting it could be a substantial obstacle for the price to overcome.
The second resistance level is observed at 1939.35, which is recognized as a swing high resistance. It also coincides with the 61.80% Fibonacci retracement level, further reinforcing its significance as a potential hurdle for the upward price momentum.
There is also an intermediate resistance level at 1806.14, which is considered an overlap resistance. This could be another area where the price may face some resistance during its upward trajectory.
WTI/USD:
The WTI (West Texas Intermediate) crude oil market is currently showing a bearish momentum. However, in the short term, the price could potentially rise towards the first resistance level before reversing and dropping towards the first support level.
The first support level is situated at 69.79. This level, identified as a pullback support, also aligns with the 38.20% Fibonacci retracement level. This suggests it could be a significant area for price bounce-back if the downward trend continues.
The second support level is observed at 67.49. This multi-swing low support coincides with the 61.80% Fibonacci retracement level, potentially reinforcing its strength as a support level.
If the price manages a short-term rise, the first resistance level to look out for is at 71.66. This level, identified as an overlap resistance, could be a considerable obstacle for the price to overcome before it continues its downward momentum.
The second resistance level is found at 73.96, which is also an overlap resistance. It aligns with the 50% Fibonacci retracement level, further underlining its potential as a significant hurdle for the price.
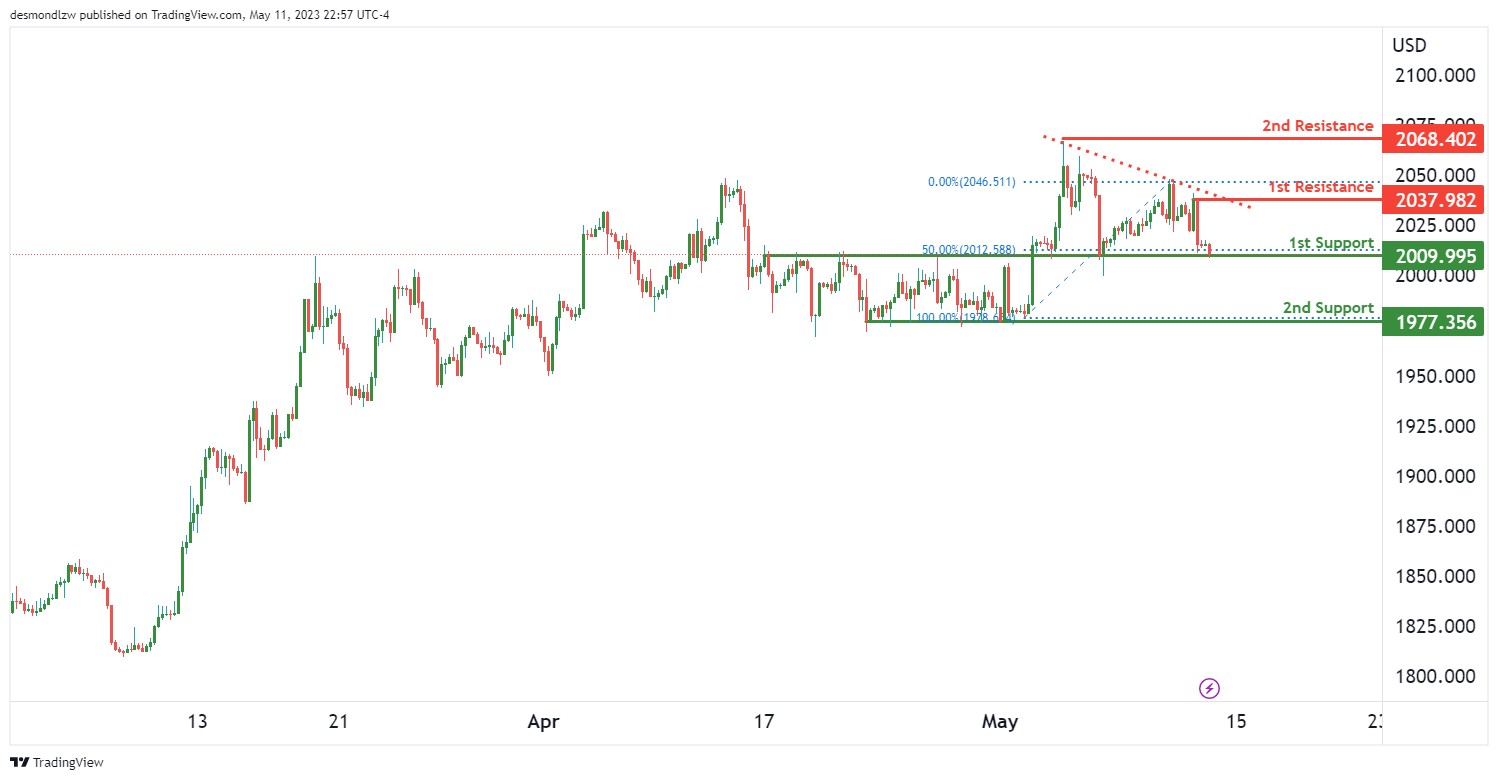
XAU/USD (GOLD):
The XAU/USD pair (Gold against the US Dollar) currently shows a bearish momentum. A significant factor contributing to this momentum is that the price is below a major descending trend line, suggesting a potential continuation of the bearish trend.
In the short-term, the price could potentially make a bearish break off the first support level and drop towards the second support level.
The first support level is at 2009.99, identified as an overlap support. This level also coincides with the 50% Fibonacci retracement level, suggesting it could be a significant area for a potential price bounce-back if the downward trend continues.
The second support level is at 1977.35, characterized as a multi-swing low support. This could serve as a strong foundation for price reversal, given its historical significance.
On the upside, the first resistance level is at 2037.98, identified as a swing high resistance. This level could pose a significant barrier for price advancements.
The second resistance level is at 2068.40, also a swing high resistance. This level may further obstruct price movements upwards, given its historical relevance as a level where price reversals have occurred in the past.


