
EUR/USD started a decent recovery above the 1.0500 resistance. USD/JPY is showing positive signs but must clear 137.30 to start a fresh increase.
Important Takeaways for EUR/USD and USD/JPY Analysis
- The Euro broke a few hurdles near 1.0500 and 1.0820 against the US Dollar.
- There was a break above a key bearish trend line with resistance near 1.0500 on the weekly chart of EUR/USD at FXOpen.
- USD/JPY corrected lower from the 152.00 resistance and found support at 127.20.
- There is a connecting bullish trend line forming with support at 133.00 on the weekly chart at FXOpen.
EUR/USD Technical Analysis
On the weekly chart of EUR/USD at FXOpen, the pair started a decent recovery wave after it settled above the 1.0000 level. The Euro was able to gain pace above 1.0200 against the US Dollar.
During the increase, it traded above a key bearish trend line with resistance near 1.0500 and the 50-week simple moving average. Recently, there was a move above the 50% Fib retracement level of the last major decline from the 1.2266 swing high to the 0.9535 low.
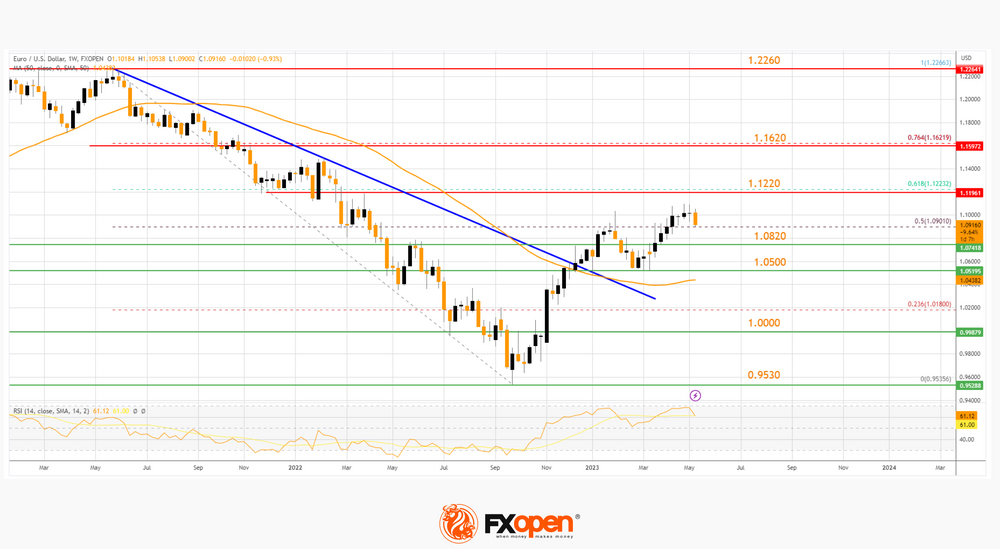
On the upside, the first major resistance is forming near the 61.8% Fib retracement level of the last major decline from the 1.2266 swing high to the 0.9535 low at 1.1220.
The next major resistance on the EUR/USD chart is near the 1.1620 level, above which the pair might revisit the 1.2260 resistance zone if the weekly RSI stays above 50.
Conversely, if EUR/USD fails to climb higher above the 1.1220 resistance, it could correct gains. Immediate support is near the 1.0820 level. The first major support is near the 1.0500 level, below which the pair could decline toward 1.0000.
USD/JPY Technical Analysis
On the weekly chart of USD/JPY, the pair faced strong rejection near the 152.00 level. The US Dollar started a downside correction below the 137.30 support against the Japanese Yen.
The pair tested the 127.20 support. A low was formed near 127.21 and the pair is now rising. It broke the 23.6% Fib retracement level of the downward move from the 151.94 swing high to the 127.21 low.
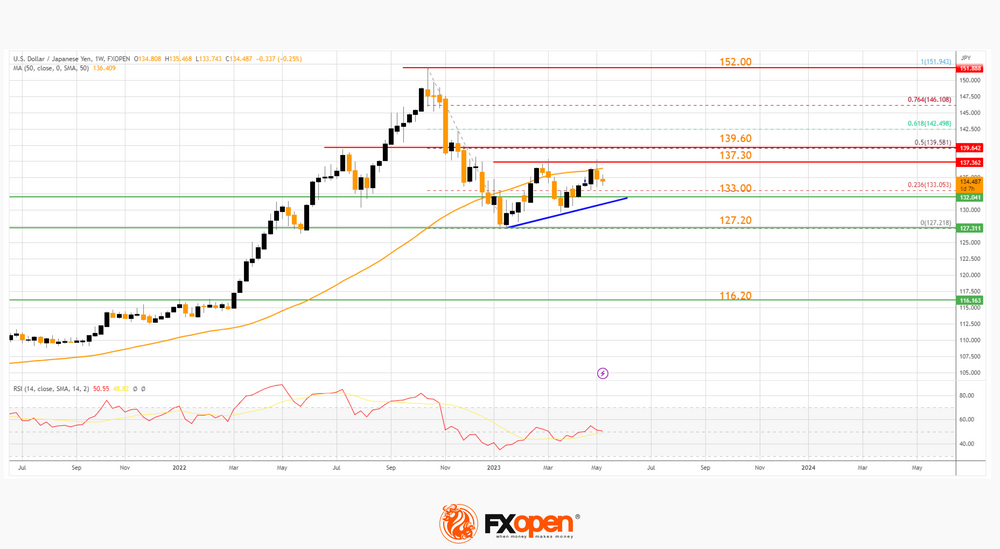
On the upside, the pair is facing resistance near the 50-week simple moving average and 137.20. The next major resistance on the USD/JPY chart is near the 50% Fib retracement level of the downward move from the 151.94 swing high to the 127.21 low at 139.60.
A successful close above 139.60 is likely to start a strong upward move toward 152.00 in the coming weeks. Conversely, if USD/JPY fails to break 139.60, it could retreat lower and revisit the 133.00 support area.
Besides, there is also a connecting bullish trend line forming with support at 133.00. A downside break below the trend line might send the pair toward 127.20.
Any more losses might push the pair into a bearish zone. In the stated case, there is a risk of a drop toward the 116.20 support zone in the medium term.


