
Key Highlights
- Crude oil prices started a recovery wave above $70.
- It broke a major bearish trend line with resistance near $70.80 on the 4-hour chart.
- EUR/USD extended its decline and spiked below 1.0840.
- Gold price is consolidating losses near the $1,975 support.
Crude Oil Price Technical Analysis
Crude oil prices remained well-bid above the $65 level against the US Dollar. The price started a recovery wave above the $68 and $68.50 resistance levels.
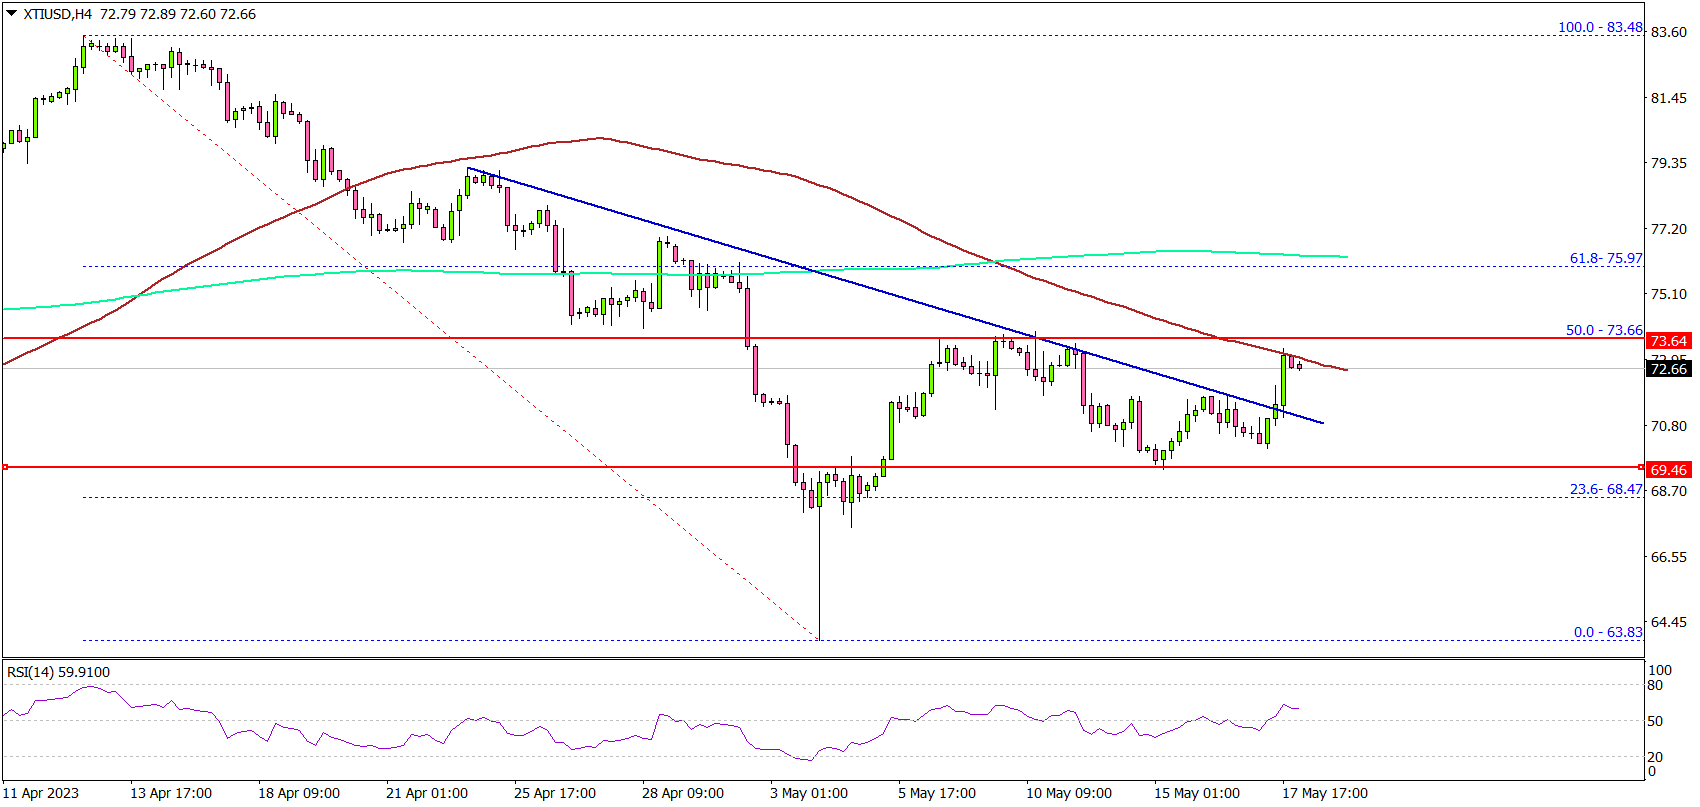
Looking at the 4-hour chart of XTI/USD, the price was able to settle above the $70 level. Besides, there was a break above a major bearish trend line with resistance near $70.80.
The price is now testing the $73 resistance and the 100 simple moving average (red, 4-hour). The first major resistance is near the $73.65 level which is near the 50% Fib retracement level of the downward move from the $83.48 swing high to the $63.83 low.
The next key resistance is near $76 and the 200 simple moving average (green, 4-hour), above which the price may perhaps accelerate higher.
On the downside, initial support is near the $70.80 level. The next major support sits near the $70.00 level. Any more losses might call for a test of the $68.00 support zone in the coming sessions.
Looking at EUR/USD, the pair is moving lower and there is now a risk of a downside break below the 1.0800 support zone.
Economic Releases to Watch Today
- US Initial Jobless Claims – Forecast 254K, versus 264K previous.


