
- Nikkei 225 recorded a month-to-day return of +5.80% for May and hit a 33-year high.
- Nikkei 225 outperformed the MSCI All Country World Index on a year-to-date basis (17% vs. 9%).
- Overbought conditions below 30,835 key resistance.
The Japanese stock market has continued to rally and outperformed the rest of the world. The benchmark Nikkei 225 has recorded a month-to-date return of +5.80% for May at this time of the writing that outperformed significantly against the US S&P 500 (-0.26%), MSCI All Country Asia ex Japan (-0.61%), MSCI Emerging Markets (+0.08%) and STOXX Europe 600 (-0.57%).
The reasons and supporting factors for its potential strategic and tactical outperformance that may persist into the second half of 2023 have been highlighted in detail in my previous articles.
The current medium-term uptrend phase of the Nikkei 225 that is in place since its 4 January 2023 low of 25,661 has hit a 52-week and 33-year high at 30,677. In the lens of technical analysis, the price actions of any liquid tradable financial instruments move in cyclical waveforms and not in a vertical fashion where there will be bouts of shorter-term periodic corrections within a higher degree timeframe trending phase as sentiments’ (both rational and irrational) of market participants adjust accordingly via greed and fear with respect to new relevant information.
Right now, after the recent steep rally of the Nikkei 225 in terms of its speed taken to reach such a current high level now faces a risk of a shorter-term corrective movement to retrace some portion of its medium-term uptrend phase from the 4 January 2023 low.
Japan 225 Technical Analysis – Watch the 30,835 key resistance
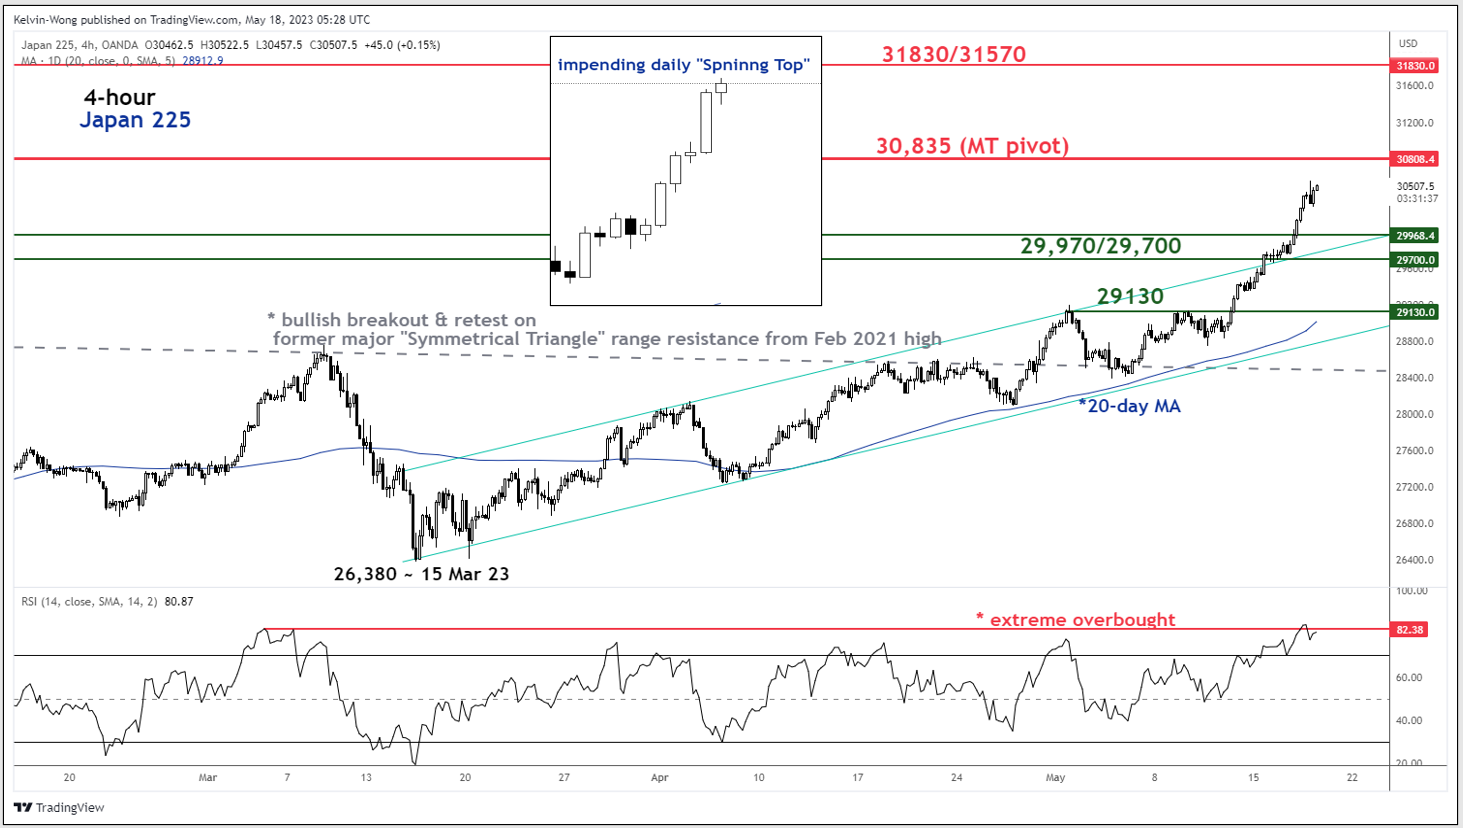
Fig 1: Japan 225 trend as of 18 May 2023 (Source: TradingView, click to enlarge chart)
The Japan 225 Index (a proxy for the Nikkei 225 futures) has formed an impending daily “Spinning Top” bullish exhaustion Japanese candlestick pattern right below a major resistance of 30,835 where the bulls have not managed to stage a breakout on prior two occasions on 15 February 2021 and 13 September 2021.
In the shorter term as seen on the 4-hour, the price actions of the Index have accelerated to the upside on 15 May 2023 via its bullish breakout of the upper boundary of the minor ascending channel from mid-March 2023 and the 4-hour RSI oscillator has reached an extreme overbought level of 82% since 5 March 2023.
These observations suggest an overstretched up move for the Index and the odds have increased for a potential short-term (multi-week) corrective pull-back within a medium-term (multi-month) uptrend phase that is still intact at this junction.
The immediate support to watch will be at 29,970/29,700 and a break below 29,700 exposes the next support at 29,130 which also confluences with the upward-sloping 20-day moving average.
On the other hand, a clearance with a 4-hour close above 30,835 sees the next resistance zone coming in at 31,830/31,570, defined by a cluster of Fibonacci extension levels and the former swing lows area of 18/25 June 1990.


, MSCI All Country Asia ex Japan (-0.61%), MSCI Emerging Markets (+0.08%) and STOXX Europe 600 (-0.57%).)