
Bulls were able to take control of the market, and after touching a low of $1,785 on 17 May, the ETHUSD pair started moving upwards, with strong demand seen above $1,800.
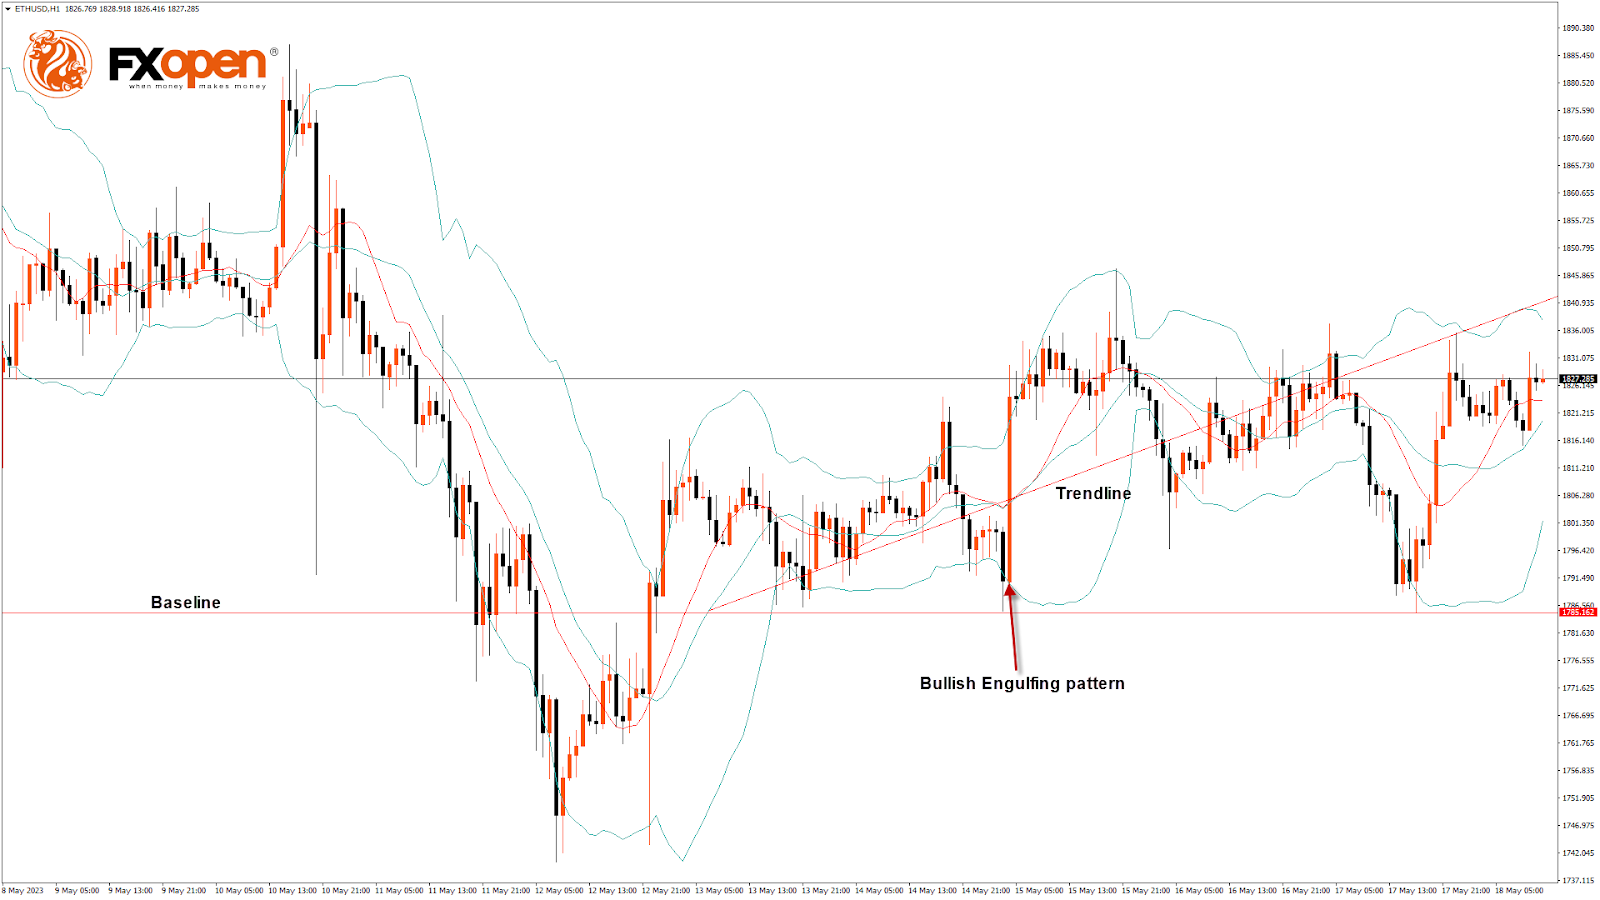
On the H1 timeframe:
- ETHUSD is supported by bulls after its decline below the $1,800 handle with immediate targets of $1,850 and $1,900.
- The bullish engulfing pattern is above the $1,785 handle. It’s a bullish pattern, which signifies the end of a bearish phase.
- The relative strength index is at 59.28, indicating a strong demand for Ether and a continuation of a buying sentiment in the market.
- Both the STOCH and ADX are giving a neutral signal, meaning that the Ethereum price is expected to remain in the consolidation phase in the short-term range.
- ETH price is now trading above the 100-hour simple and 200-hour exponential moving averages.
- ETH price bullish reversal is seen above the $1,785 mark.
- The average true range indicates low market volatility.
- The ultimate oscillator indicator provides a neutral signal.
ETH Bullish Reversal Seen above $1,785
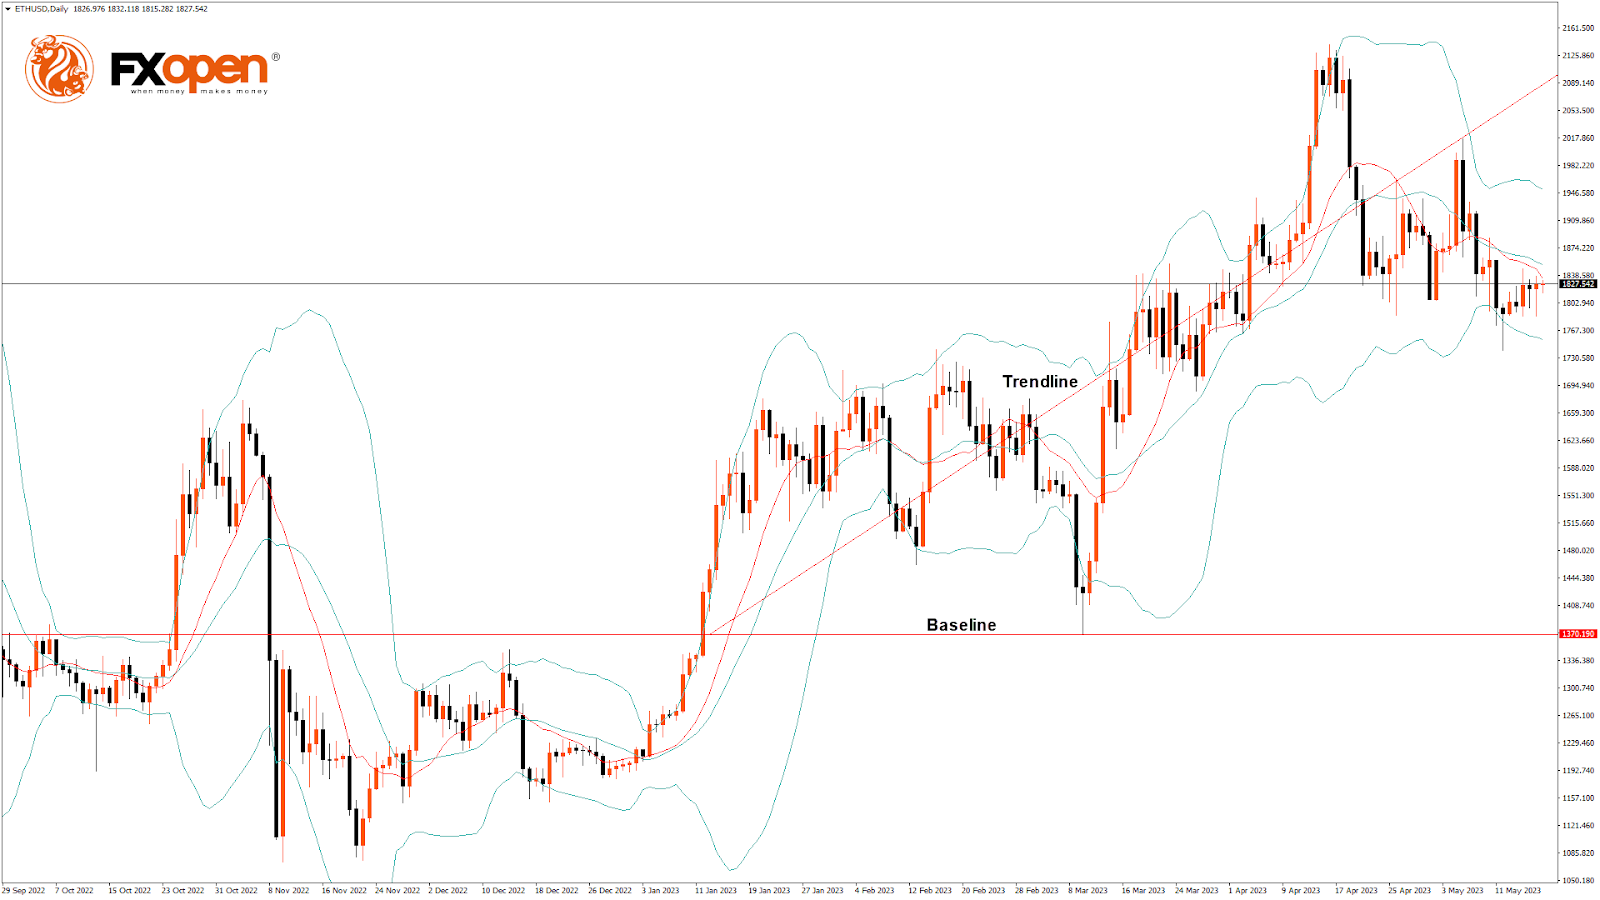
On the D1 timeframe:
- ETH price is trading just above its pivot level of $1,825 and is moving into a mild bullish channel.
- The price is about to break its classic resistance level of $1,833 and its Fibonacci resistance level of $1,839; further supports are $1,742 and $1,755.
- We can see the formation of a bullish engulfing pattern.
- The short-term range is expected to be mildly bullish.
- The resistance of the triangle and channel is broken.
On the weekly timeframe:
- The market opened bullish.
- The price is back over the pivot point.
- Some of the technical indicators signal a neutral tone in the market.
Most of the technical indicators are bullish. Most moving averages are bullish at the current market level of $1,826.
The key support levels to watch are $1,796, which is a 14-3 day raw stochastic at 20, and $1,816, which is a pivot point.
The Week Ahead
The Ethereum to USD exchange rate continues to correct higher, above $1,800, reflecting the bullish momentum and is expected to move towards the $1,850 level in the medium-term range in the H1 timeframe.
We see a short-term bullish trend line forming from $1,785 towards $1,842.
The immediate short-term outlook for ETH has turned mildly bullish, the medium-term outlook has turned bullish, and the long-term outlook is neutral in present market conditions.
The resistance zone is at $1,839, at which the price crosses a 18-day moving average, and at $1,852, which is a 14-day RSI at 50.
The weekly outlook for Ethereum price is $1,900, with a consolidation zone around $1,850.


