
DXY:
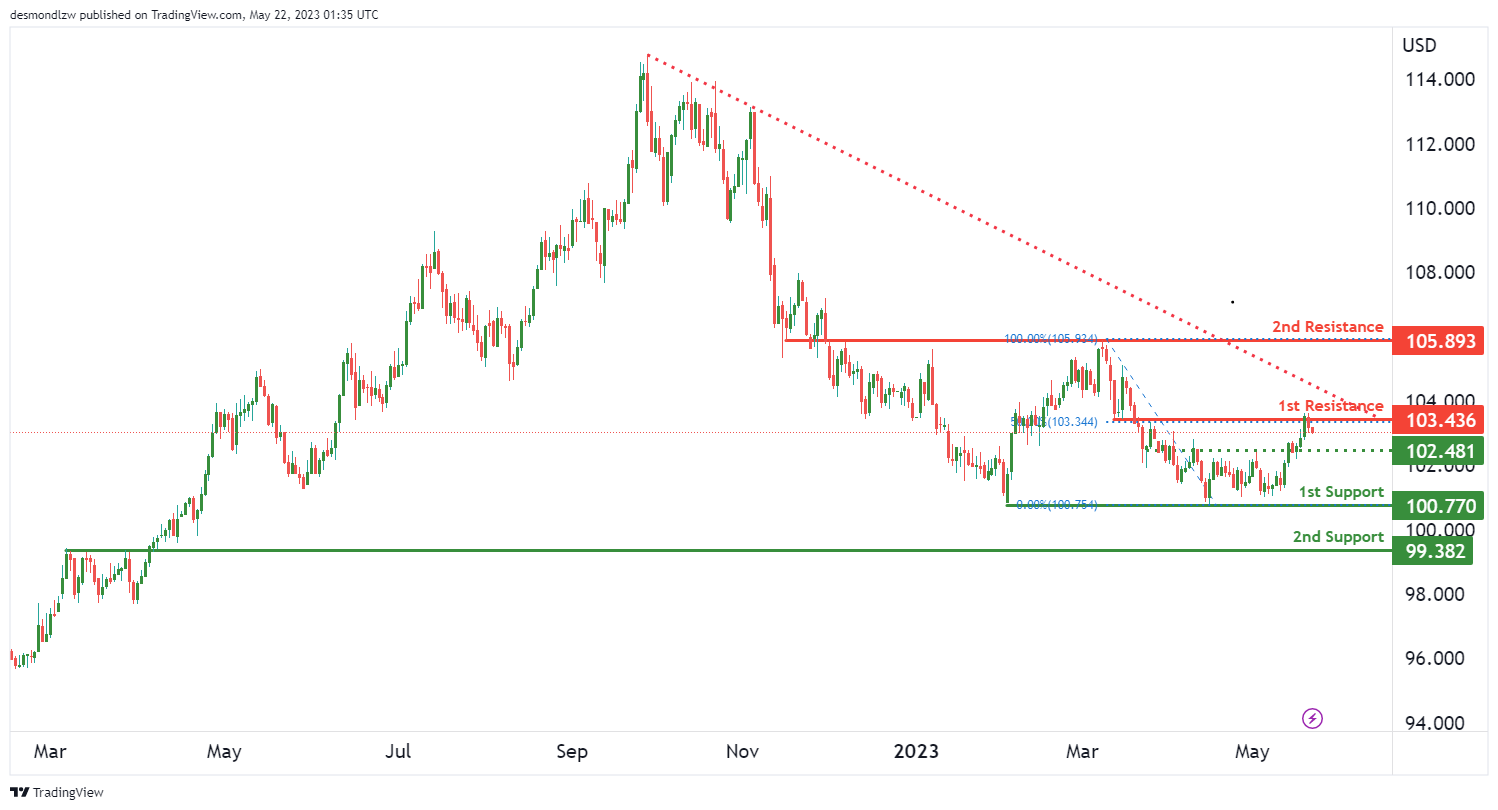
The DXY chart is currently bearish, with the price trading below a major descending trend line, suggesting further bearish momentum could be on the cards.
The price could potentially continue downwards to the 1st support level. The 1st support is at 100.77, serving as a multi-swing low support, which could be a strong level of buying interest.
Below that, the 2nd support is found at 99.38, acting as a pullback support level that might provide additional buying pressure to prevent further declines.
On the upside, the 1st resistance is located at 103.43. This overlap resistance, also coinciding with the 50% Fibonacci retracement level, may provide a significant barrier for any bullish attempts.
Above that, the 2nd resistance is found at 105.89. This overlap resistance might also serve as a potential barrier to the price if it tries to move upward.
In a bearish environment, these resistance levels might act as potential reversal points, while support levels might act as areas where the price could bounce or slow its bearish momentum.
EUR/USD:
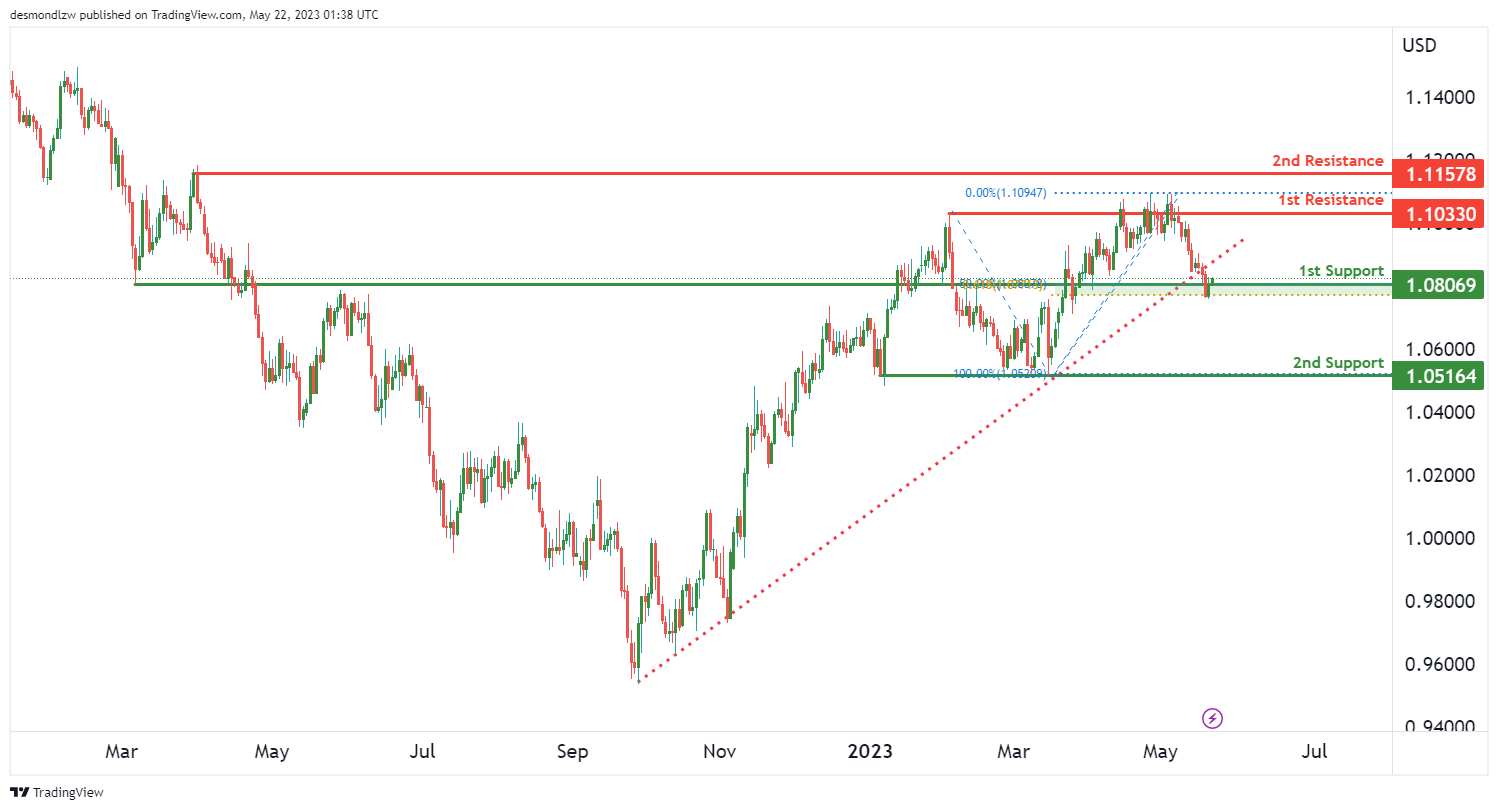
The EUR/USD pair appears to be on a bearish trend, as indicated by a break below an ascending support line, which suggests a potential bearish move.
The pair may potentially break further downward off the first support at 1.0806, leading to a drop towards the second support. This first support level is particularly strong as it represents a significant Fibonacci confluence, being both a 50% Fibonacci retracement and a 61.80% Fibonacci projection. These Fibonacci levels often act as strong psychological levels of support or resistance in the market.
The second support level is at 1.0516, which stands as a multi-swing low support. This suggests that this level has been tested multiple times in the past as a support level and could potentially hold up against further price declines.
On the upside, if the pair begins to reverse its bearish trend, it could face resistance at 1.1033. This level acts as an overlap resistance and could potentially hinder bullish momentum.
Further up, the second resistance level is at 1.1157, which could act as a swing high resistance. This means it has previously been a level at which price has reversed, indicating it could serve as a barrier to further price increases.
GBP/USD:
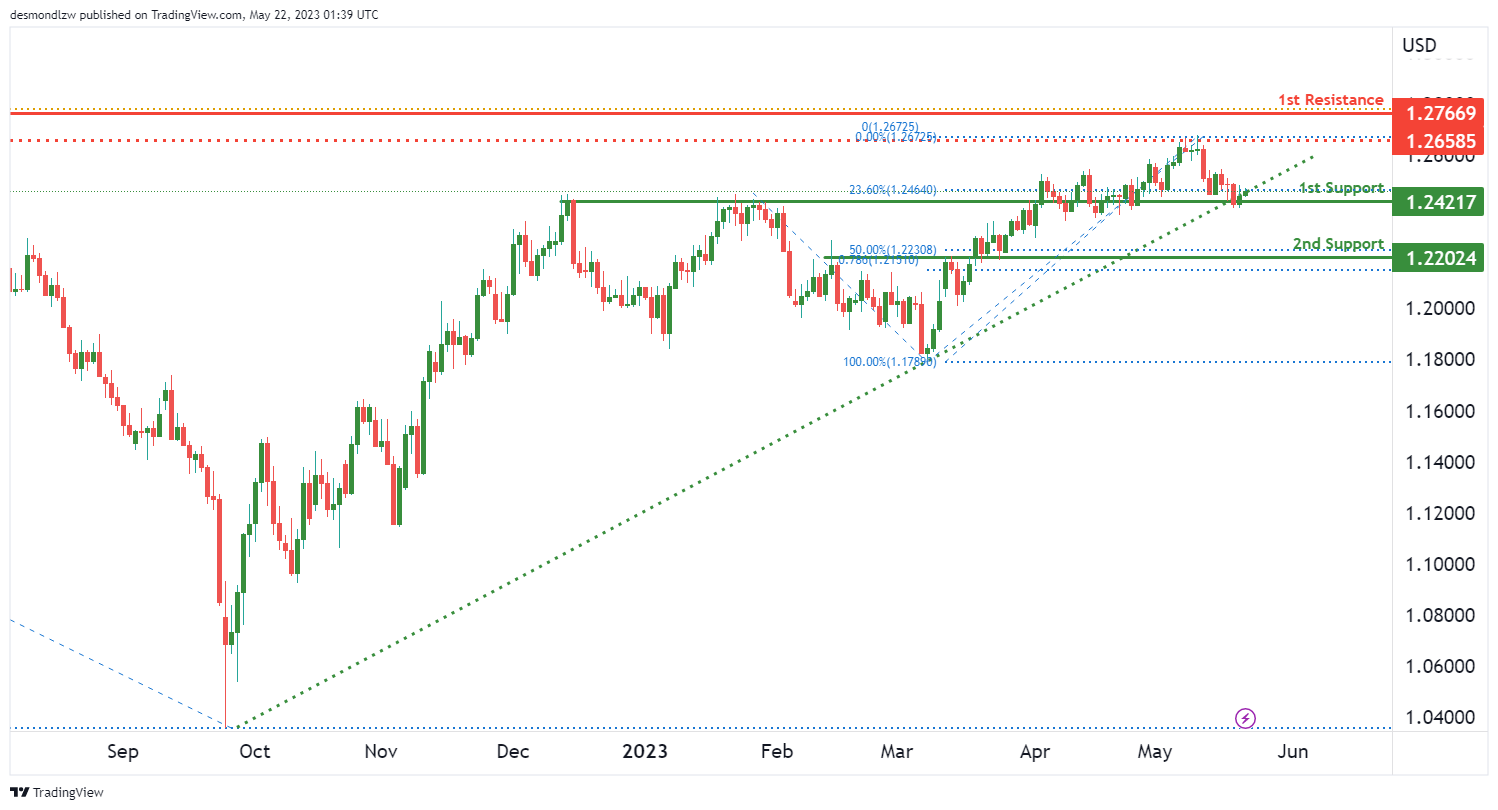
The GBP/USD pair currently displays a bullish trend, which is supported by the fact that the price is above a major ascending trend line. This suggests that further bullish momentum may be expected.
Potential price action could see a bullish bounce off the first support, and an upward move towards the first resistance.
The first support level is located at 1.2421 and it acts as an overlap support, indicating it has been a significant level in the past, both as support and resistance.
The second support is found at 1.2202 and acts as a pullback support, meaning it has proven to support price action during a pullback within the overall upward trend.
On the upside, the first resistance level to watch is at 1.2766, acting as a swing high resistance, a level where price has historically reversed and moved lower.
An intermediate resistance level has also been identified at 1.2658. This level acts as a multi-swing high resistance, suggesting it has served as a price ceiling multiple times in the past.
USD/CHF:
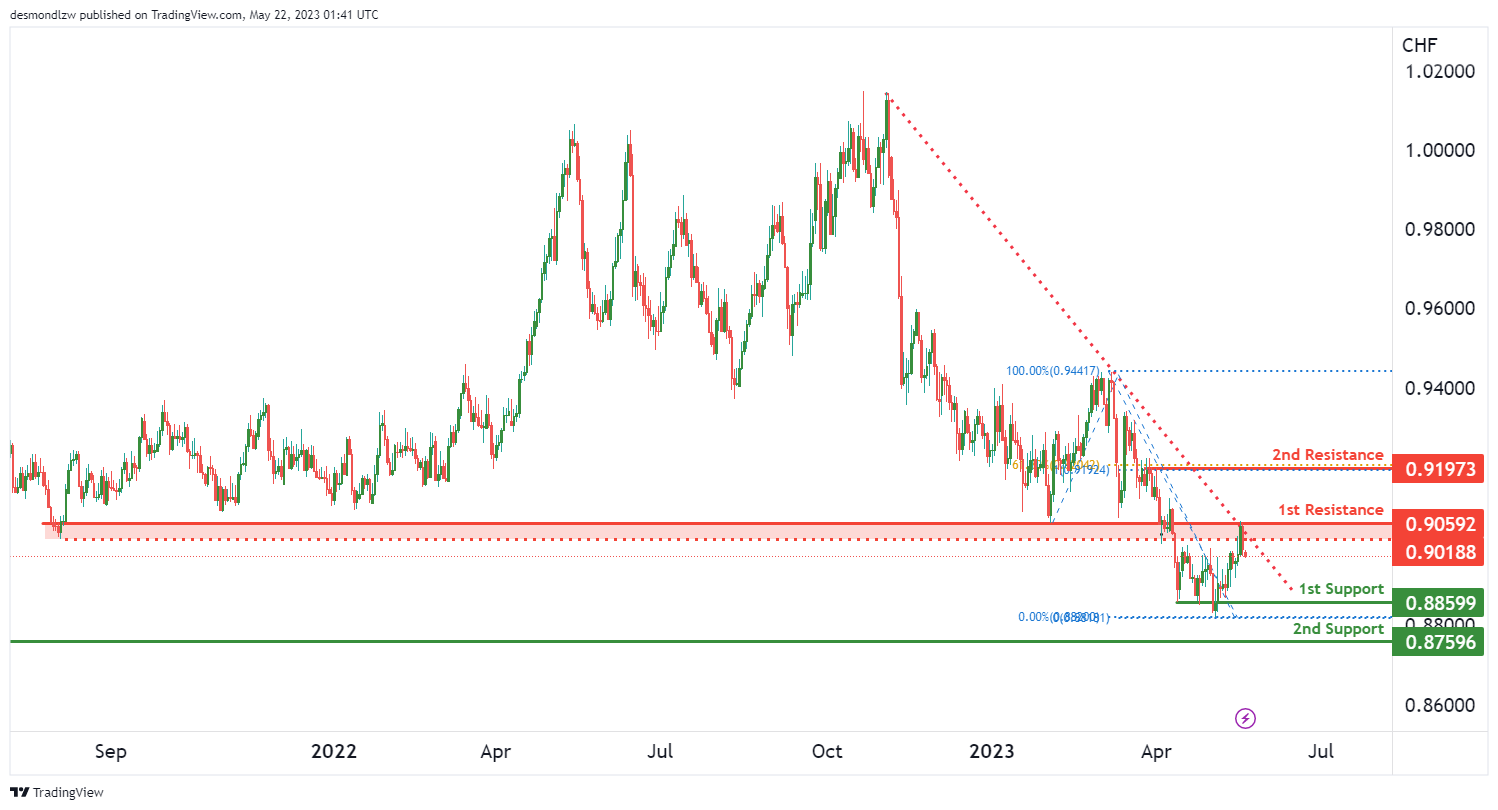
The USD/CHF pair is currently on a bearish trend, indicated by the price movement being below a major descending trend line.
Given this trend, it is possible that the price could continue to move bearishly towards the first level of support.
The first support level is identified at 0.8859, which has acted as a multi-swing low support in the past, signifying its importance as a floor level in this downtrend.
The second support level is at 0.8759, and this acts as a swing low support. This level has previously acted as a turning point for the price.
On the other hand, if the price reverses upwards, the first resistance level is seen at 0.9059. This level serves as an overlap resistance, indicating it has acted as both a support and resistance level in the past.
The second resistance is at 0.9197, and this level is considered a significant one since it represents a multi-swing high resistance. Additionally, it corresponds with the 61.8% Fibonacci retracement and the 100% Fibonacci projection, suggesting that it may act as a substantial barrier for upward movements.
An intermediate resistance level is also identified at 0.9018, which is considered a pullback resistance, highlighting its potential to halt short-term price increases during this overall downtrend.
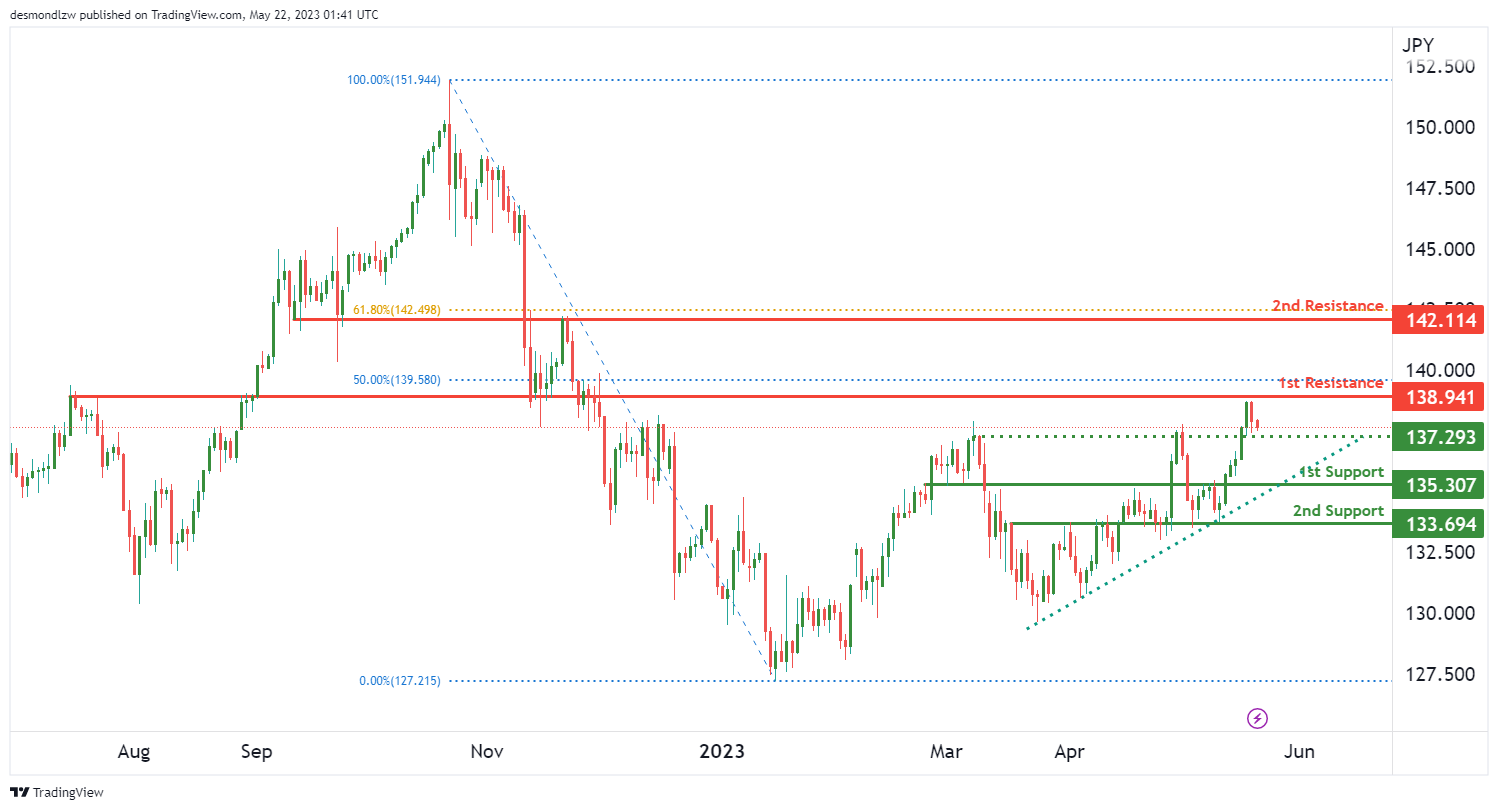
USD/JPY:
The USD/JPY pair is currently experiencing a bearish trend, despite the price being above a major ascending trend line. This could suggest that there may be a potential reversal or consolidation on the horizon.
However, considering the current bearish momentum, it’s plausible that the price could continue this downtrend towards the first level of support.
The first level of support is at 135.30, acting as a pullback support. This is where the price has previously bounced back after a downturn, potentially indicating its significance as a psychological level for market participants.
The second level of support is located at 133.69, acting as an overlap support. This level has acted as both a support and resistance level in the past, indicating its potential importance.
Should the price reverse, the first resistance level is at 138.94. This level serves as an overlap resistance and aligns with the 50% Fibonacci retracement level, indicating a significant hurdle for the price if it starts to increase.
The second resistance level is at 142.11, also acting as an overlap resistance. In addition, it corresponds with the 61.8% Fibonacci retracement, which is often considered a key level in market retracements.
There is an intermediate level of support at 137.29, which has previously acted as a pullback support, further highlighting its potential to halt short-term price decreases during this overall downtrend.
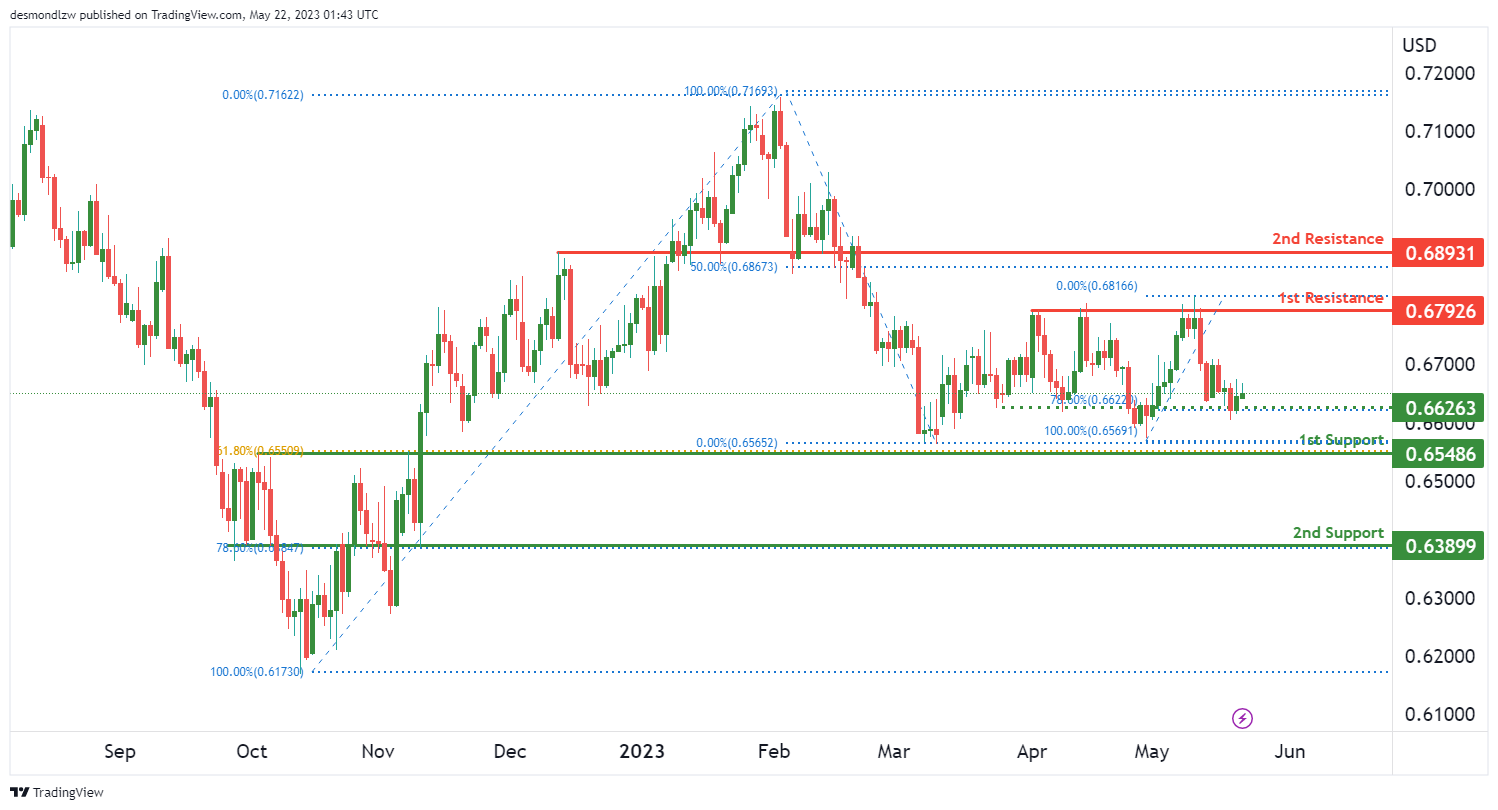
AUD/USD:
The AUD/USD pair is currently experiencing a bearish trend. This suggests that the pair might continue to decrease towards the first level of support.
The first support level is at 0.6548, which acts as an overlap support. This level is significant as it aligns with the 61.8% Fibonacci retracement level, which is often considered a key level in market retracements.
The second support level is at 0.6389, which also serves as an overlap support and aligns with the 78.6% Fibonacci retracement level. This level has also shown to be significant in market retracements and could potentially halt further price decrease.
On the upside, if the price reverses, the first resistance level is at 0.6792, which has previously acted as a multi-swing high resistance. This means the price has hit this level multiple times in the past and struggled to break above it.
The second resistance level is at 0.6893 and serves as a pullback resistance. This indicates it’s a level where the price has previously rebounded after a brief retracement.
In between, there is an intermediate level of support at 0.6626. This level serves as a pullback support and is also at the 78.6% Fibonacci retracement level, highlighting its significance in potentially stopping the price from falling further.
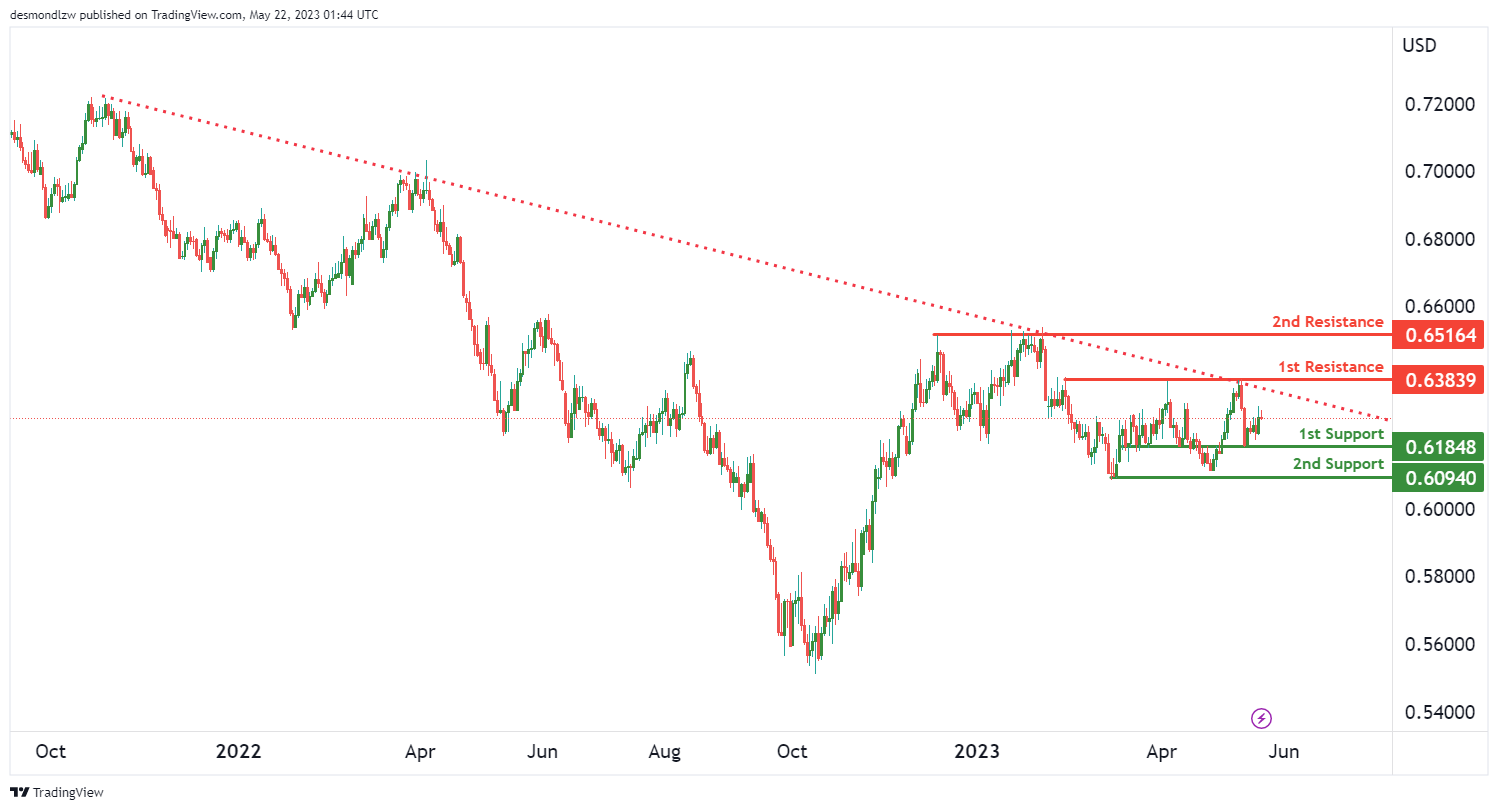
NZD/USD
The NZD/USD pair currently has a bearish trend, and the price might continue to decrease towards the first level of support.
The first support level is at 0.6184, which is considered an overlap support, a price level that has acted as both resistance and support in the past. This could be a level where the price may pause or rebound.
The second support level is at 0.6094, representing a multi-swing low support. This is a level where the price has bottomed out multiple times in the past, indicating a strong level of demand.
On the upside, the first resistance level is at 0.6383. This level has acted as a multi-swing high resistance in the past, a price level that the market has failed to exceed after several attempts, which may lead to a price reversal.
The second resistance is at 0.6516, acting as a pullback resistance. This is a level where the price has rebounded after a brief retracement.
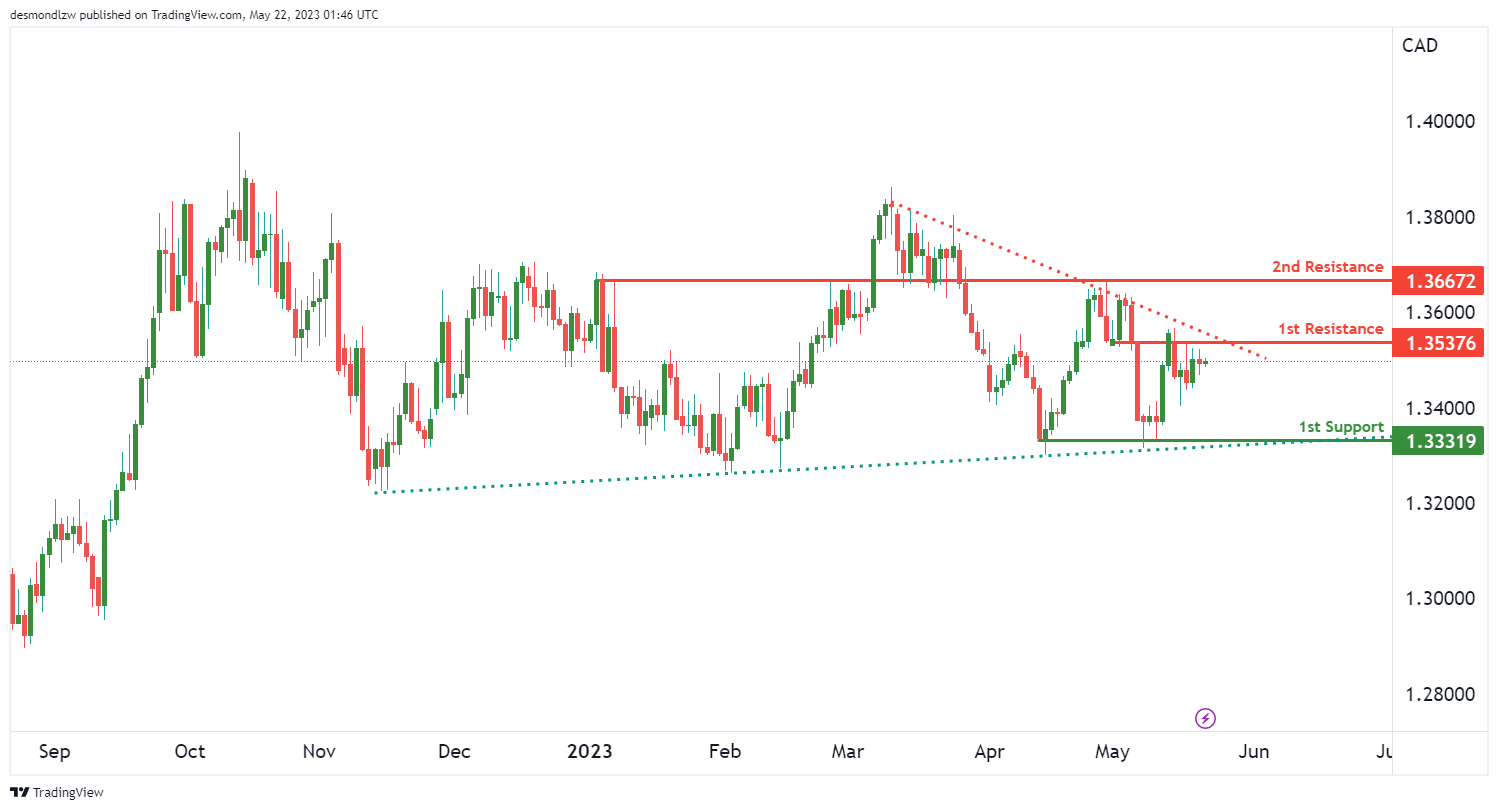
USD/CAD:
The USD/CAD pair currently shows a bearish trend, with potential for continuation towards the first support level.
The first support level is at 1.3331, considered a multi-swing low support. This is a level where the price has bottomed out multiple times in the past, indicating a strong level of demand.
In case of a potential reversal or pullback, the first resistance level to consider is at 1.3537, identified as an overlap resistance. This means that this level has served as both support and resistance in the past.
The second resistance level is at 1.3667, another overlap resistance. This level, like the first, has seen price action flip between support and resistance, making it a significant level to watch for potential price reactions.
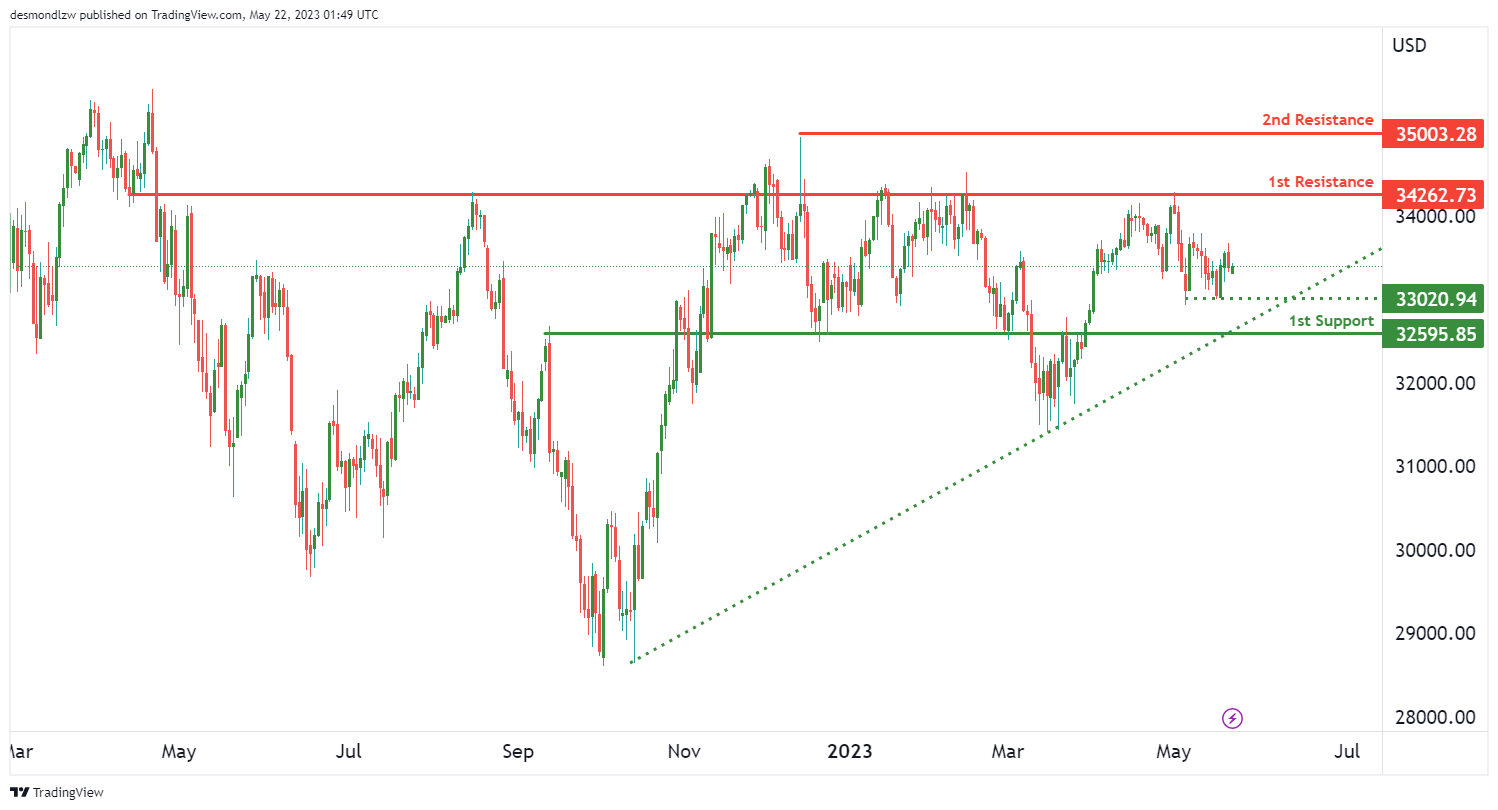
DJ30:
The DJ30 (Dow Jones Industrial Average) currently shows a bullish trend, with potential for continuation towards the first resistance level.
The first support level is at 32595.85, considered a multi-swing low support. This is a level where the price has bottomed out multiple times in the past, indicating a strong level of demand.
The intermediate support is at 33020.94, which also functions as a multi-swing low support level, adding another layer of demand before the price reaches the first support level.
The first resistance level is at 34262.73, identified as an overlap resistance. This means that this level has served as both support and resistance in the past.
The second resistance level is at 35003.28. This level is a multi-swing high resistance point, indicating that it has capped the price advances multiple times in the past and may pose a challenge for bulls.
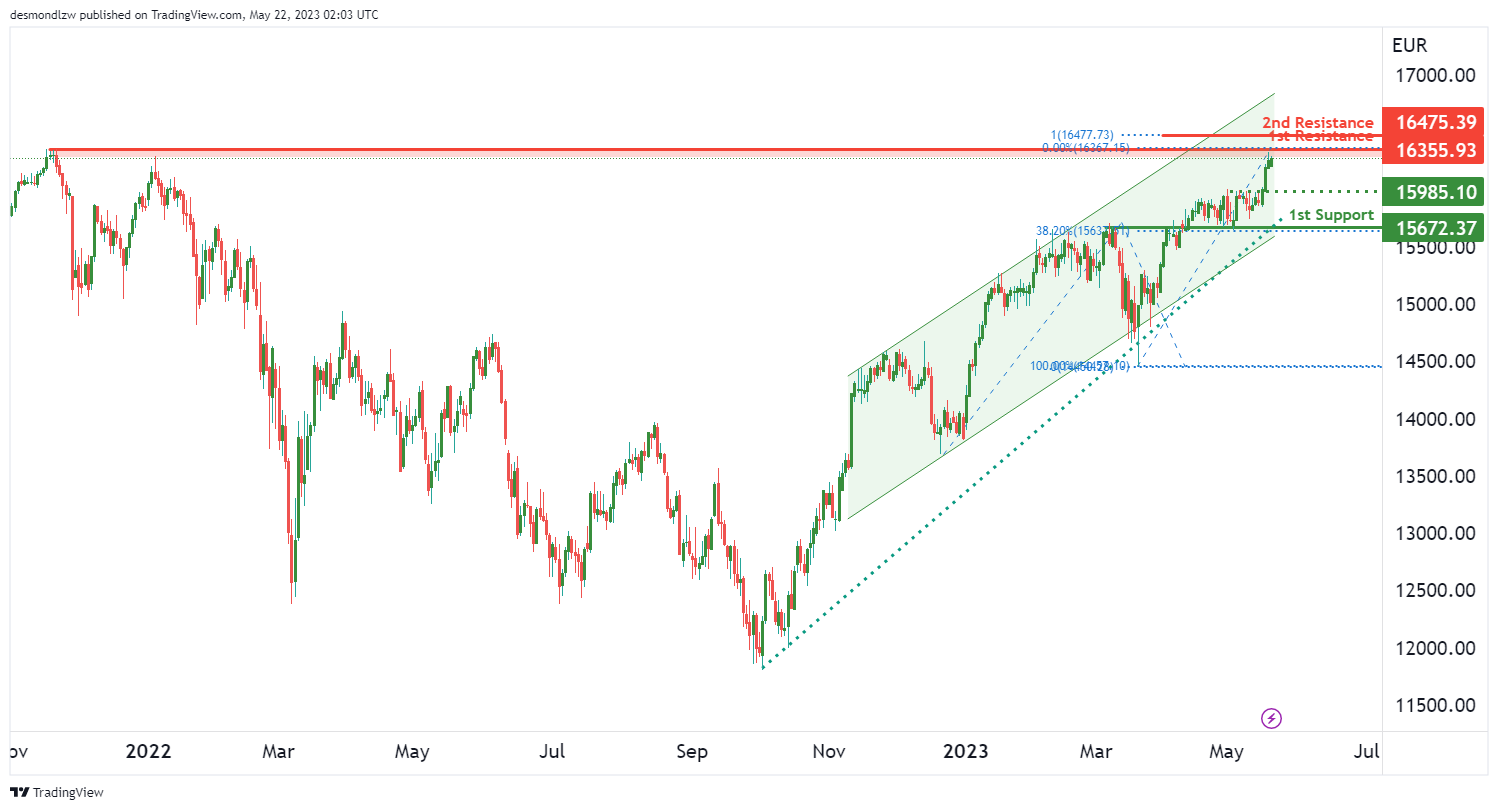
GER30:
The GER30 (DAX Index) currently presents a bullish outlook, suggesting that the price could break through the first resistance level and rise towards the second resistance level.
The first support level is identified at 15672.37, which serves as an overlap support, indicating that this level has previously acted as both support and resistance. This level could potentially halt a price decline.
The intermediate support is noted at 15985.10. This level is seen as a pullback support, which could provide a cushion for the price if it were to retrace from its recent advances.
The first resistance level is found at 16355.93. This level serves as a multi-swing high resistance, which means it has capped the price advances multiple times in the past, presenting a hurdle for continued bullish price action.
The second resistance level is at 16475.39, which is also where the 100% Fibonacci projection is located. This level could potentially be a target for the bulls if the price were to break through the first resistance.
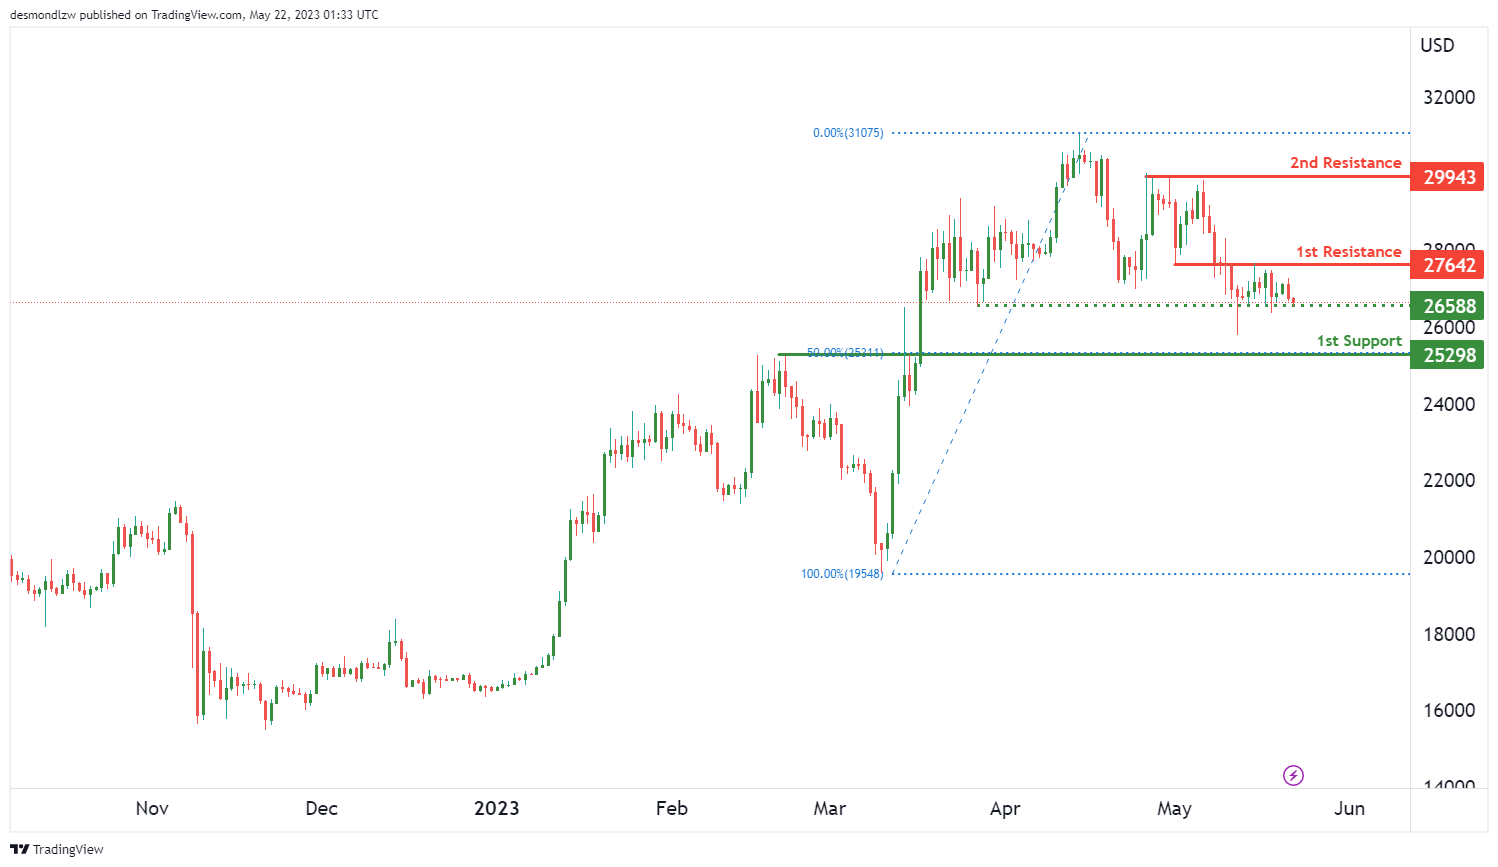
BTC/USD:
The GER30 (DAX Index) is currently showing a bearish momentum, suggesting a possible continuation of the price decline towards the first support level.
The first support level is found at 25298, serving as a pullback support, a level that the price has previously rebounded from. Additionally, this level is also at the 50% Fibonacci retracement level, making it a significant level to watch as prices could potentially bounce back.
The intermediate support level is at 26588, acting as a multi-swing low support. This level has served as the low point for multiple price swings and might provide a strong support in the event of further price declines.
The first resistance level is at 27642, acting as an overlap resistance. This level has previously served as both support and resistance, making it a significant hurdle for price advances.
The second resistance level is at 29943, which has acted as a multi-swing high resistance, capping price advances multiple times in the past. This could be a target for any bullish reversals.
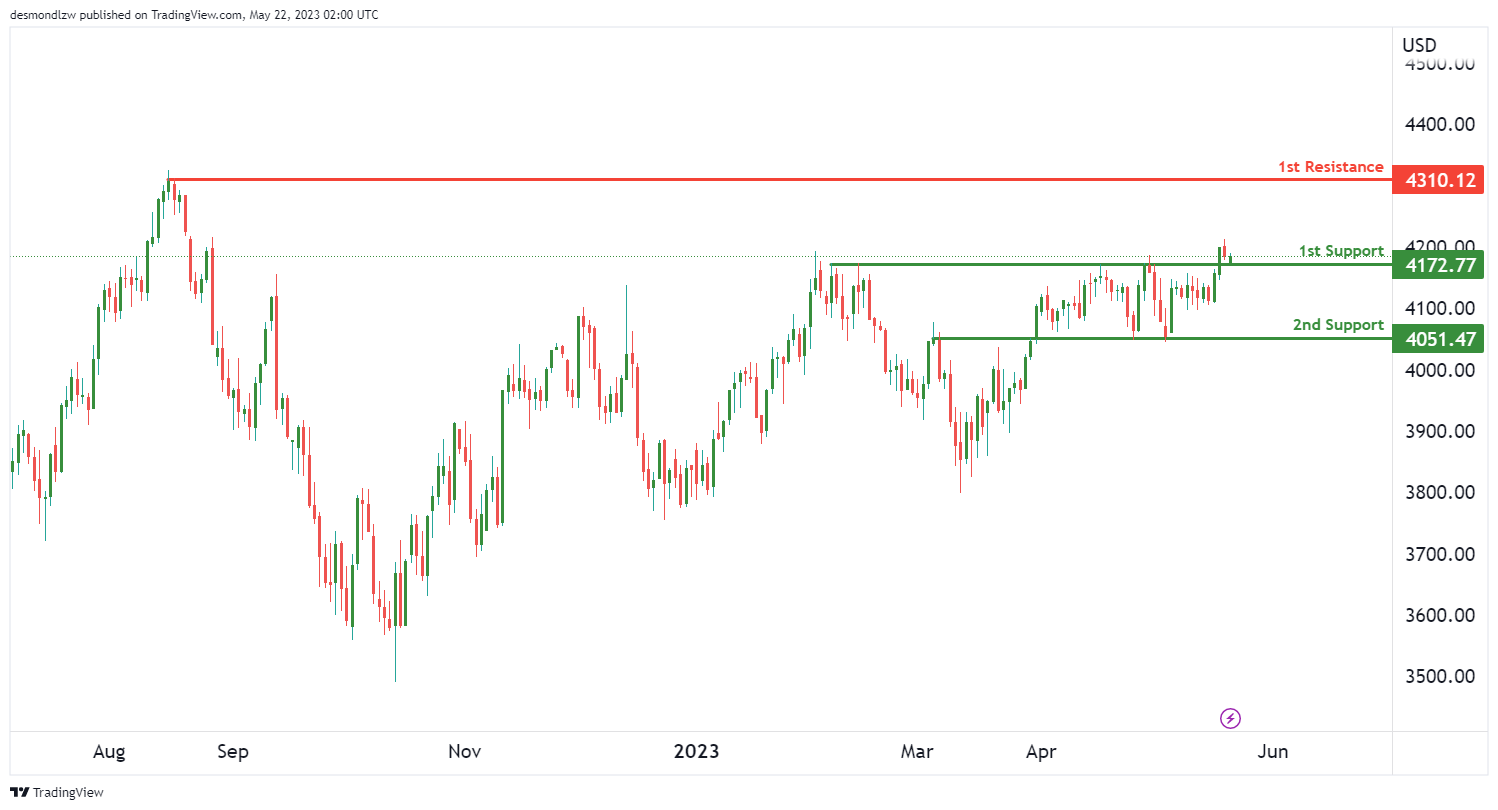
US500
The US500 (S&P 500 Index) is currently showing a bullish momentum, suggesting potential for further upside.
The first support level is at 4172.77, which serves as a pullback support, where the price has previously rebounded from. Moreover, this level coincides with the 50% Fibonacci retracement level, further increasing its significance as a potential area where prices might bounce back.
The second support level is at 4051.47. This level acts as an overlap support, meaning it has previously served as both support and resistance, thereby making it a key level to watch.
On the upside, the first resistance level is at 4310.12. This is a swing high resistance level, indicating that it has previously capped price advances. Therefore, it could be a target for any bullish moves.
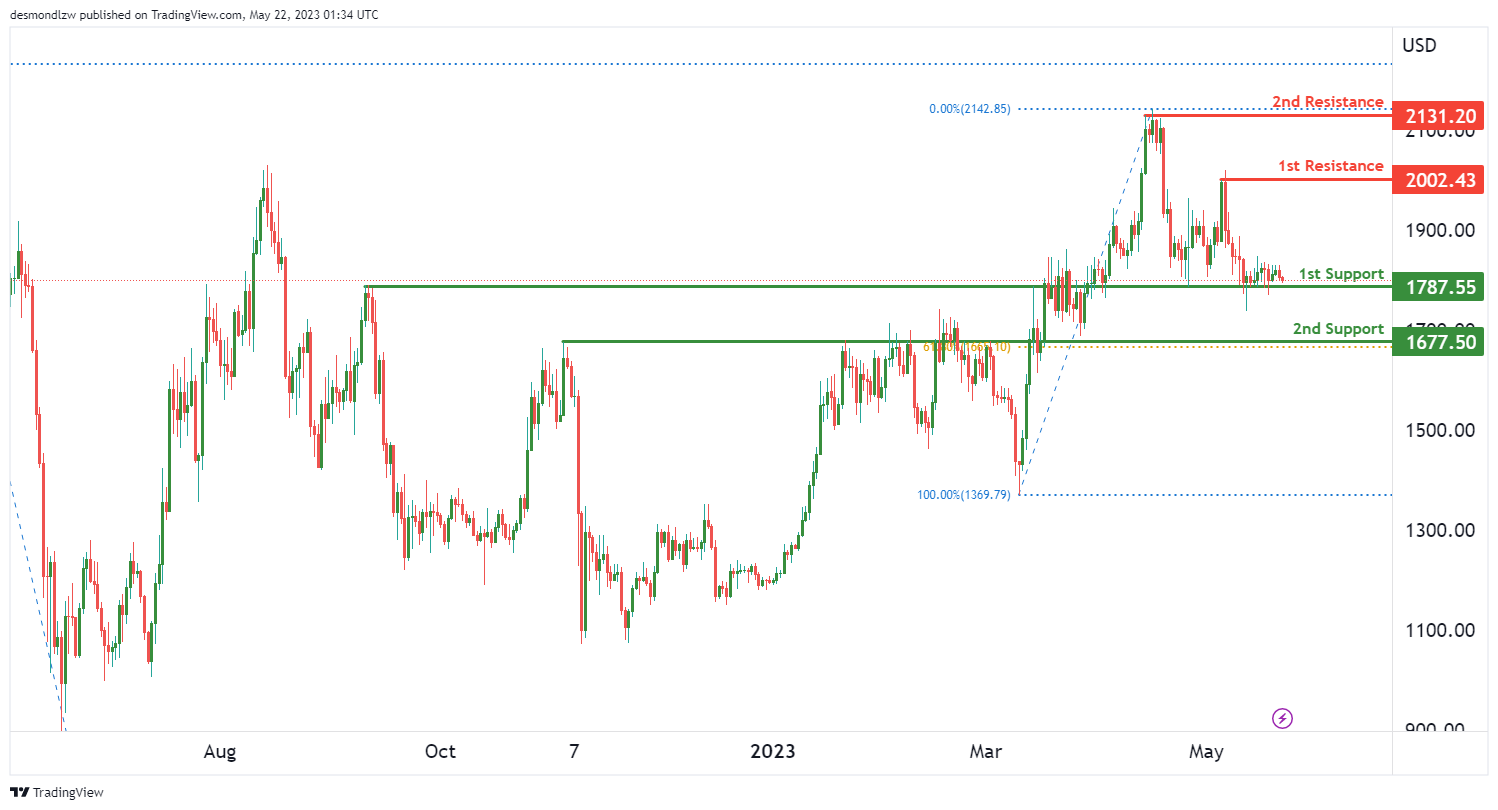
ETH/USD:
The ETH/USD (Ethereum to US Dollar) pair is currently showing a bullish momentum, suggesting potential for further upside.
The first support level is at 1787.55, which serves as an overlap support. This level has acted as both support and resistance in the past, and it could potentially hold as a strong support again.
The second support level is at 1677.50. This is another overlap support, but notably, it also coincides with the 61.80% Fibonacci retracement level. This adds more significance to this level as a potential area where prices might bounce back.
On the upside, the first resistance level is at 2002.43. This is a swing high resistance level, indicating that it has previously capped price advances. Therefore, it could be a target for any bullish moves.
The second resistance level is at 2131.20. This is a multi-swing high resistance level, indicating that it has been a difficult level to break through multiple times in the past. If price can break this level, it could suggest more upside for the pair.
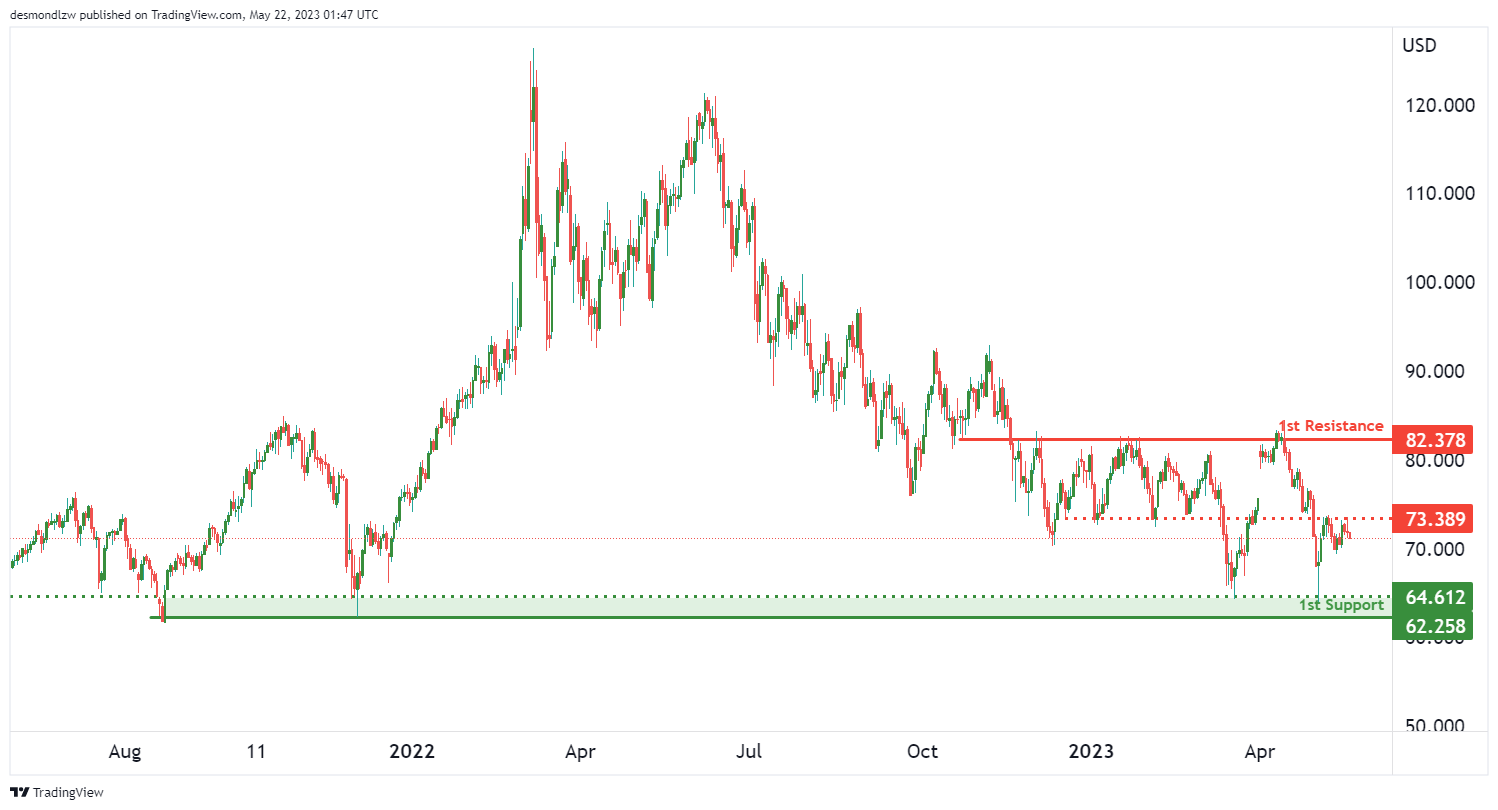
WTI/USD:
The WTI (West Texas Intermediate) is showing a bearish momentum, suggesting a potential continuation of a downtrend.
The first support level is at 62.25, which is a multi-swing low support. This means that the price has bounced off this level multiple times in the past, making it a potentially strong support level where the price could bounce back.
An intermediate support level is at 64.61. This is also a multi-swing low support level, indicating that the price has bounced from this level on more than one occasion. It could potentially act as a cushion for any further declines.
On the upside, the first resistance level is at 82.37. This is an overlap resistance level, meaning that the price has faced resistance at this level in the past. It could potentially cap any upside moves.
An intermediate resistance level is at 73.38. This is another overlap resistance level where the price could face some resistance.
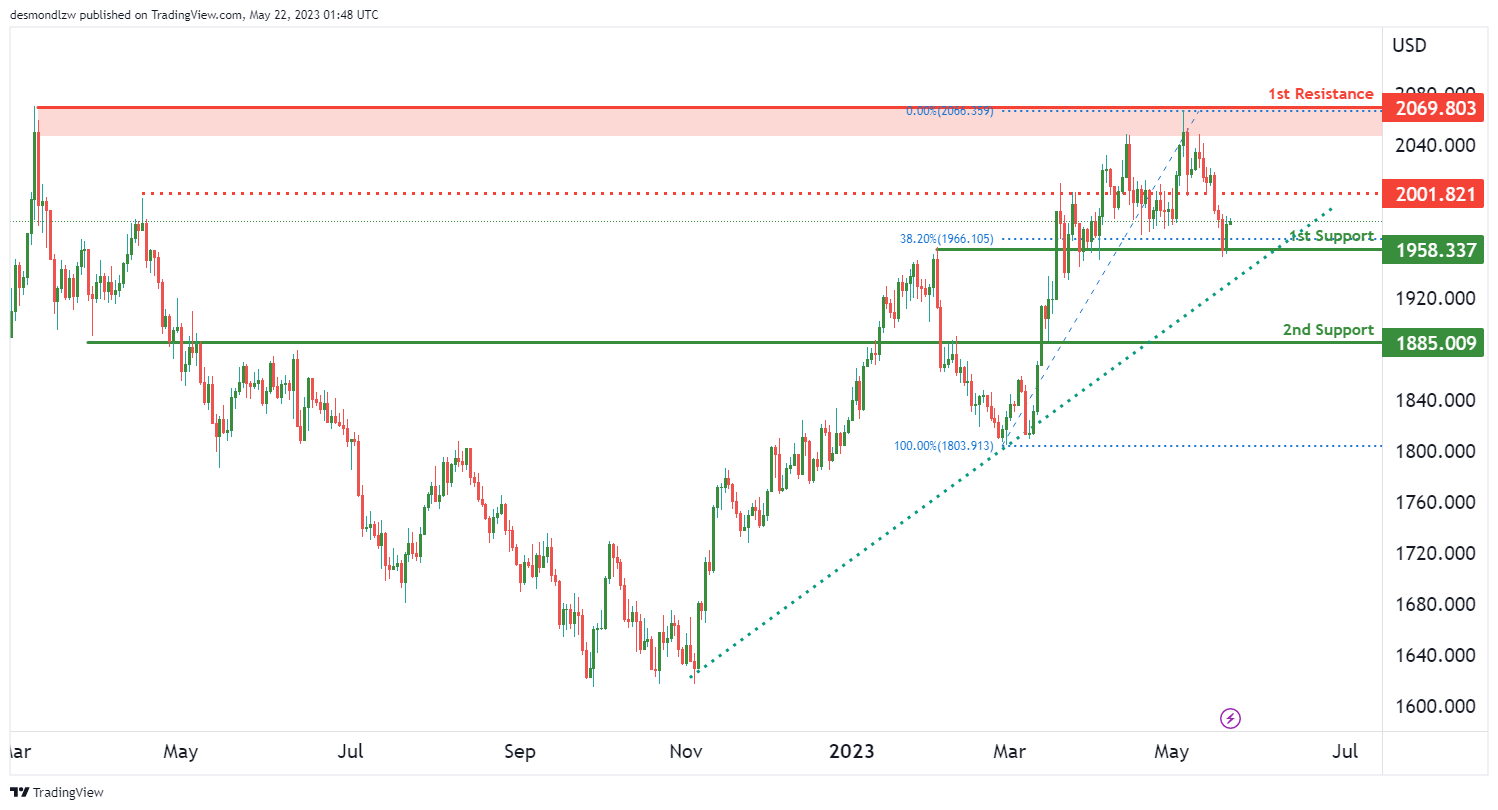
XAU/USD (GOLD):
The XAU/USD chart demonstrates bullish momentum, with the price positioned above a major ascending trend line, suggesting the potential for further upward movement.
In line with this bullish momentum, there is a possibility of a bullish continuation towards the first resistance level at 2069.80.
To support this potential upward movement, there are two levels of support. The first support level at 1958.33 is identified as an overlap support and coincides with a 38.20% Fibonacci retracement, indicating its significance as a potential price floor.
The second support level at 1885.00 is recognized as an overlap support, contributing to the overall bullish sentiment.
On the resistance side, the first resistance level at 2069.80 represents a multi-swing high resistance. Additionally, there is an intermediate resistance level at 2001.82, which is identified as a pullback resistance.
These levels of support and resistance indicate potential areas where the price may find support or encounter resistance as it continues its bullish momentum.


