
- Bearish reversal elements have been sighted for Nasdaq 100
- The +30% up move from the 28 December low has reached the upper boundary of the “Ascending Wedge”, a bearish reversal chart pattern.
- The key short-term resistance to watch will be at 13,835.
This is a follow-up on a prior report, “Nasdaq 100 bulls may be too optimistic on US CPI” that has been published earlier on 11 May (click here for a recap).
The Nasdaq 100 has been the strongest performing major US stock index since October 2022 fuelled by solid gains seen in the mega market capitalization-weighted technology stocks; Meta/Facebook, Apple, Amazon, Netflix, Alphabet/Google, Microsoft, and NVIDIA. Interestingly, it underperformed yesterday, 23 May against the other indices with a loss of -1.28%; S&P 500 (-1.12%), Dow Jones Industrial Average (-0.69%), Russell 2000 (-0.43%), its worst daily performance since 25 April.
Nasdaq 100 Technical Analysis – Bearish elements sighted at “Ascending Wedge” resistance
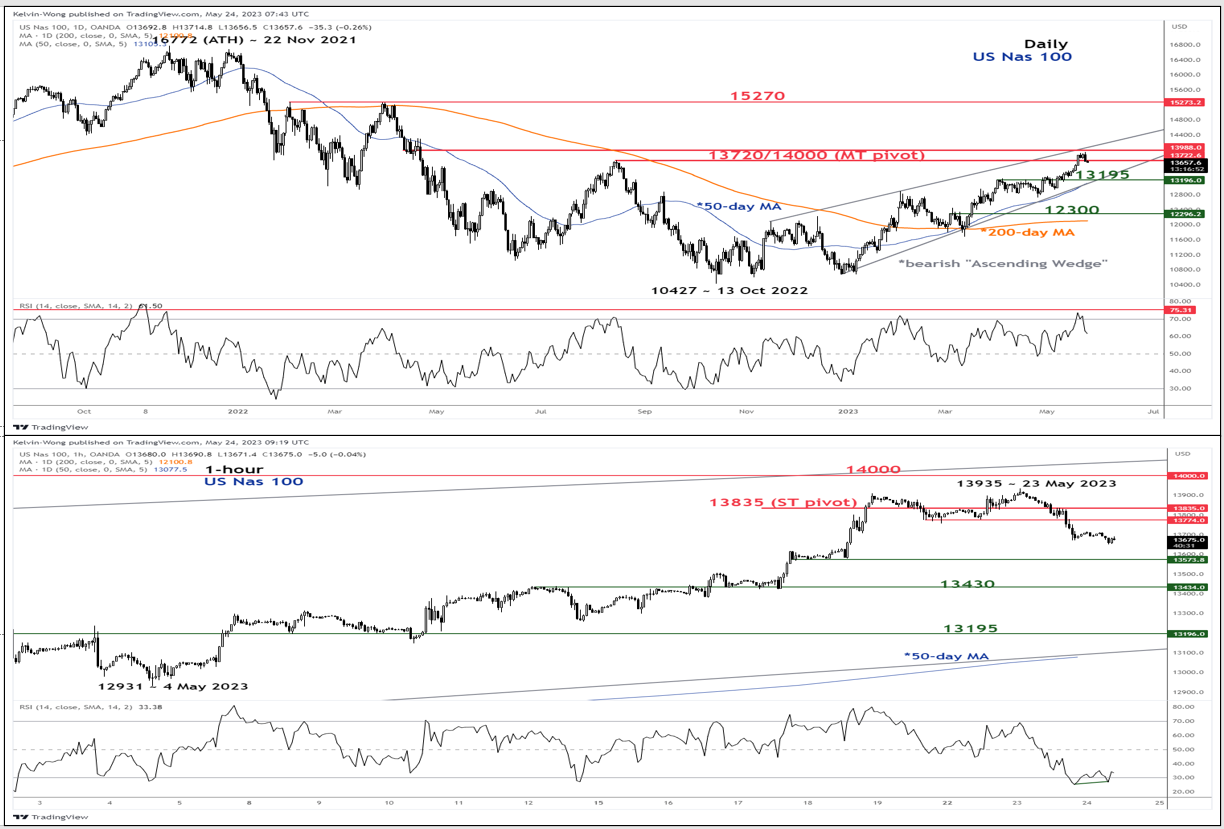
Fig 1: US Nasdaq 100 trend as of 24 May 2023 (Source: TradingView, click to enlarge chart)
The +30% up move seen on the US Nas 100 Index (a proxy for the Nasdaq 100 futures) from its 10,675 low of 28 Dec 2022 to its recent high of 13,935 printed on 23 May 2023 has reached the upper boundary/resistance of a major “Ascending Wedge” configuration which tends to represent a bearish reversal pattern.
In addition, the daily RSI oscillator has just exited from its overbought region which reinforces the view that the upside momentum of the up move from the 28 December 2022 low of 10,675 has dissipated and increased the probability of a bearish reversal move in price actions at this juncture.
In the shorter term as depicted on the hourly chart, yesterday’s slide of -2% from the 23 May 2023 high of 13,935 has led the hourly RSI to reach its oversold region which may see a risk of a minor bounce to retrace a portion of the earlier -2% decline.
Key short-term pivotal resistance at 13,835 to maintain the bearish tone with intermediate support at 13,430 and follow by 13,195 next (50-day moving average & the lower boundary of the “Ascending Wedge”). On the other hand, a clearance above 13,835 negates the bearish tone to see the medium-term resistance coming in at 14,000 (upper boundary of the “Ascending Wedge”).


, Dow Jones Industrial Average (-0.69%), Russell 2000 (-0.43%), its worst daily performance since 25 April.)