
Let’s dive into the world of gold. Currently, the price of gold, represented by XAUUSD, is stuck in indecision, hovering around the $1,975 mark. The market is anxiously awaiting two important factors: the release of the Federal Reserve’s meeting minutes and the extension of the US debt ceiling. These upcoming events have stirred some mixed feelings among traders, leading to a cautious mood. On the one hand, there are hawkish speculations about the Fed’s stance, which could weigh on gold prices.
On the other hand, hopes of avoiding a US default have supported the bearish sentiment surrounding gold. The recent decline in US Treasury bond yields and the US Dollar’s retreat due to the deadlock in debt ceiling negotiations have also influenced gold’s performance. The market sentiment remains sluggish as traders brace themselves for these critical events. Stay tuned, and keep an eye on how these factors unfold.
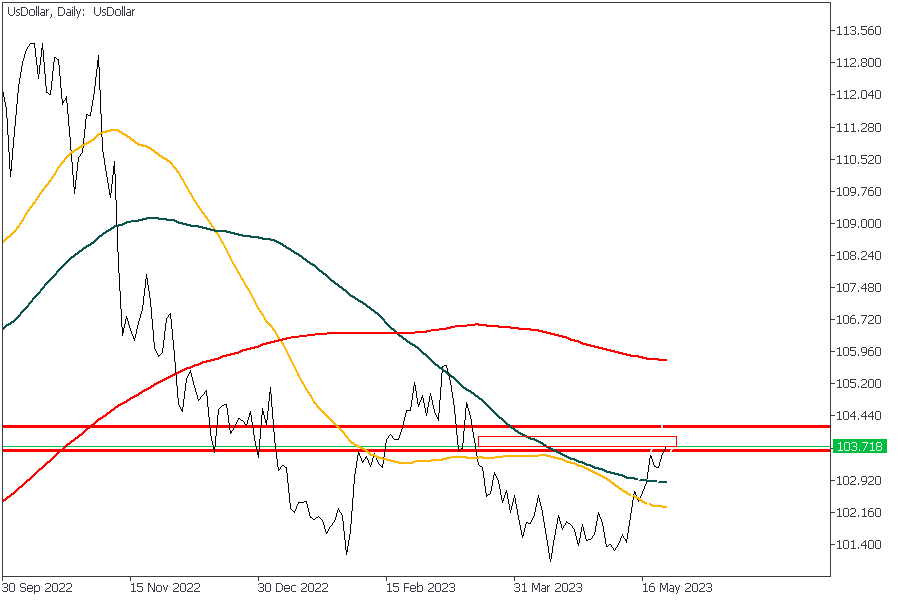
US Dollar – Daily Timeframe
The chart above is a line chart representing the price action on the US Dollar chart from the Daily timeframe. I have deliberately used the line chart because it is one of the easiest ways to figure out key levels of support and resistance and draw pivot zones. The pivot zone on the daily timeframe, as shown above, is based on the price levels with the most reactions. Let’s take a look at the candlestick chart for confirmation.
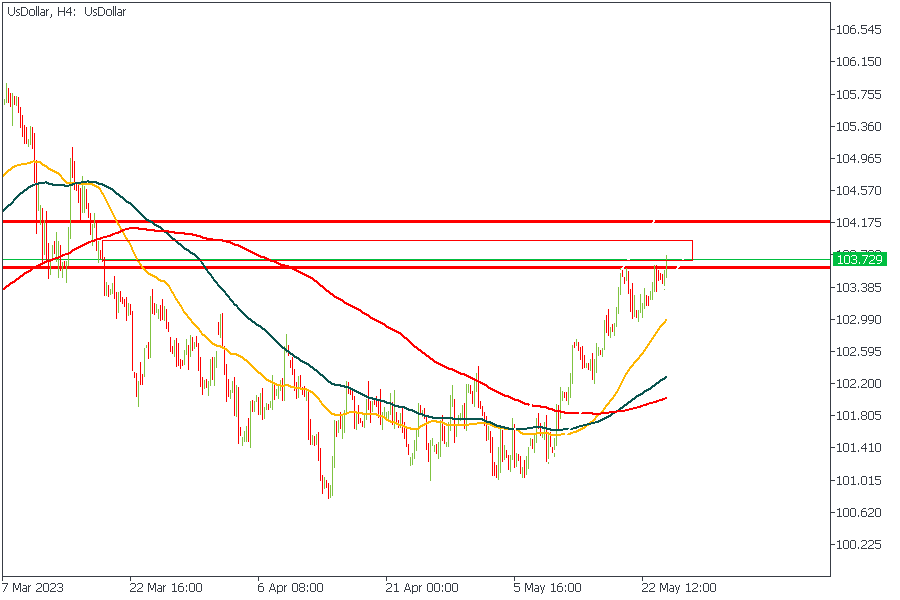
US Dollar – H4 Timeframe
From the price action on the H4 timeframe of the US Dollar, I could locate a drop-base-drop supply zone right in the middle of the pivot zone we marked earlier from the daily timeframe. Based on this criterion and the descending order of arrangement of the moving averages on the daily timeframe, I sense a likelihood of a bearish reaction from the marked zone. Now let’s see what impact this would likely have on the price of Gold (XAUUSD).
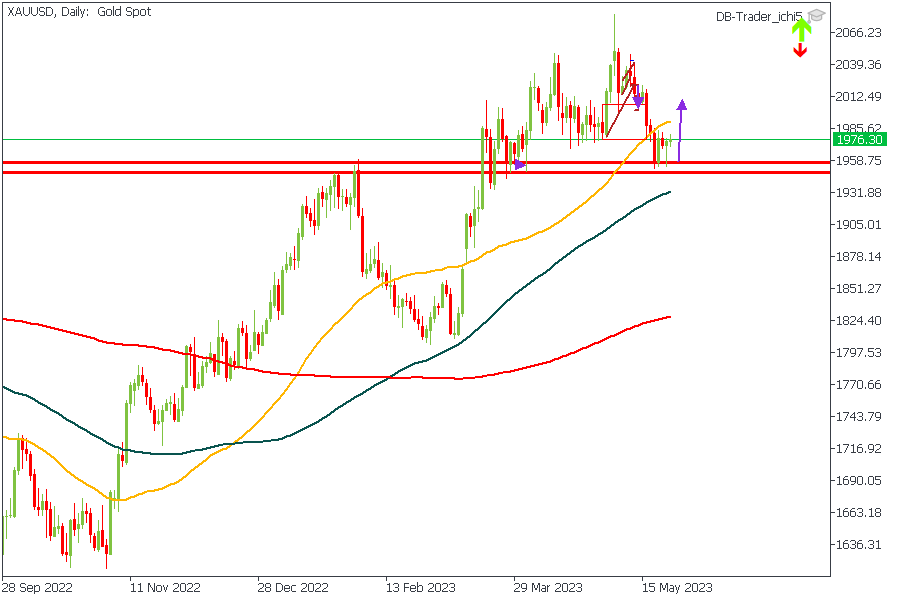
XAUUSD – Daily Timeframe
If the US Dollar comes under excessive bearish pressure from the areas I highlighted earlier, the outcome will lead to bullish price action on the Gold charts. The confirmations I have for this sentiment include; the pivot zone, ascending order of the moving averages array, and the drop-base-rally demand zone from the area marked with the horizontal arrow.
Analyst’s Expectations:
- Direction: Bullish
- Target: $2005.60
- Invalidation: $1953.74
CONCLUSION
The trading of CFDs comes at a risk. Thus, to succeed, you have to manage risks properly. To avoid costly mistakes while you look to trade these opportunities, be sure to do your due diligence and manage your risk appropriately.


