
In our recent article about USDCHF, we explained incomplete bearish sequence in USDCHF since October 2022 and December 2016 highs and explained that bounces should fail in 3, 7 or 11 swings for extension lower. Pair found sellers after three waves in the first blue box area and reacted lower to allow any sellers to eliminate risk on their shorts. However, pair failed to break below 05.04.2023 low and has now broken above the previous peak within the blue box which was reached on 05.18.2023. Let’s take a look at the current structure and the next extreme in today’s article.
USDCHF 4 Hour Elliott Wave Chart – 05.24.2023
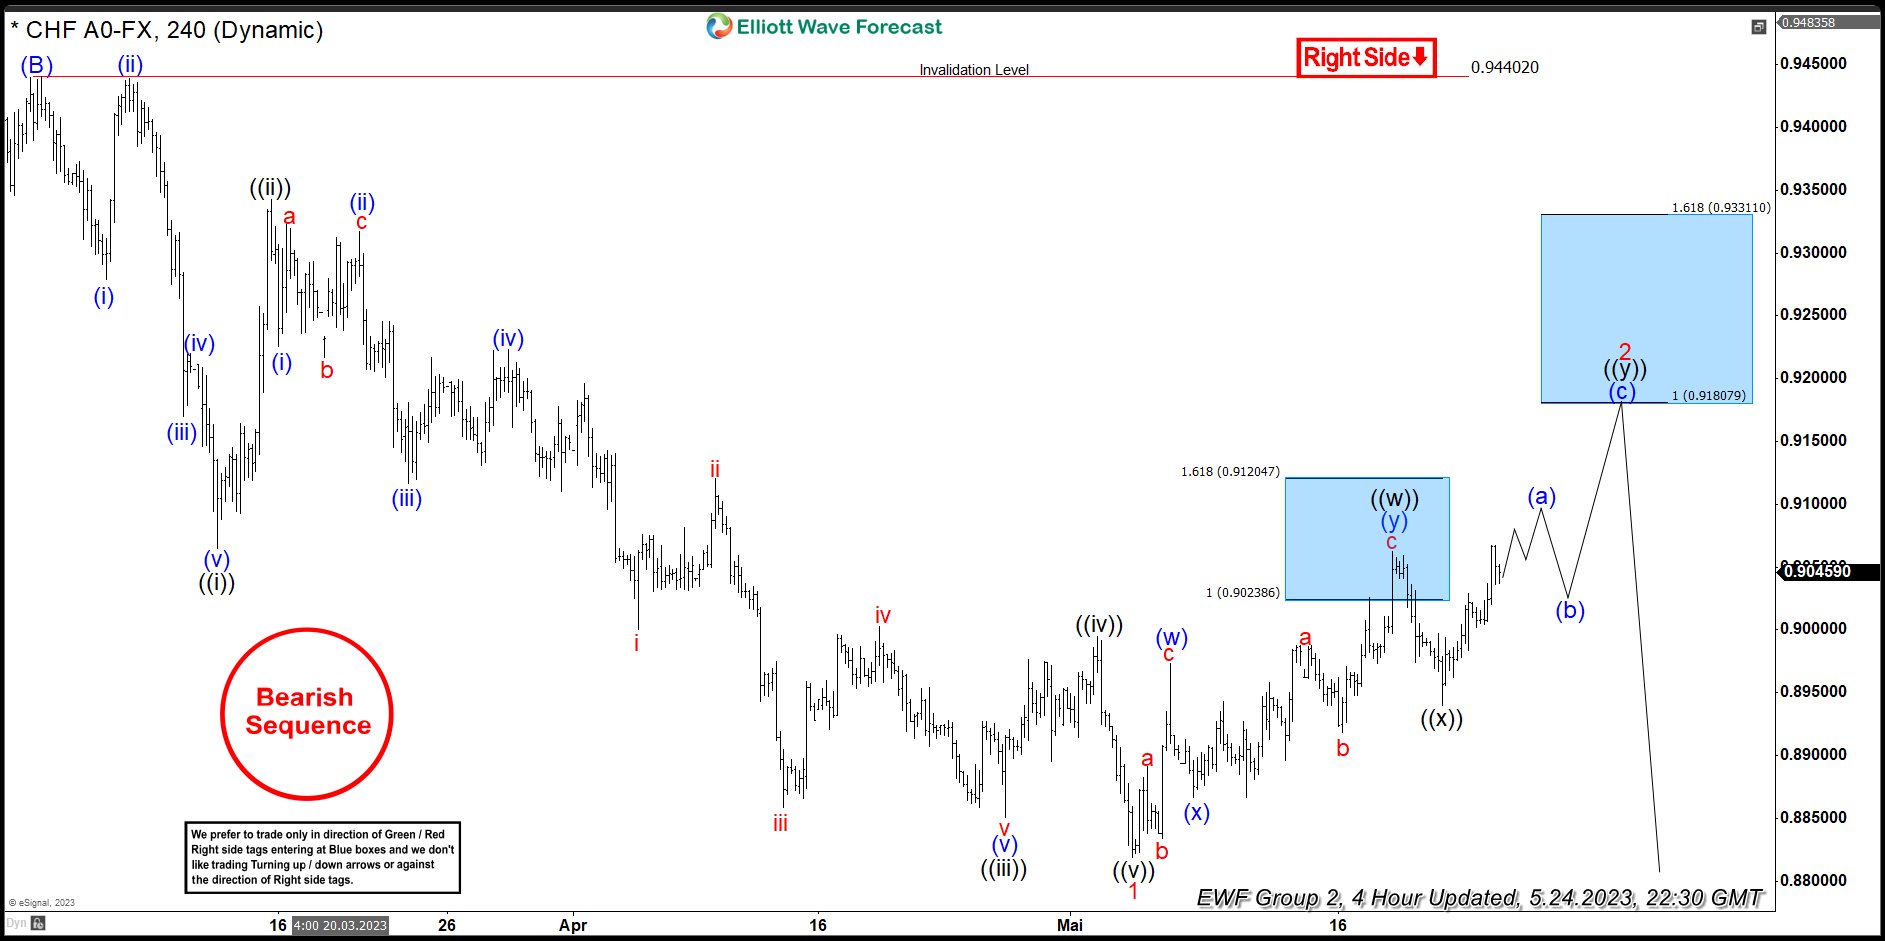
Chart above shows USDCHF cycle from 03.02.2023 ended as an impulsive Elliott wave structure and pair is now bouncing to correct the decline from 03.02.2023 peak at 0.94404. Pair completed a cycle from 05.04.2023 low (0.8819) at 05.18.2023 high (0.9062) and turned lower after sellers appeared in the blue box area between 0.9023 – 0.9120. Pair dropped from 0.9062 to 0.8940 (05.22.2023) which allowed sellers from blue box to eliminate risk on their shorts. However, it failed to get more downward momentum and didn’t manage to break below 05.04.2023 low. Instead the pair continue higher and it has now broken above 05.18.2023 (0.9062) high and has created yet another short-term incomplete sequence to the upside.
Near-term, expect some more upside toward 0.9087 – 0.9123 to complete the cycle from 05.22.2023 low i.e. black (( x )) before it pulls back to correct this cycle and turns higher again toward 0.9180 – 0.9331 to complete the larger double three structure since 05.04.2023 low. Area between 0.9180 – 0.9331 highlights the next extreme and the blue box area where we expect sellers to appear to resume the decline toward the double extreme area on the weekly chart between 0.8563 – 0.8189 or produce a reaction lower in three waves at least to allow sellers to get into a risk free position. like it did from the previous blue box area between 0.9023 – 0.9120.


