
Nasdaq 100 Technical: Squeezed Up Ahead of CPI and FOMC
- The mega-cap tech Nasdaq 100 resumed its daily outperformance over the S&P 500, DJIA, and Russell 2000.
- It closed at a 15-month high.
- 14,540 is the key short-term support to watch.
Fig 1: US Nas 100 medium-term trend as of 13 Jun 2023 (Source: TradingView, click to enlarge chart)
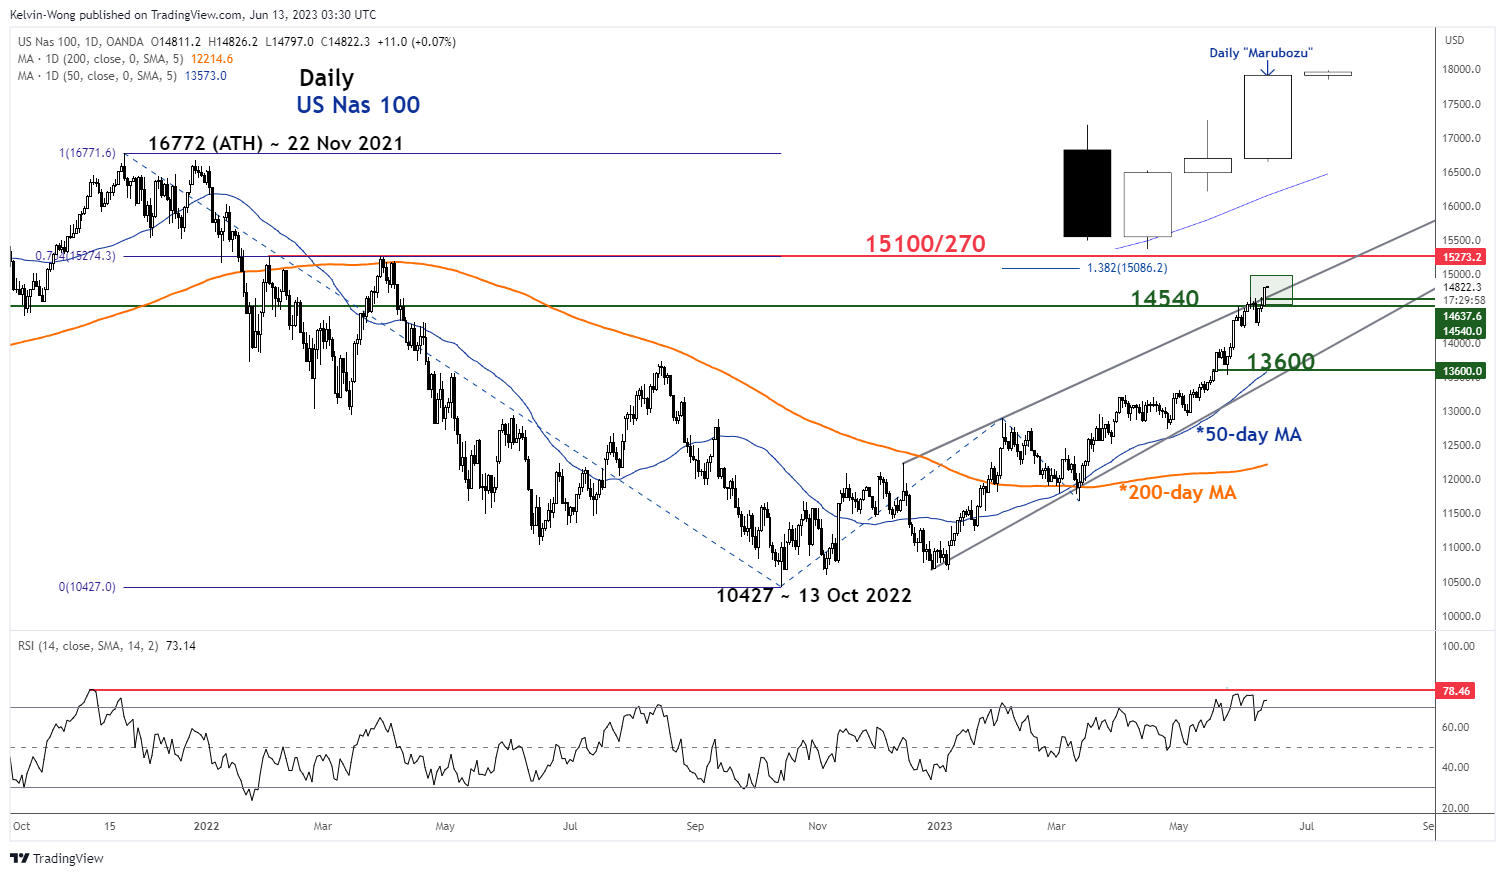
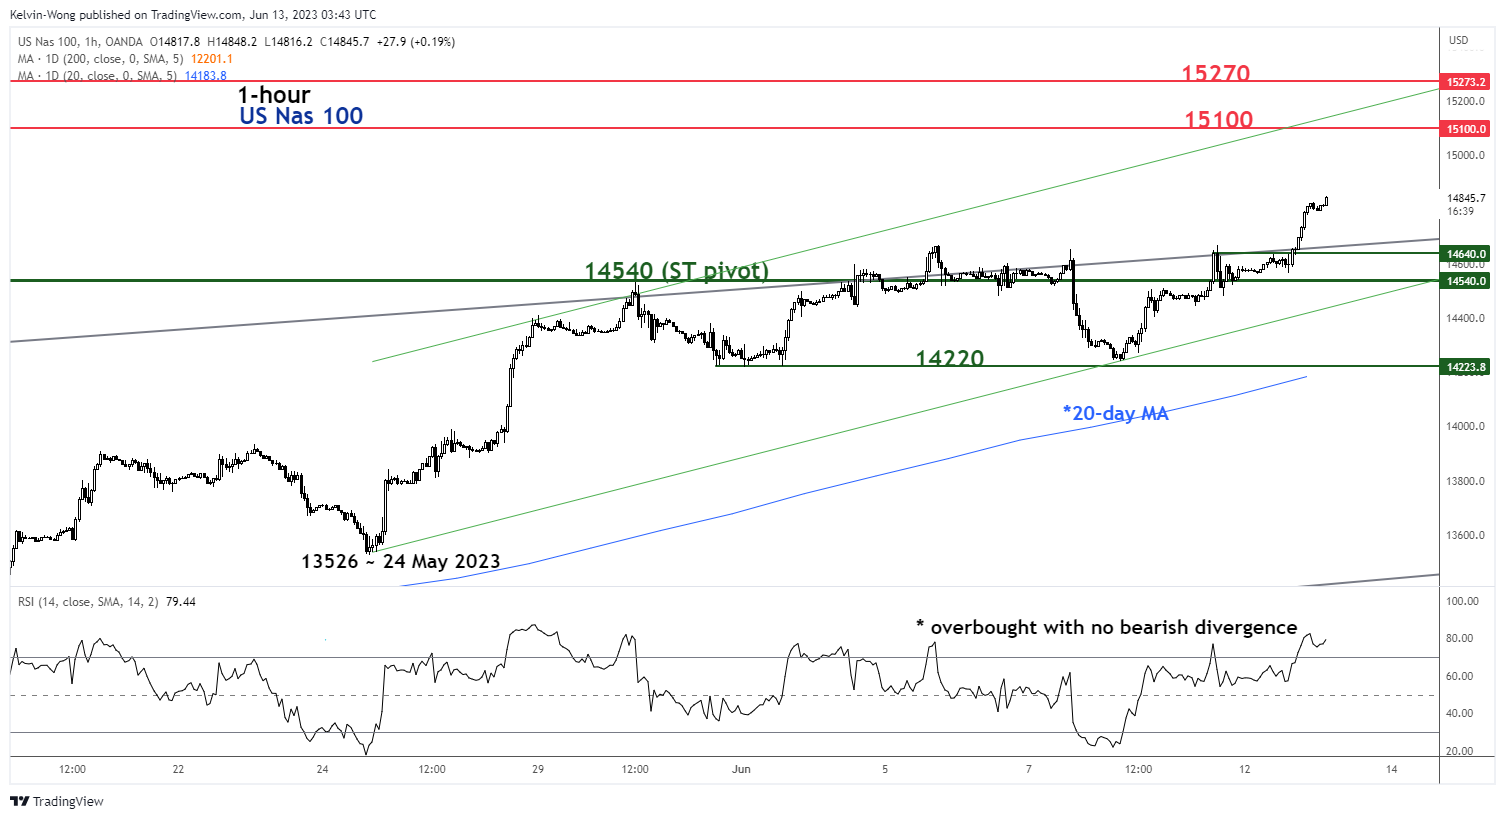
Fig 2: US Nas 100 short-term trend as of 13 Jun 2023 (Source: TradingView, click to enlarge chart)
Once again, the bullish tone of the Nasdaq 100 which is heavily concentrated in the mega-cap technology-related stocks such as Microsoft, Apple, Amazon, and NVIDIA resumed its outperformance yesterday, 12 June with a daily gain of +1.76% over the rest of the US benchmark indices; S&P 500 (+0.93%), Dow Jones Industrial Average (+0.56%), and Russell 2000 (+0.40%).
From a technical analysis perspective, momentum remains positive at least in the short-term.
Squeezed up and ended yesterday’s session with a daily bullish “Marubozu”
Price actions of the US Nas 100 (a proxy for the Nasdaq 100 futures) have managed to stage a breakout above the upper boundary of an impending “Ascending Wedge” that now turns into a near-term pull-back support at 14,540. Ended yesterday’s session, (12 June) with a daily bullish “Marubozu” candlestick pattern which suggests that the bullish camp controlled the price of the Index from the opening to the close of the day.
Short-term momentum remains positive
In the shorter-term horizon, as depicted on the 1-hour chart, the price actions of the Index have evolved within a minor ascending channel since the 24 May 2023 low of 13,526. In addition, the 1-hour RSI oscillator has just inched up into its overbought zone (above 70%) yesterday but without any bearish divergence signal yet. These observations suggest that short-term upside momentum remains intact.
14,540 key short-term pivotal support to maintain the bullish tone with next intermediate resistances coming in at 15,100 and 15,270; defined by a confluence of elements (the medium swing high areas of 2 February/29 March 2022, the upper boundary of the minor ascending channel & a Fibonacci retracement/extension cluster).
On the flip side, failure to hold above 14,540 exposes the next support at 14,220 (also the 20-day moving average).


, Dow Jones Industrial Average (+0.56%), and Russell 2000 (+0.40%).)