
Gold Technical: Potential Breakdown to Resume Short-Term Downtrend
- In the past 3 weeks, Gold (XAU/USD) has been evolving with a minor “Descending Triangle” with its range support at US$1,940.
- Price actions have failed to surpass the 50-day moving average now acting as a resistance at US$1,991.
- Short-term downtrend phase from the 4 May 2023 high remains intact.
Fig 1: Gold (XAU/USD) major trend as of 13 Jun 2023 (Source: TradingView, click to enlarge chart)
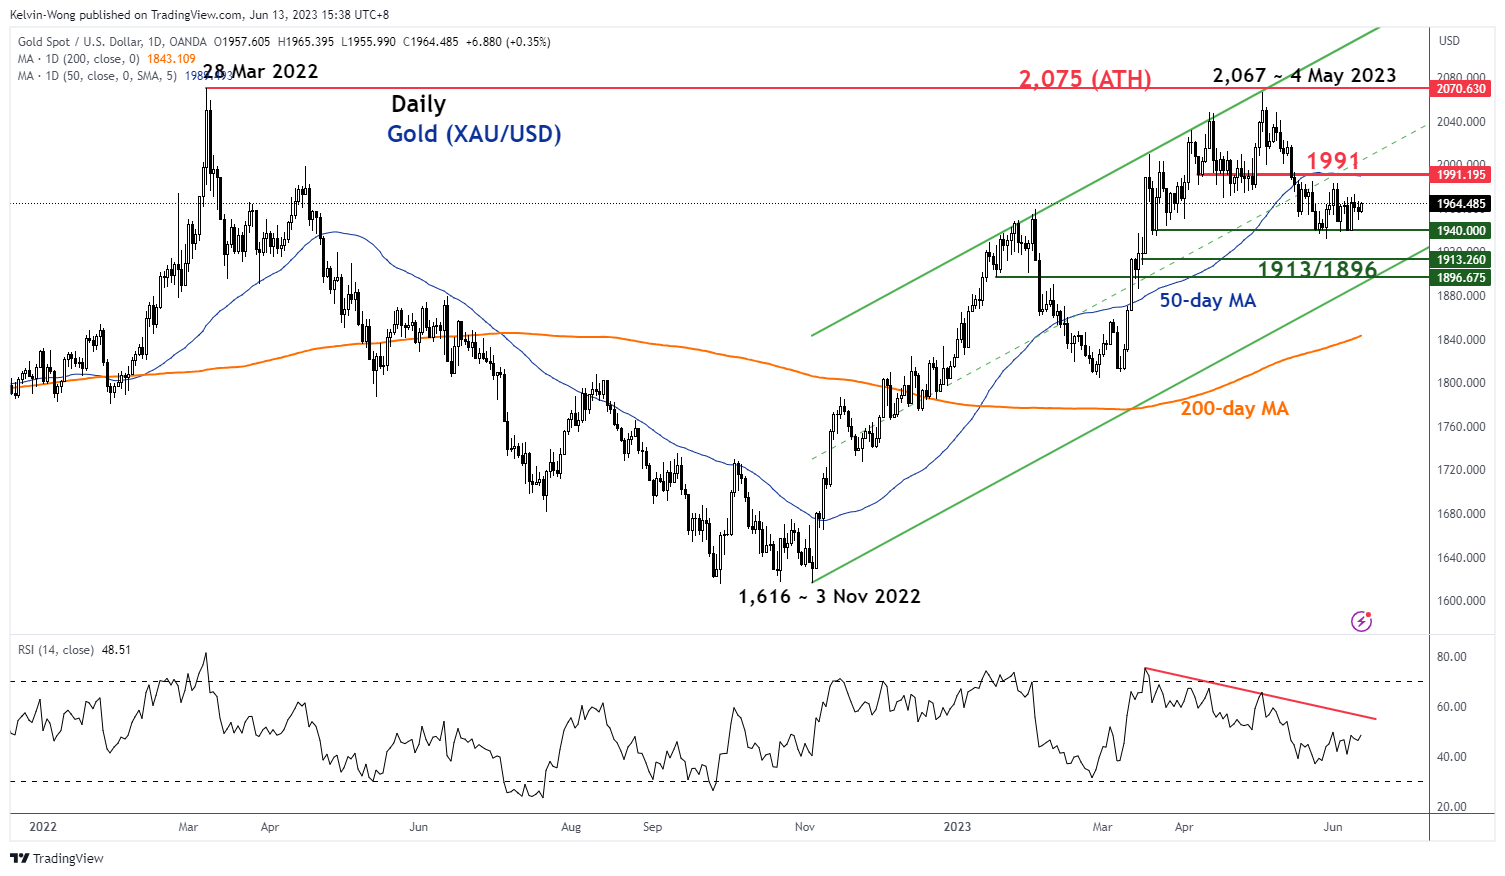
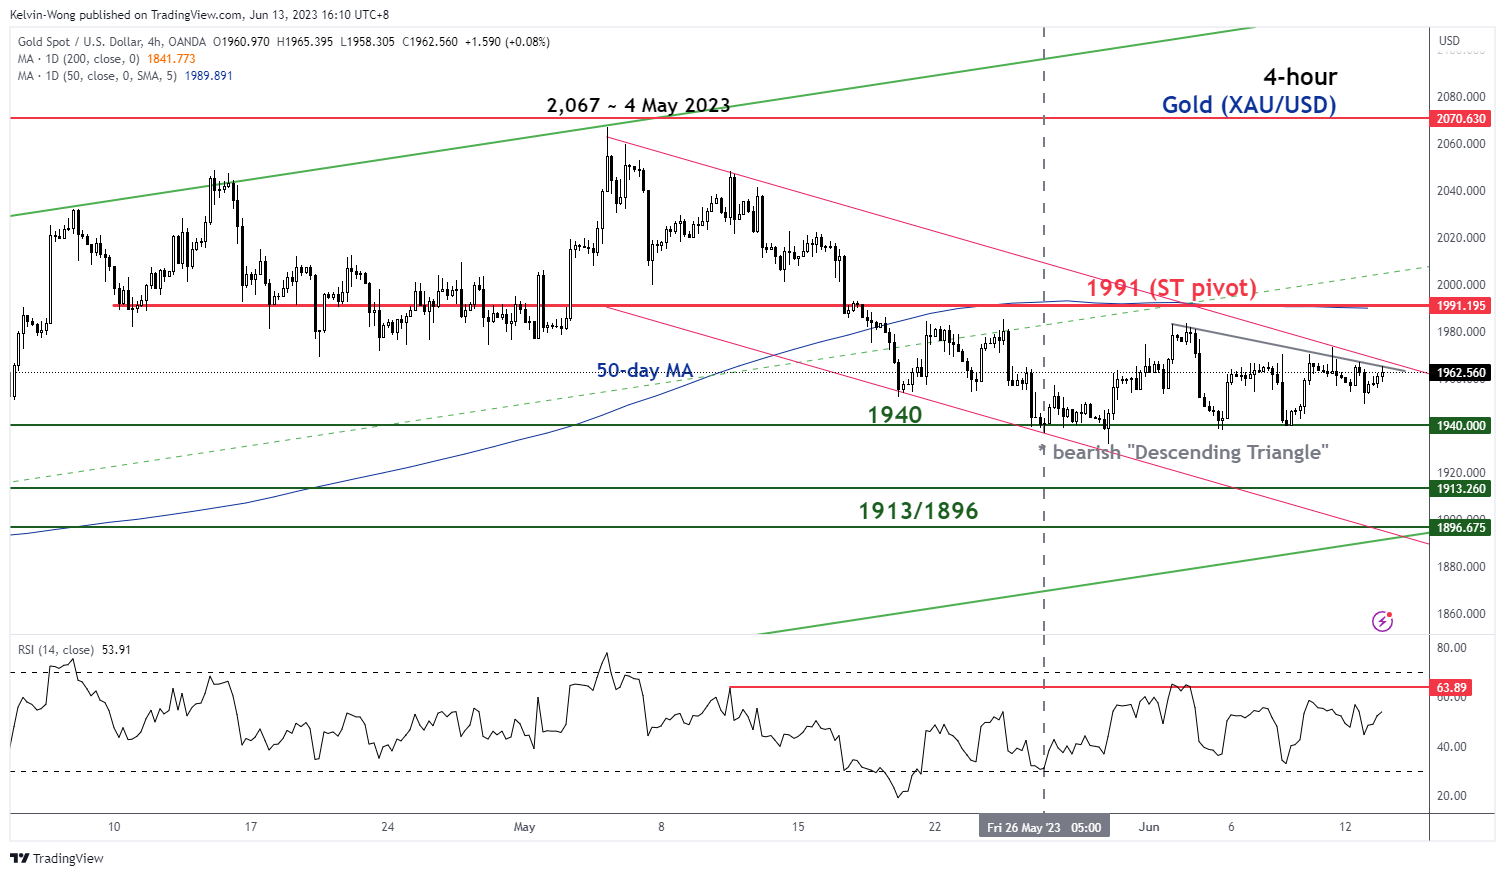
Fig 2: Gold (XAU/USD) short-term trend as of 13 Jun 2023 (Source: TradingView, click to enlarge chart)
This is a follow-up to our previous analysis, “Gold Technical – a potential short-term downtrend in play” published on 22 May 2023.
The price actions of Gold (XAU/USD) have declined by -2.2% since 22 May and hit the support of US$1,940 on 26 May.
Sideways within a bearish “Descending Triangle” range configuration in the past 3 weeks
Since the test on its US$1,940 support on 26 May 2023, Gold (XAU/USD) has traded sideways and retested US$1,940 on three occasions within the past 3 weeks. The price reactions that bounced off the US$1,940 support have been lacklustre as they formed “lower highs” which gave rise to the formation of a bearish “Descending Triangle” range configuration (refer to the 4-hour).
Minor short-term downtrend phase from the 4 May 2023 high remains intact
Since its 4 May 2023 high of US$2,067 (also its current 52-week high), Gold (XAU/USD) has been evolving within a short-term downtrend phase within a major uptrend phase in place since 3 November 2022 low of US$1,616 (see daily chart)
US$1,991 remains the key short-term pivotal resistance to maintain the short-term bearish tone and a break below the minor “Descending Triangle” range support of US$1,940 exposes the medium-term support zone of US$1,913/1,896 (also the lower boundary of the major ascending channel from 3 November 2022 low).
However, a clearance above US$1,991 sees the next resistance coming in at US$2,067/2,075.


 have declined by -2.2% since 22 May and hit the support of US$1,940 on 26 May.)