
- Yesterday’s price action of Nasdaq 100 has reintegrated back below the upper limit of the “Ascending Wedge” with a bearish breakdown below its daily RSI momentum indicator.
- Short-term momentum is still bearish as the Index has broken below the 20-day moving average which has also turned flat.
- 14,980 is the key short-term resistance to watch.
This is a follow-up on our prior analysis “Nasdaq 100 Technical: Squeezed up ahead of CPI and FOMC” published on 13 June 2023. It rallied and hit the key 15,100/270 resistance zone as expected.
Interestingly, after the Nasdaq 100, the top performer among the benchmark US stock indices (recorded a year-to-date return of +36.12% as of 23 June 2023) hit the 15,270 key medium-term pivotal resistance (printed on intraday high of 15,285 on 16 June 2023), it shed a weekly loss of -1.28% for the week of 20 June 2023 which was its worst weekly loss in around three months.
At the risk of forming a medium-term blow-off top
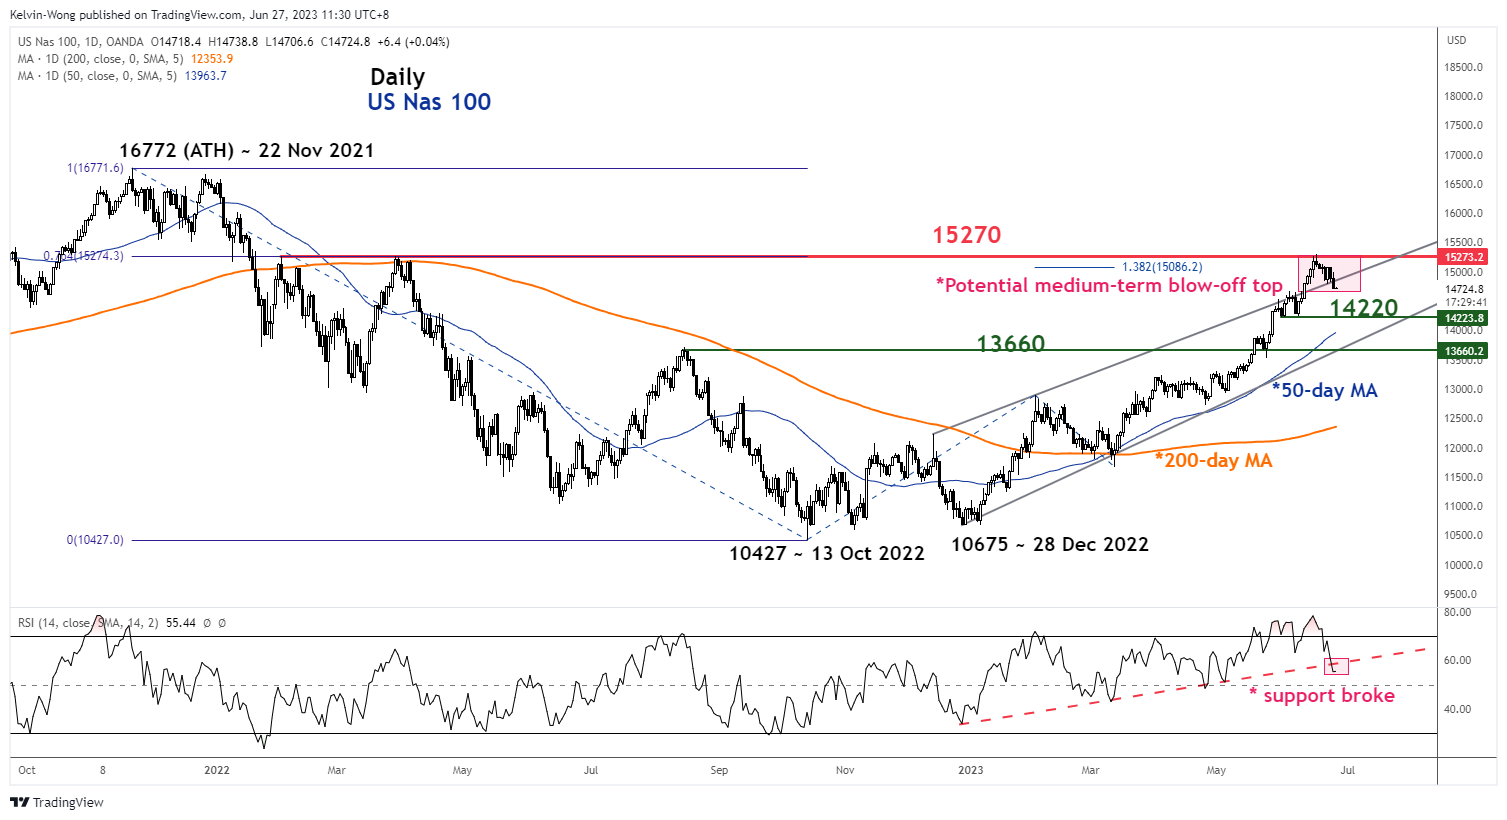
Fig 1: US Nas 100 medium-term trend as of 27 Jun 2023 (Source: TradingView, click to enlarge chart)
The recent price actions of the US Nas 100 (a proxy for the Nasdaq 100 futures) has reintegrated back below the upper limit of the bearish “Ascending Wedge” configuration yesterday, 26 June, and had a daily below it which indicates that the prior break above this upper limit on 12 June is considered as a failure bullish breakout (see daily chart).
In addition, the daily RSI oscillator has broken below its key corresponding ascending trendline support at the 58 level which suggests that medium-term momentum may have turned bearish that in turn reinforces the potential medium-term blow-off view.
The key medium-term support to watch will be at 13,660 (lower limit of the “Ascending Wedge”, 50-day moving average, former swing high area of 15 August 2022 & close to the 38.2% Fibonacci retracement of the up move from 28 December 2022 low to 16 June 2023).
Short-term momentum remains bearish
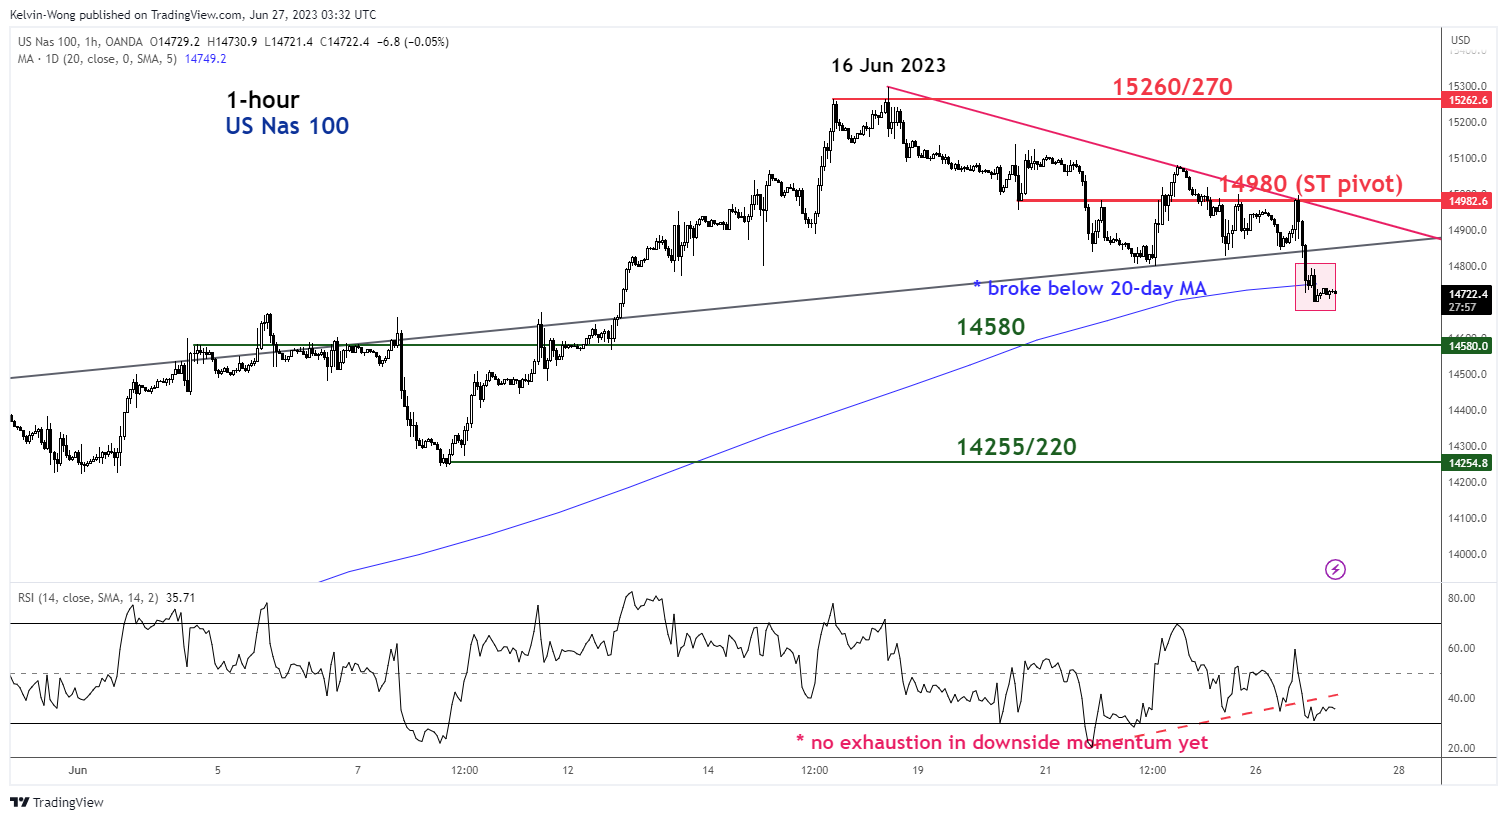
Fig 2: US Nas 100 short-term minor trend as of 27 Jun 2023 (Source: TradingView, click to enlarge chart)
Price actions of the Index have broken below the 20-day moving average that has started to turn flat (see 1-hour chart). The hourly RSI oscillator has continued to inch downwards towards the oversold level of below 30 but no bullish divergence signal yet.
Watch the 14,980 key short-term pivotal resistance and a break below 14,580 support exposes the next support at 14,255/220.
On the flip side, a clearance above 14,980 negates the bullish tone to see a retest on the 15,260/270 key medium-term resistance.


 hit the 15,270 key medium-term pivotal resistance (printed on intraday high of 15,285 on 16 June 2023), it shed a weekly loss of -1.28% for the week of 20 June 2023 which was its worst weekly loss in around three months.)