
- The +326 pips rebound seen in the USD/JPY from the 14 July 2023 low of 137.24 has reached a minor key inflection point.
- Short-term momentum (hourly RSI) has turned bearish.
- 60 is the key short-term resistance to watch.
The USD/JPY has staged the expected corrective rebound after a test on the 200-day moving average and hit the 139.70/140.10 resistance zone as highlighted in our previous report. It printed an intraday high of 140.50 during yesterday, 20 July US session.
Japan’s nationwide inflation for June came in within expectation
Considering today’s Asian morning release of Japan’s nationwide inflation data for June that came in within expectation, remained sticky, and elevated at a 32-year high, the USD/JPY has ticked down by -75 pips from yesterday’s US session high to today’s Asian session current intraday low of 139.75 at this time of the writing.
Japan’s core inflation (excluding fresh food) came in at 3.30% year-on-year, above May’s reading of 3.20%. Core-core inflation (excluding fresh food & energy) rose to 4.2% year-on-year, slightly below the 4.3% recorded in May.
From a technical analysis standpoint, the +326 pips rebound from the 137.24 swing low of 14 July 2023 has started to show signs of bullish exhaustion which indicates a potential continuation of its short-term downtrend phase from 30 June 2023 high of 145.07.
Short-term momentum has turned bearish
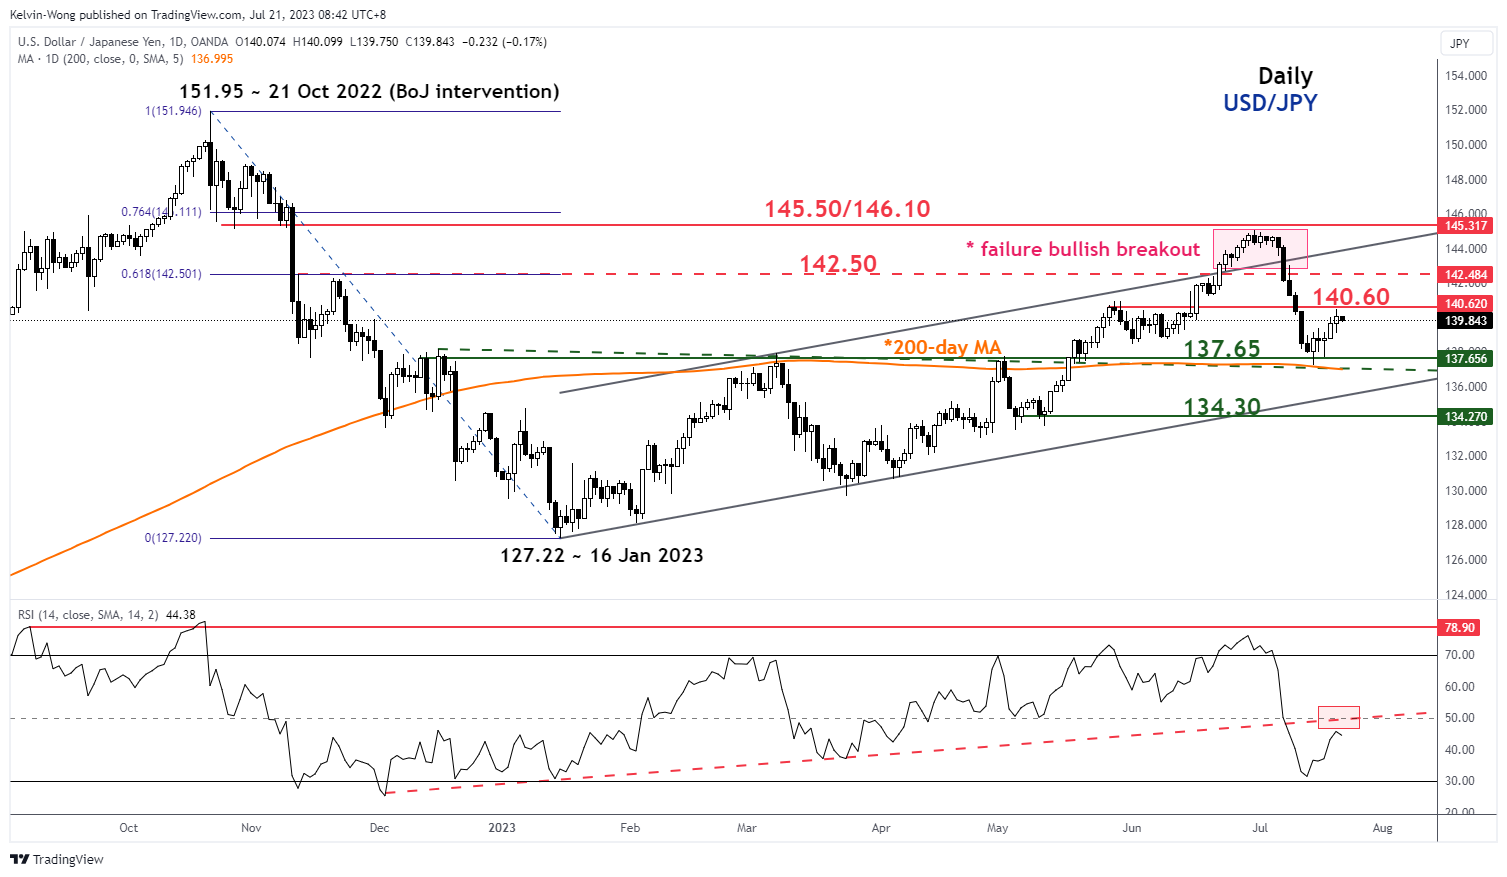
Fig 1: USD/JPY medium-term trend as of 21 Jul 2023 (Source: TradingView, click to enlarge chart)
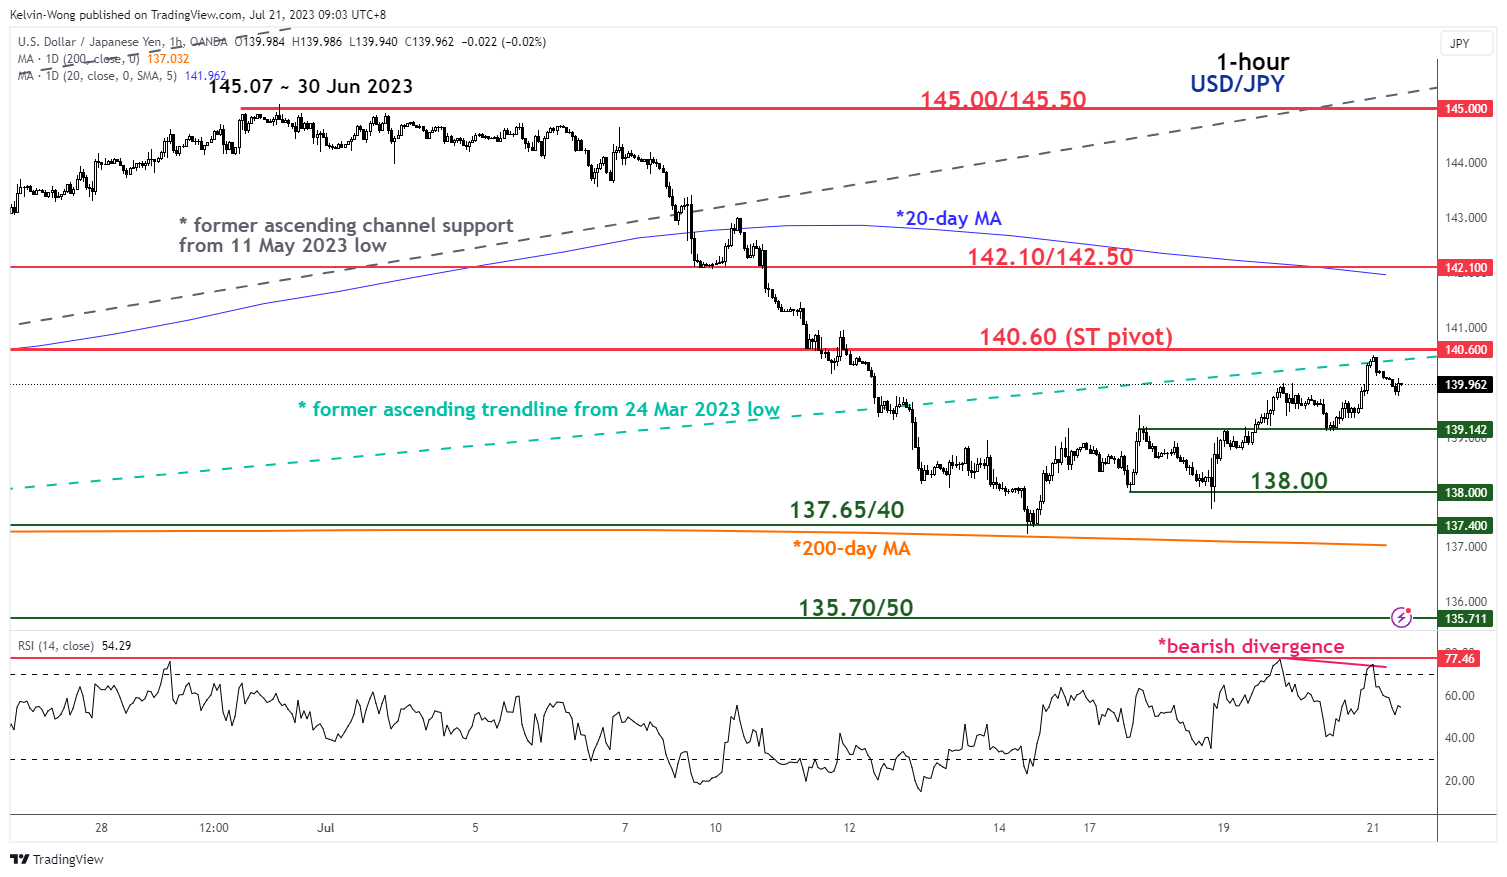
Fig 2: USD/JPY minor short-term trend as of 21 Jul 2023 (Source: TradingView, click to enlarge chart)
The hourly RSI oscillator has flashed a bearish divergence signal at its overbought region which indicates the minor up move from the 14 July 2023 low to 21 July 2023 high has started to lose upside momentum.
This negative observation in momentum occurred when the price actions of USD/JPY retested its former medium-term ascending trendline support from the 24 March 2023 low during yesterday’s 20 July US session (see 1-hour chart).
Watch the 140.60 short-term pivotal resistance and a break below 139.15 exposes the next near-term supports of 138.00, and 137.65/40 in the first step.
On the other hand, a clearance above 140.60 negates the bearish tone to see the key medium-term resistance zone of 142.10/50 (20-day moving average & the 61.8% Fibonacci retracement of the prior down move from the 30 June 2023 high to 14 July 2023 low).


