
- Last week, Nasdaq 100 underperformed against the other major US stock indices.
- Nasdaq 100 failed to have a weekly close above 15,690 key medium-term resistance and ended with a weekly bearish “Shooting Star” candlestick pattern.
- Key near-term support will be at 15,270 (20-day moving average).
Last week, the year-to-date highly flying technology-concentrated Nasdaq 100 underperformed with a weekly loss of -0.90% versus weekly gains seen in other major US stock indices; S&P 500 (+0.69%), Dow Jones Industrial Average (+2.08%), and Russell 2000 (+1.51%).
The underperformance of the Nasdaq 100 has been caused by the “Magnificent Seven” cohort with weekly losses seen in Telsa (-7.59%), Alphabet (-4.30%), Meta (-4.73%), Amazon (-3.48%), and Nvidia (-2.55%).
Nasdaq 100 failed to have a weekly close above 15,690 key medium-term resistance
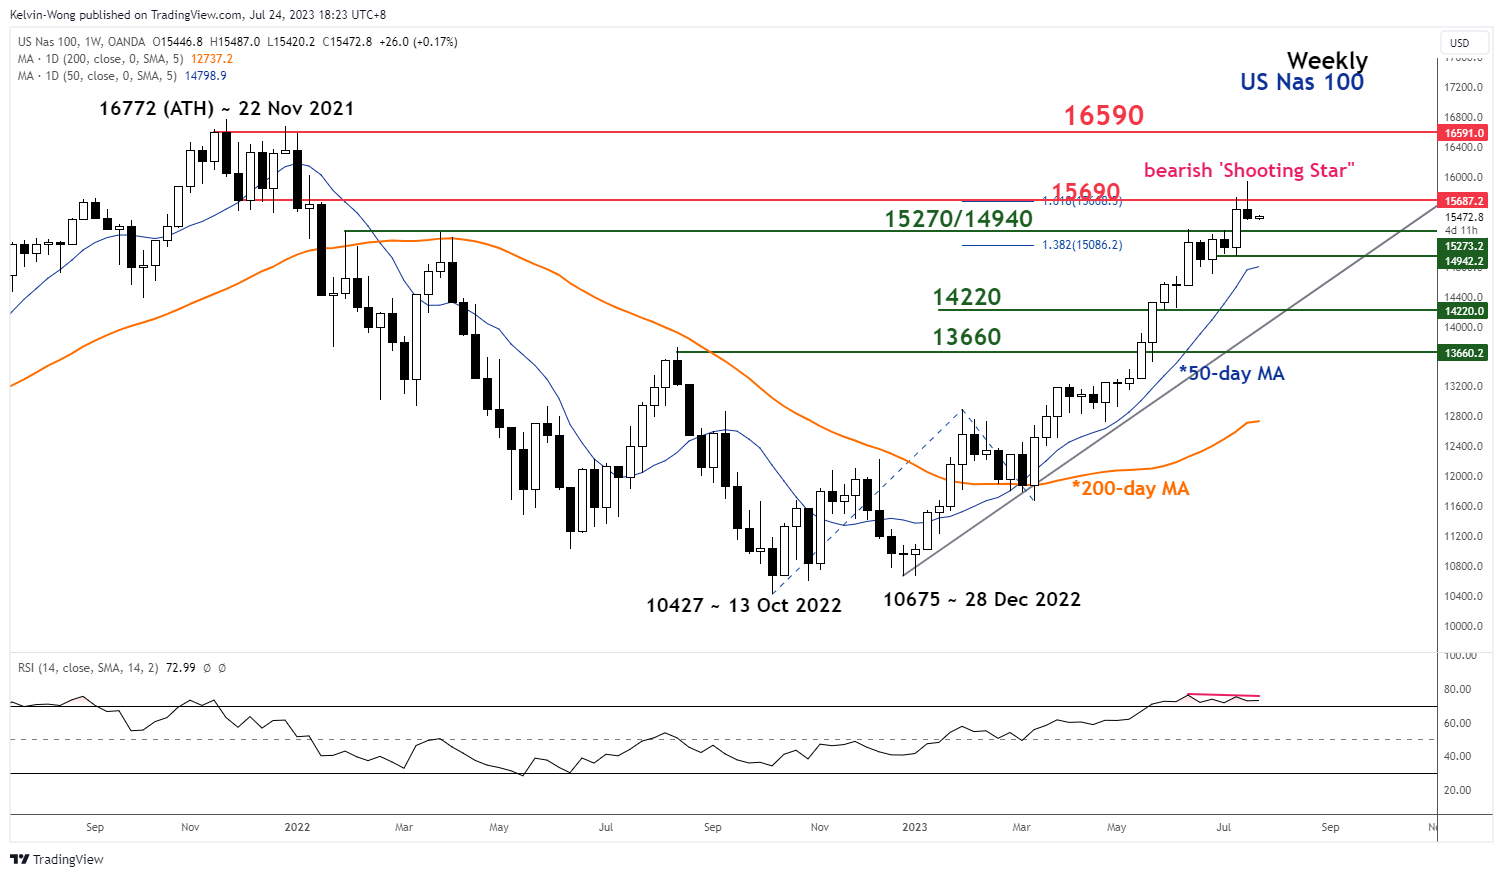
Fig 1: Nasdaq 100 major trend as of 24 Jul 2023 (Source: TradingView, click to enlarge chart)
The initial price actions of the US Nas 100 Index (a proxy for the Nasdaq 100 futures) breached above the 15,690 key medium-term resistance in the first half of last week but reintegrated below it last Thursday, 20 July, and failed to have a weekly close above 15,690.
In addition, it has formed a weekly bearish “Shooting Star” candlestick pattern which indicates that the bullish sentiment of the medium-term up move in place since the March 2023 low is likely to be exhausted (see weekly chart).
Also, the weekly RSI oscillator has traced out a bearish divergence signal at its overbought region which suggests medium-term and major upside momentum has started to wane. These observations increase the risks of a potential multi-week corrective decline below 15,690.
Price actions evolved into a minor downtrend phase
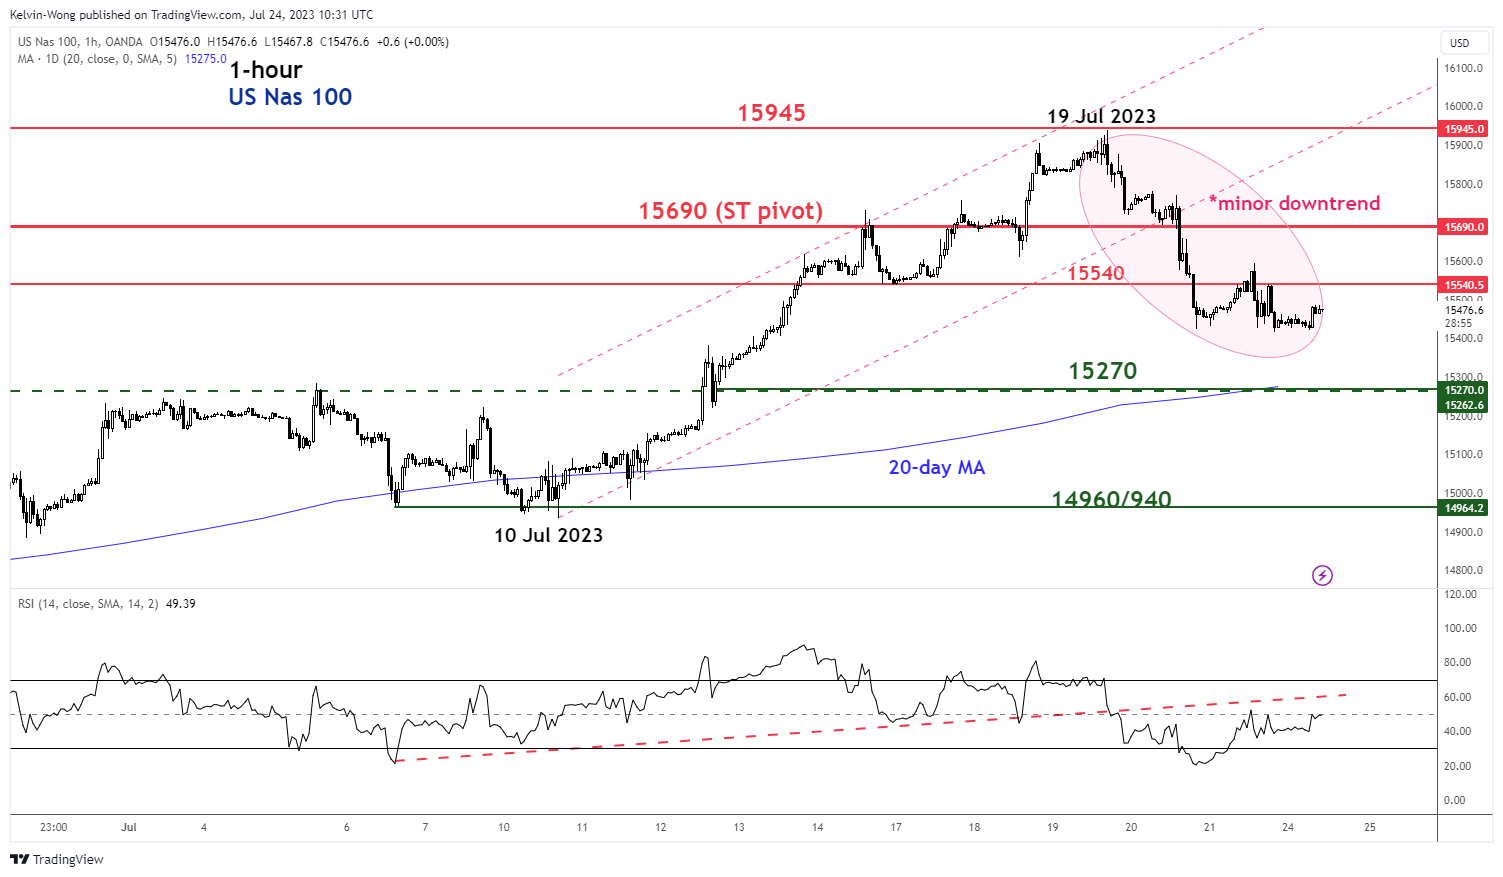
Fig 2: Nasdaq 100 minor short-term trend as of 24 Jul 2023 (Source: TradingView, click to enlarge chart)
Since its 19 July 2023 intraday high of 15,937, the price actions of the Index have traced out a series of “lower highs and lower lows” which indicate a minor downtrend phase is in progress.
Watch the 15,690 key pivotal resistance to maintain the minor downtrend with the next near-term support coming in at 15,270 (also the 20-day moving average).
However, a clearance above 15,690 negates the bearish tone to see the next resistance at 15,945.


, Dow Jones Industrial Average (+2.08%), and Russell 2000 (+1.51%).)