
DXY:
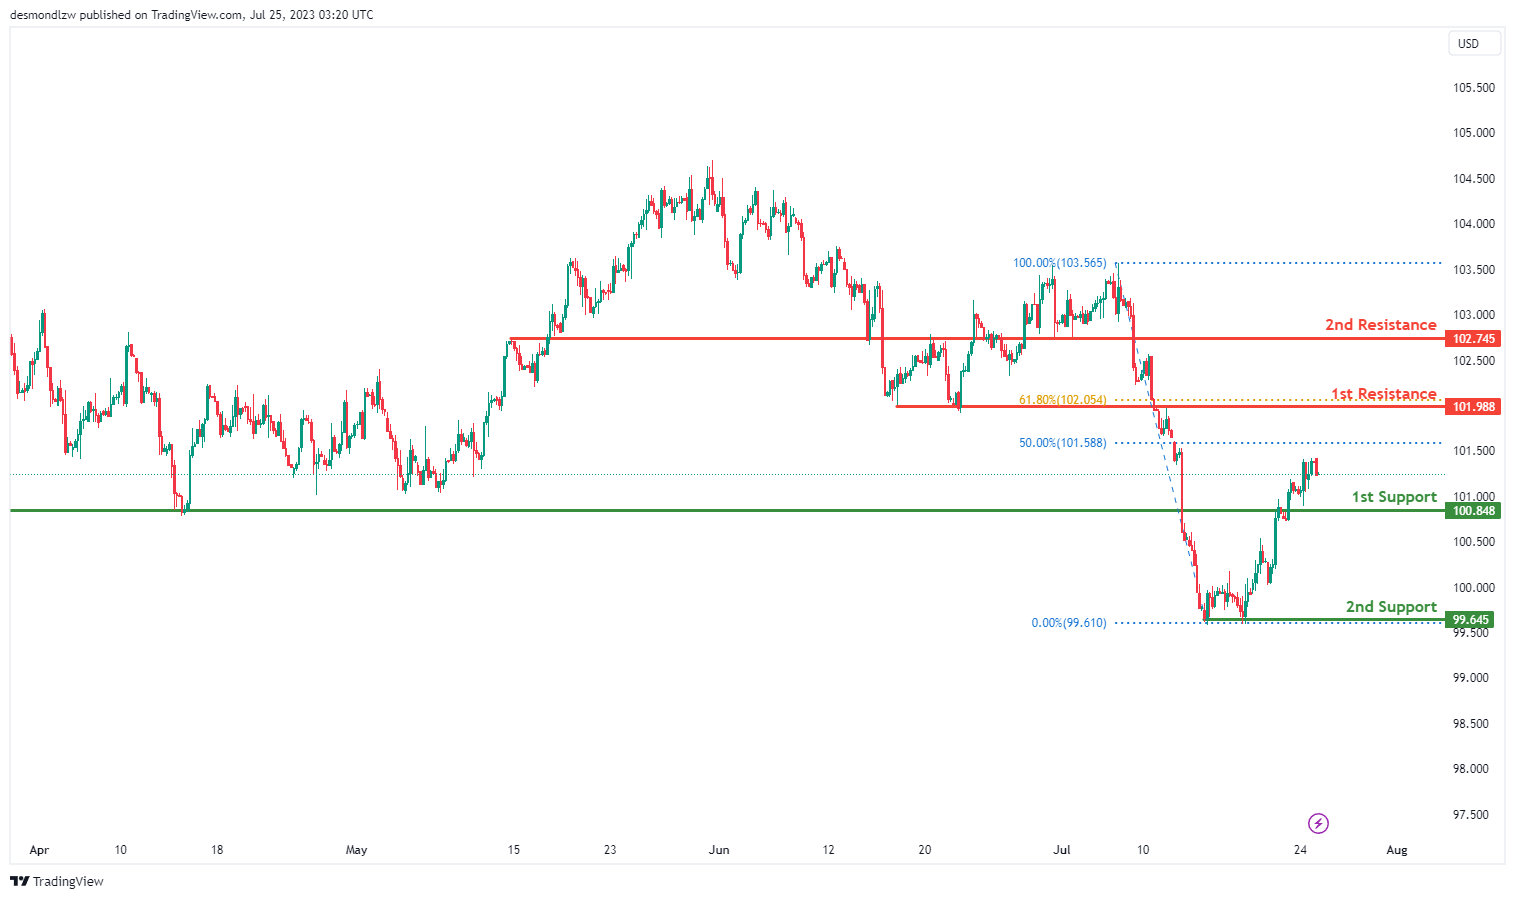
The DXY chart indicates a bullish momentum, suggesting a potential bullish continuation towards the 1st resistance level at 101.98. This resistance level is identified as an overlap resistance and coincides with the 61.80% Fibonacci retracement.
In case of a downward move, the 1st support at 100.84, an overlap support, may act as a significant level of backing. Additionally, the 2nd support at 99.64 represents a multi-swing low support.
On the upside, the 2nd resistance at 102.74 is recognized as a pullback resistance. These support and resistance levels play a crucial role in determining the potential price movement.
EUR/USD:
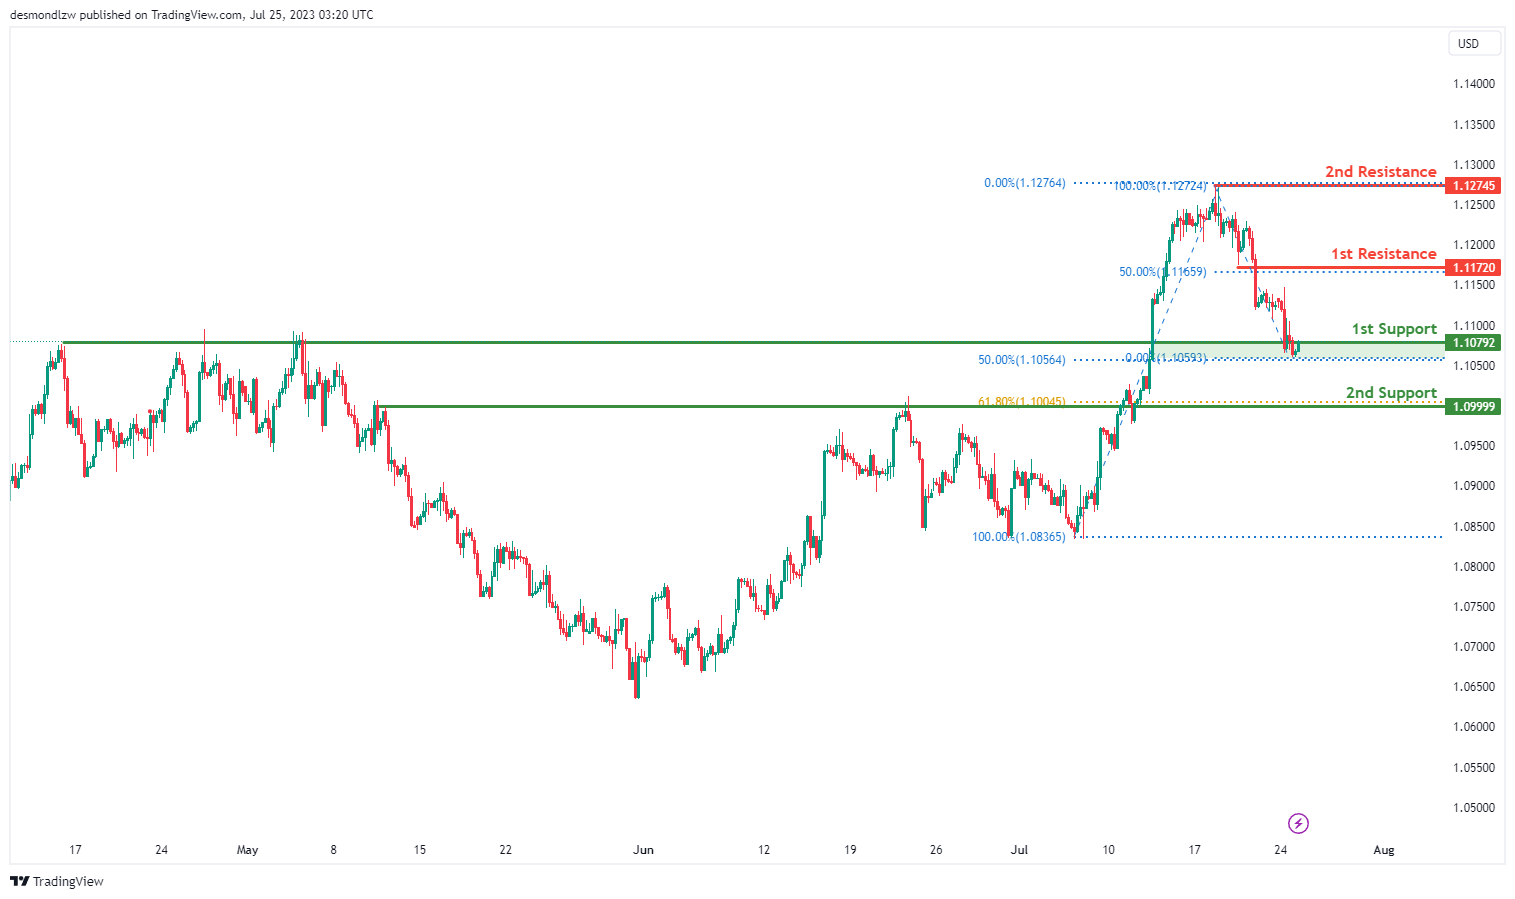
The EUR/USD chart exhibits a bullish momentum, indicating a potential bullish bounce off the 1st support level at 1.1079, aligned with the 50% Fibonacci retracement. This may lead the price towards the 1st resistance at 1.1172, which represents a pullback resistance also coinciding with the 50% Fibonacci retracement.
Furthermore, the 2nd support at 1.0999 acts as another pullback support, corresponding to the 61.80% Fibonacci retracement. On the upside, the 2nd resistance at 1.1274 is recognized as a significant swing high resistance. These support and resistance levels play crucial roles in potential price movements.
EUR/JPY:
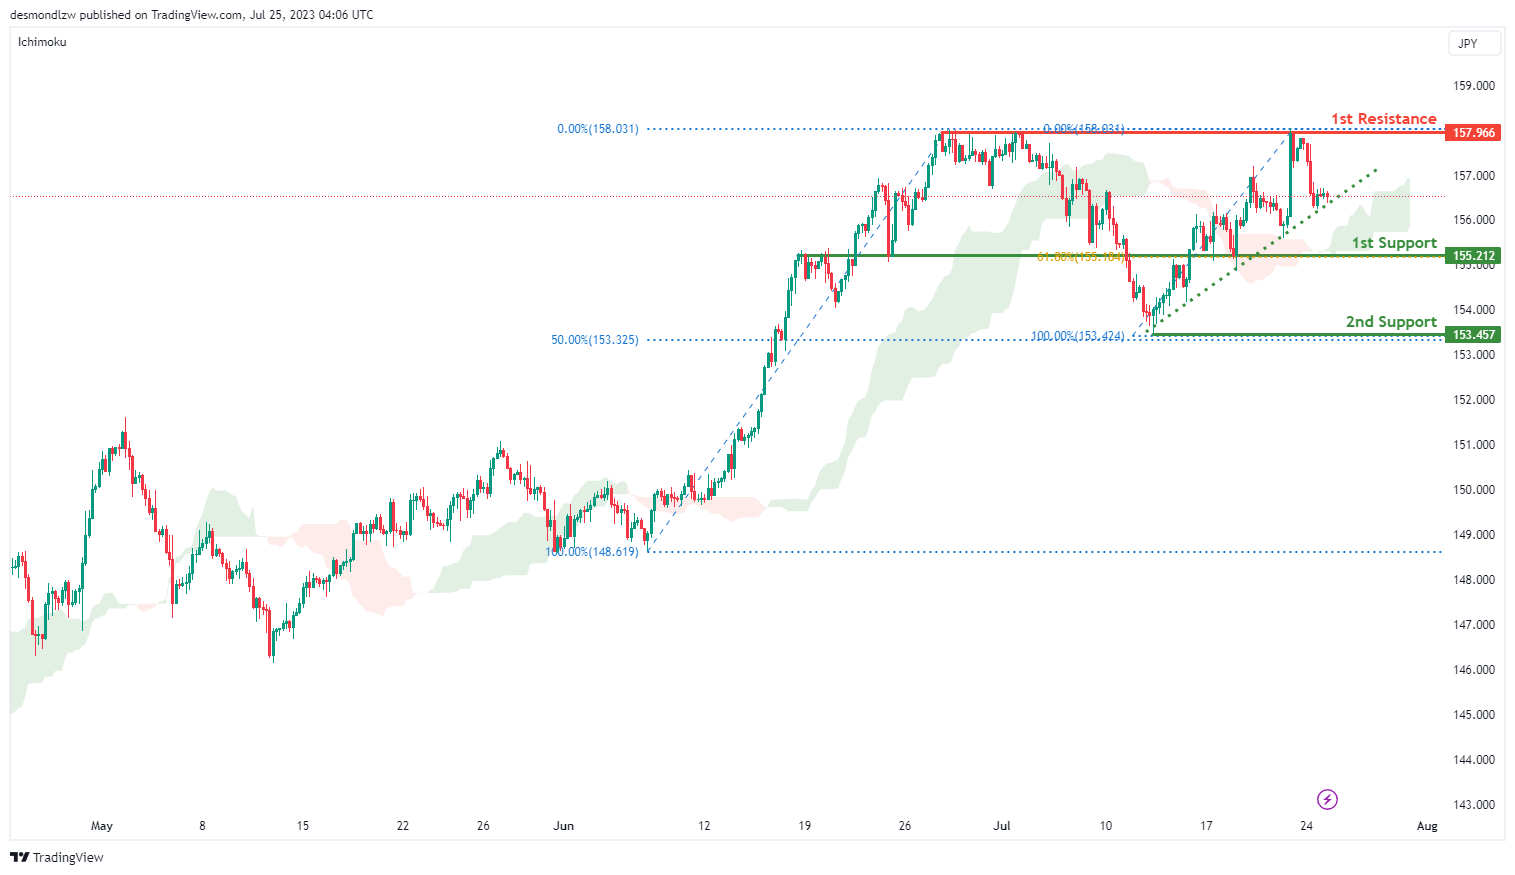
The EUR/JPY chart currently displays a bullish momentum, predominantly because the price is above the bullish Ichimoku cloud, suggesting further potential bullish continuation towards the 1st resistance level.
The 1st support level is situated at 155.21, corresponding with an overlap support and the 61.80% Fibonacci retracement level. This could potentially mark a significant point of buying interest, which could stimulate upward price movements.
Meanwhile, the 2nd support level stands at 153.45, and it coincides with a swing low support and the 50% Fibonacci retracement level. This might serve as another area of potential buying interest.
On the other hand, the 1st resistance level is positioned at 157.96, indicating a multi-swing high resistance. This could possibly apply significant selling pressure, potentially halting or reversing the upward price trajectory.
EUR/GBP:
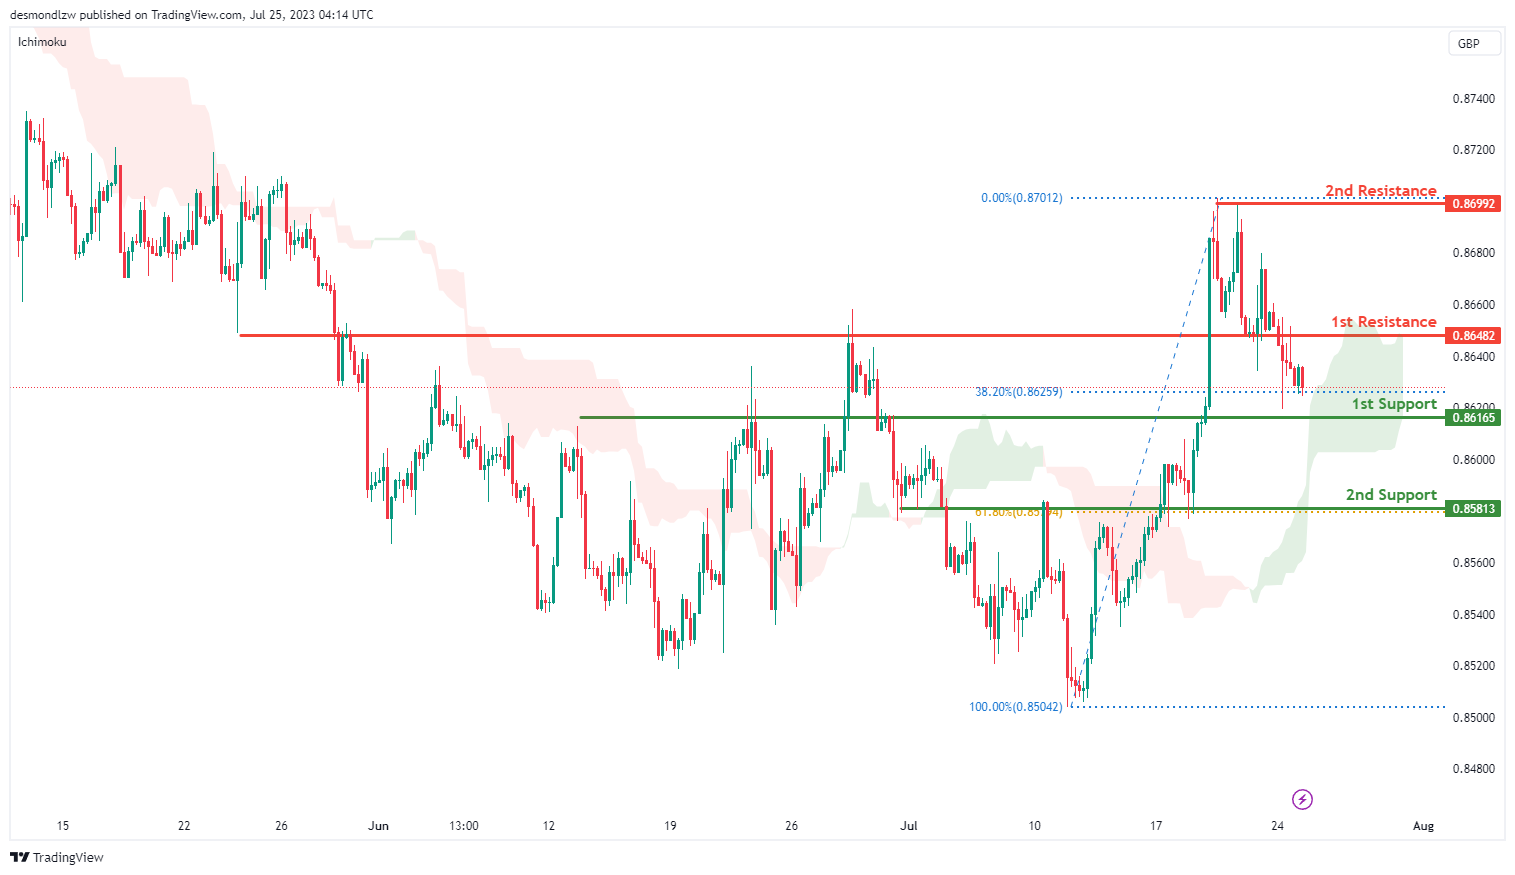
The EUR/GBP chart is currently showing a bullish momentum. This is largely due to the price being above the bullish Ichimoku cloud, suggesting a potential bullish bounce off the 1st support and a consequent rise towards the 1st resistance.
The 1st support level is at 0.8616 and is significant as an overlap support, along with being a 38.20% Fibonacci retracement level. This could possibly denote a point of buying interest, causing a price bounce and upward movement.
The 2nd support level is situated at 0.8581. As an overlap support and a 61.80% Fibonacci retracement level, it could serve as another potential area of buying interest.
On the flip side, the 1st resistance level is at 0.8648, denoting an overlap resistance. This could potentially be a point of selling pressure, likely halting upward price progression.
The 2nd resistance level, at 0.8699, represents a swing high resistance and could serve as an additional barrier for price ascent.
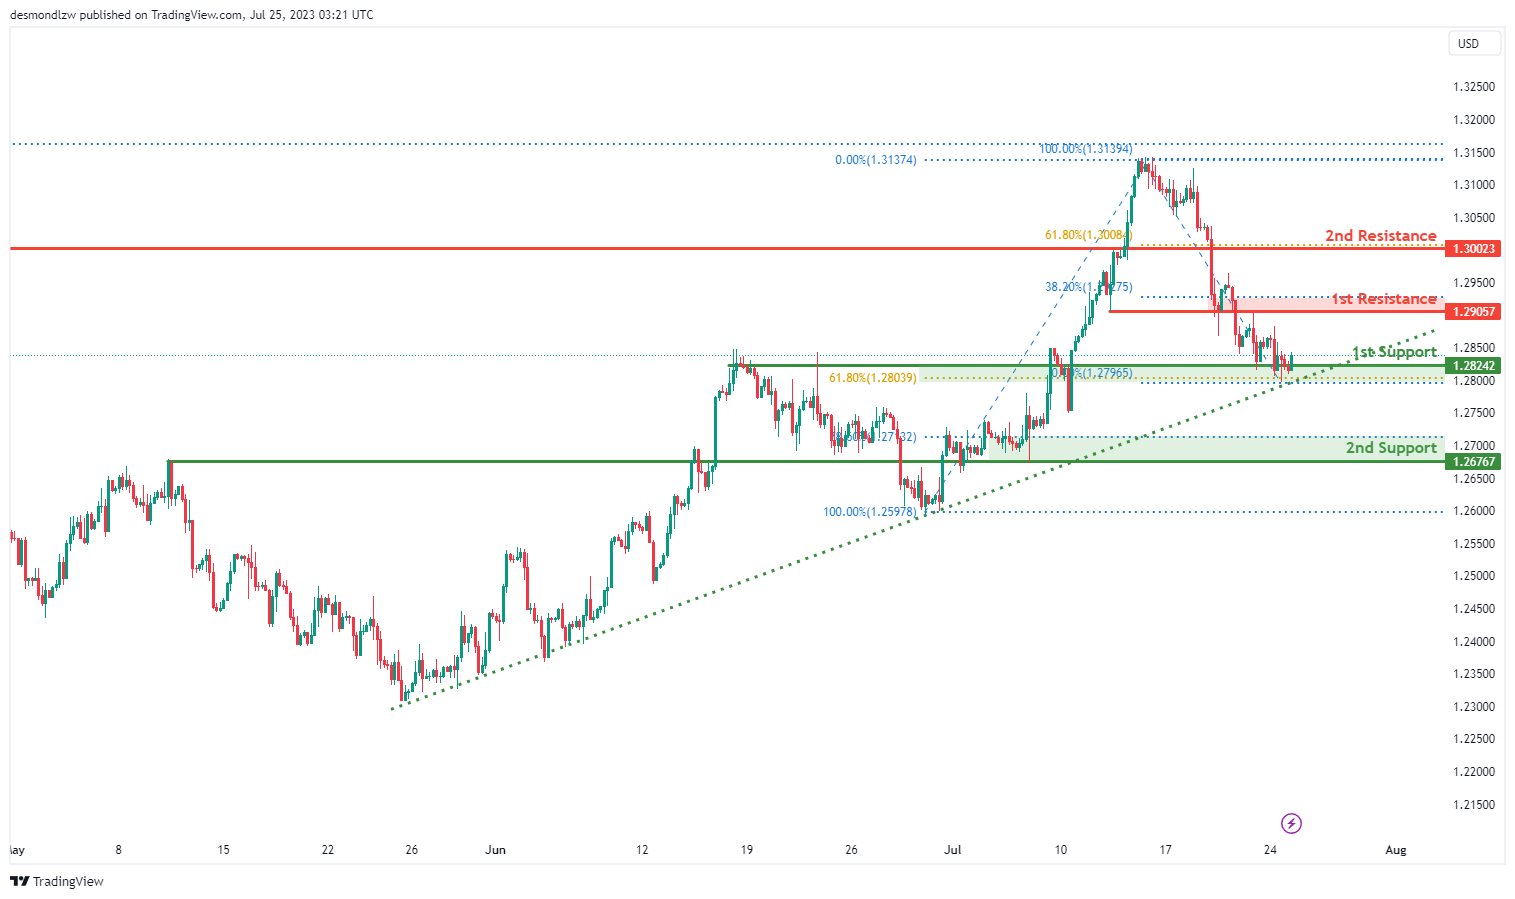
GBP/USD:
The GBP/USD chart shows a bullish momentum, with the price above a major ascending trend line, indicating the potential for further upward movement.
A possible scenario is a bullish bounce off the 1st support level at 1.2824, coinciding with the 61.80% Fibonacci retracement, leading the price towards the 1st resistance at 1.2905. This resistance level is an overlap resistance, also aligned with the 38.20% Fibonacci retracement.
Moreover, the 2nd support at 1.2676 acts as another overlap support, corresponding to the 78.60% Fibonacci retracement. On the upside, the 2nd resistance at 1.3002 represents a pullback resistance, coinciding with the 61.80% Fibonacci retracement. These support and resistance levels are important factors that may influence the price’s movement.
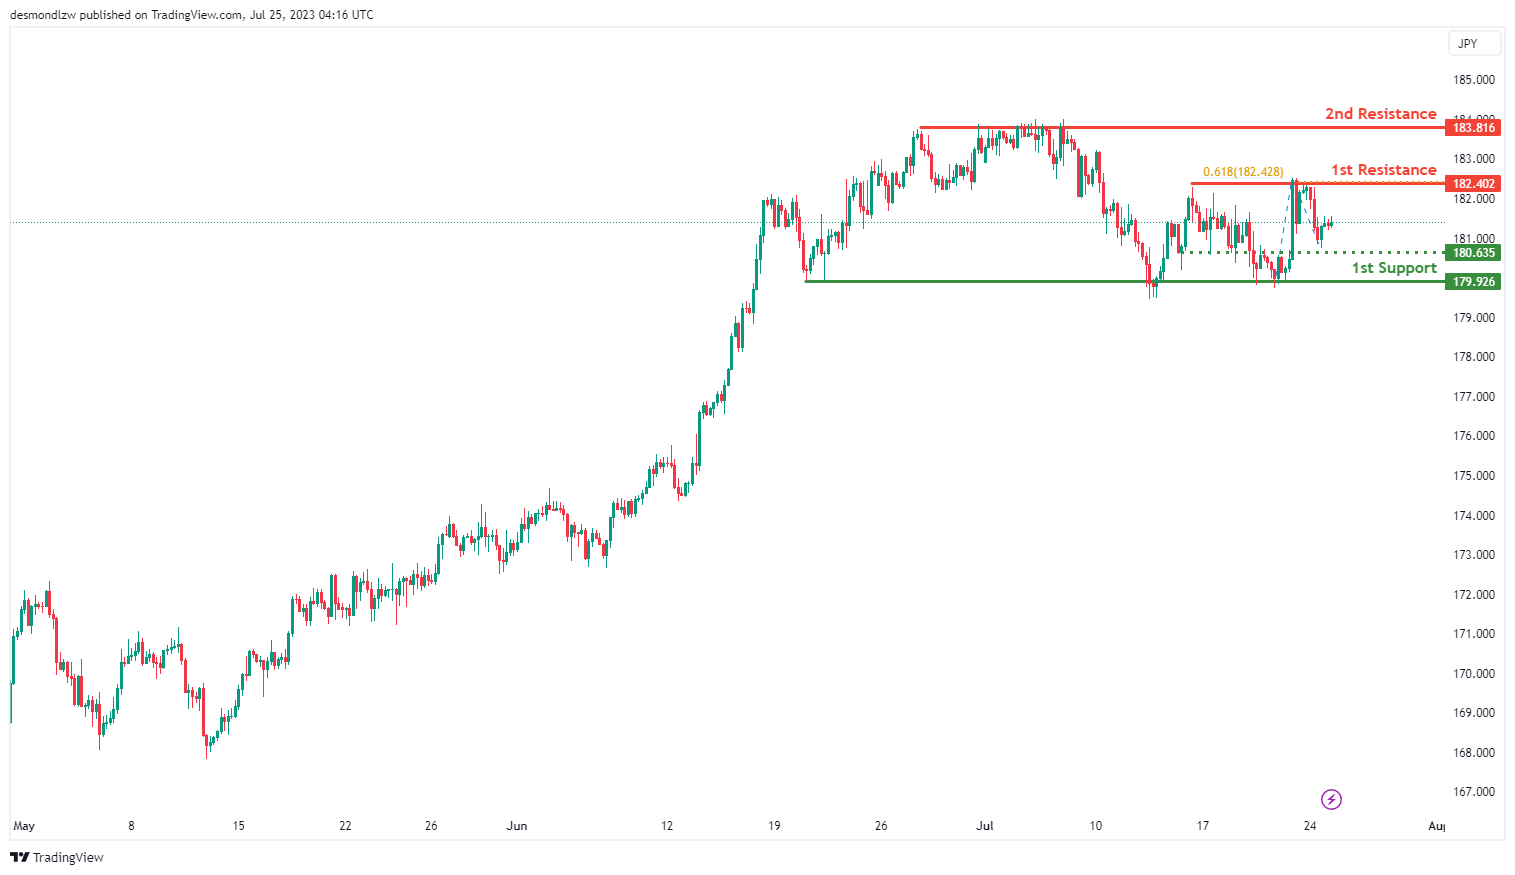
GBP/JPY:
The GBP/JPY chart is currently displaying a neutral momentum, with the price expected to fluctuate between the 1st resistance and 1st support levels.
The 1st support level, located at 179.92, represents a multi-swing low support. This could serve as a significant point of buying interest, halting downward movement.
The intermediate support level is at 180.63 and serves as an overlap support, offering additional potential buying interest.
On the other hand, the 1st resistance level, at 182.40, is a multi-swing high resistance that also coincides with the 61.80% Fibonacci projection level. This could potentially signify a point of selling pressure, potentially reversing the price trend.
The 2nd resistance level is at 183.81, representing another multi-swing high resistance. This level could serve as an additional selling pressure point, likely limiting further price ascents.
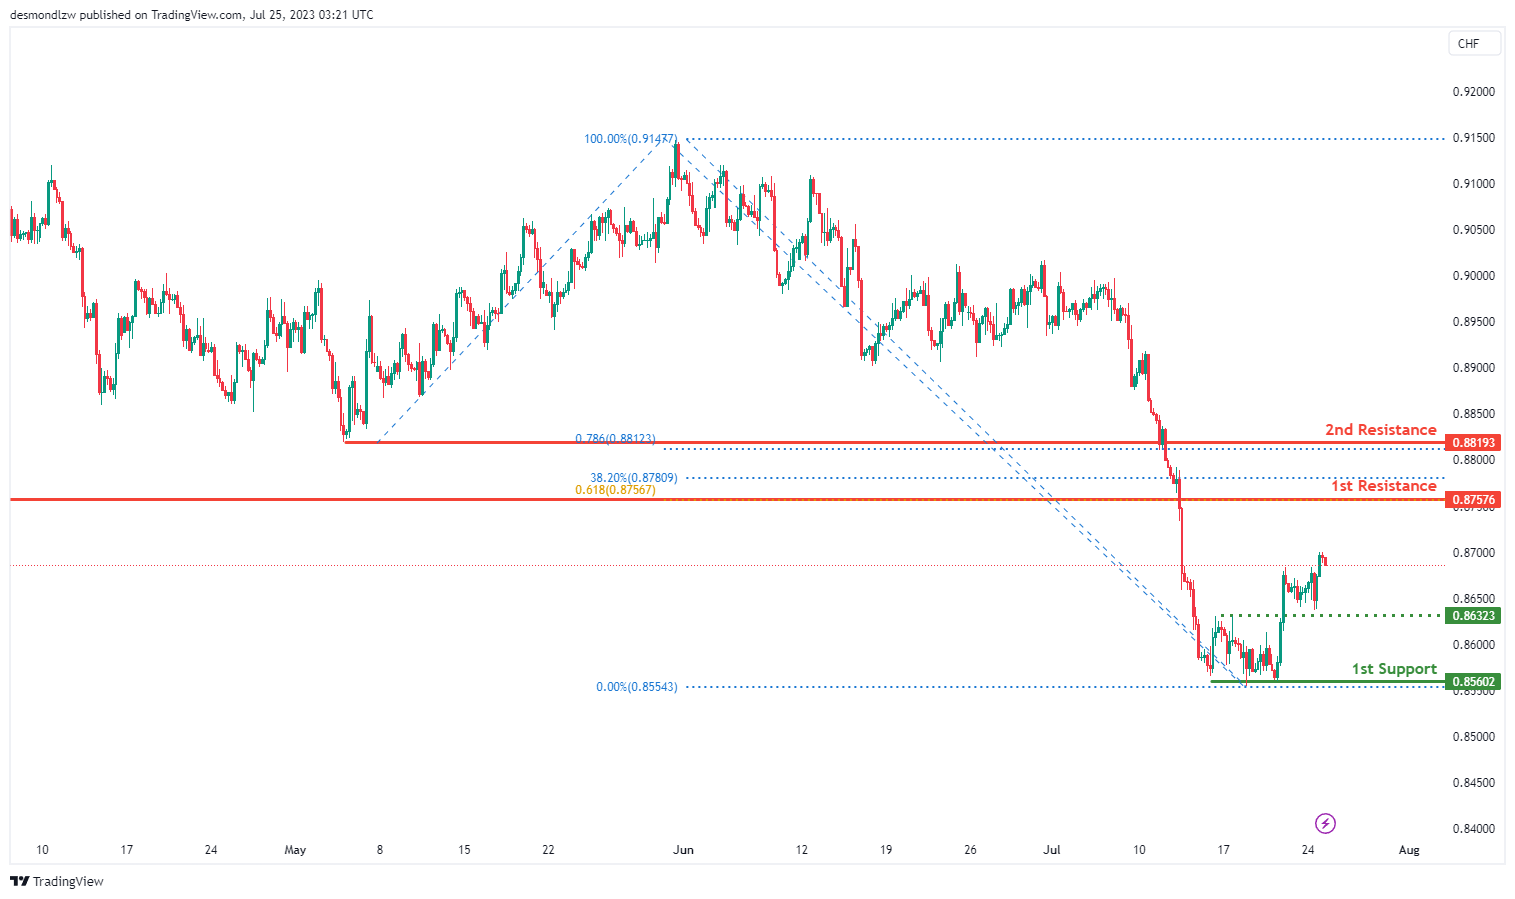
USD/CHF:
The USD/CHF chart indicates a bullish momentum, suggesting a potential continuation of the upward movement towards the 1st resistance level.
The 1st support at 0.8560 is significant as it represents a multi-swing low support. Additionally, the intermediate support at 0.8632 acts as an overlap support.
On the upside, the 1st resistance at 0.8757 is an important level, coinciding with a pullback resistance, the 38.20% Fibonacci retracement, and the 61.80% Fibonacci projection, indicating a Fibonacci confluence. Furthermore, the 2nd resistance at 0.8819 serves as a pullback resistance, aligned with the 78.60% Fibonacci projection.
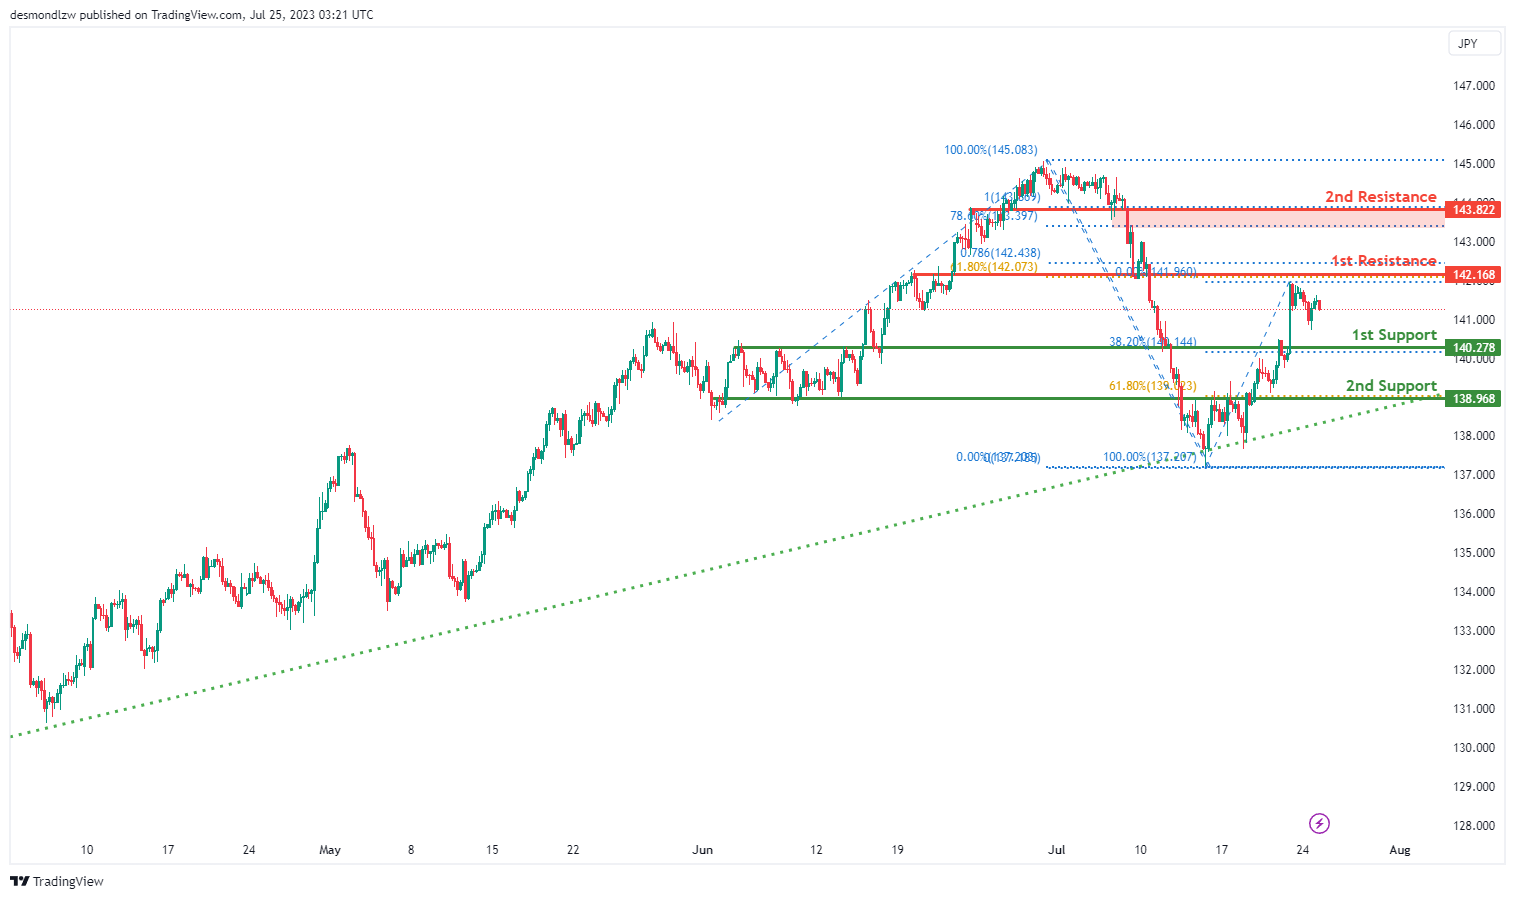
USD/JPY:
The USD/JPY chart exhibits a prevailing bullish momentum, underlined by the price remaining above a significant ascending trend line. This indicates a strong potential for further upward movement in the market.
In the near term, there is a likelihood of a price retracement towards the 1st support level located at 140.27. This support level is reinforced by the 38.20% Fibonacci retracement, making it a crucial pullback support. Subsequently, a price rebound from this level may lead to an upward advance towards the 1st resistance level at 142.16. This resistance level holds notable importance, as it coincides with both an overlap resistance and the 61.80% Fibonacci retracement, further reinforced by the presence of the 78.60% Fibonacci projection, indicating a confluence of Fibonacci levels. Additionally, the 2nd resistance level at 143.82 acts as another significant pullback resistance, also aligned with the 78.60% Fibonacci projection.
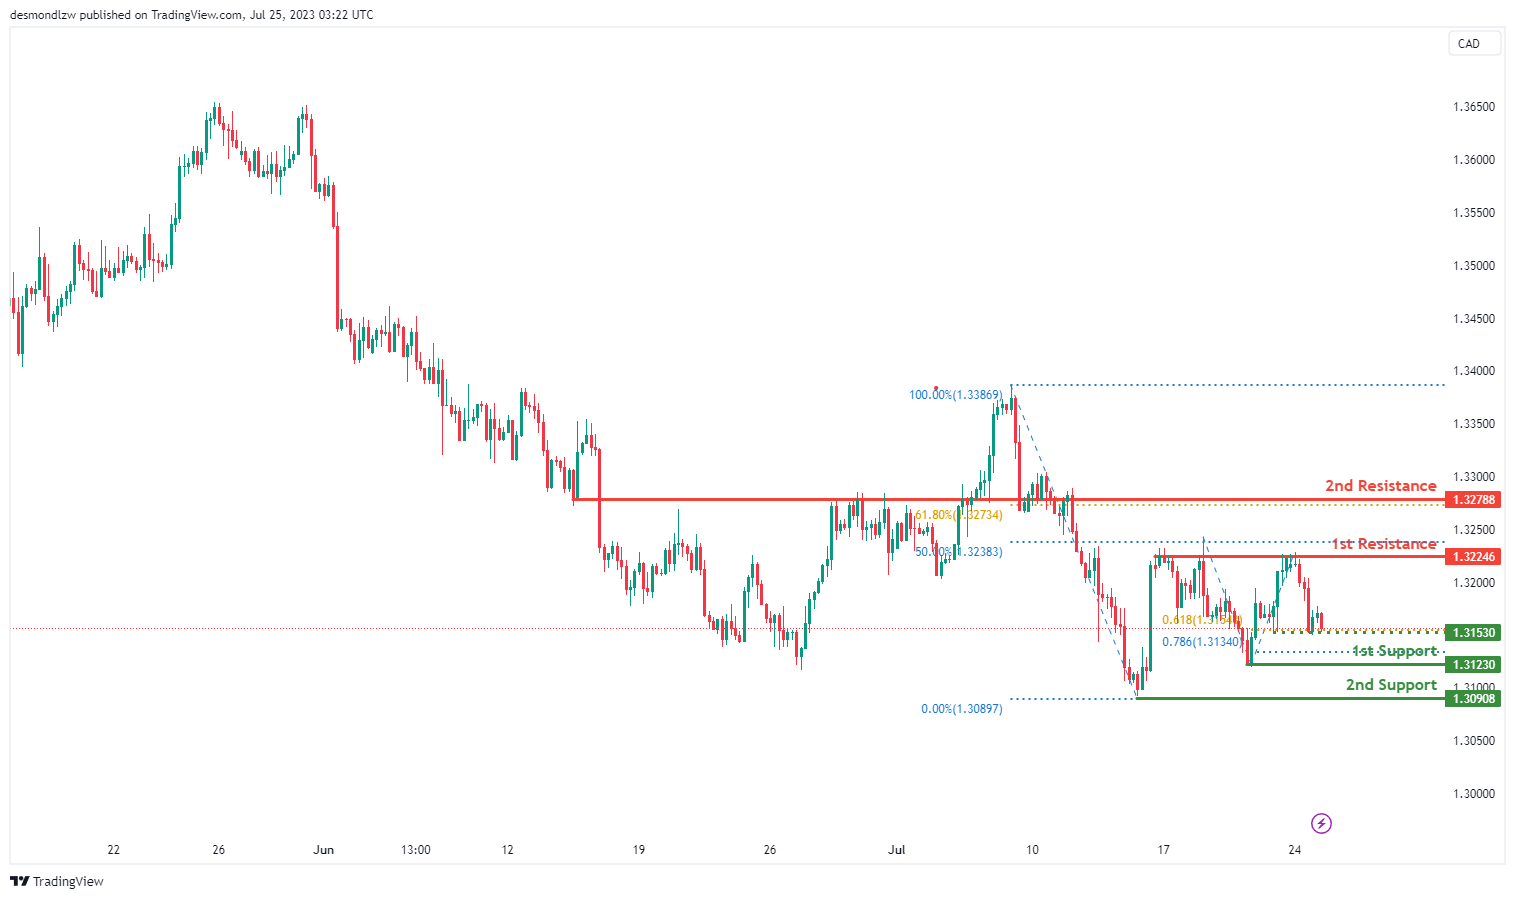
USD/CAD:
The USD/CAD chart displays a prevailing bearish momentum, indicating a potential continuation of the downward movement.
In the event of further decline, the 1st support level at 1.3123 holds significance as it aligns with a swing low support and the 78.60% Fibonacci projection, adding to its importance. Additionally, the 2nd support at 1.3090 represents another swing low support level.
On the upside, the 1st resistance at 1.3278 acts as a notable multi-swing high resistance, coinciding with the 50% Fibonacci retracement. Moreover, the 2nd resistance at 1.3278 serves as a pullback resistance and aligns with the 61.80% Fibonacci retracement.
Furthermore, there is an intermediate support at 1.3153, which is a multi-swing low support and is reinforced by the 61.80% Fibonacci projection.
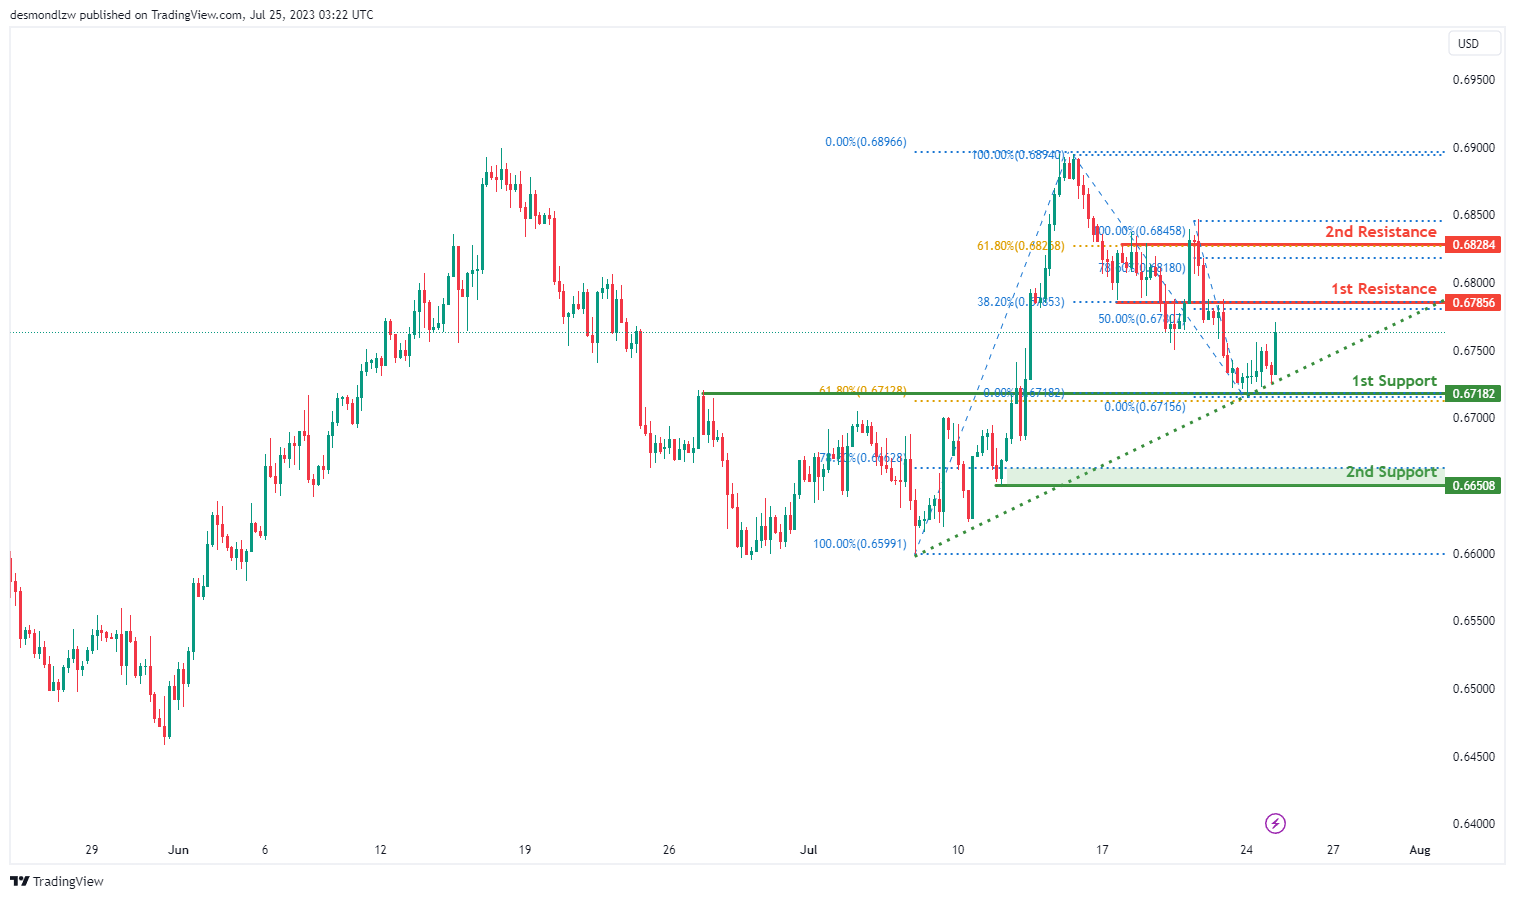
AUD/USD:
The AUD/USD chart demonstrates a prevailing bullish momentum, with the price above a major ascending trend line, suggesting the potential for further upward movement.
In the event of continued bullishness, the 1st support level at 0.6718 holds significance as it aligns with an overlap support and the 61.80% Fibonacci retracement, adding to its importance. Additionally, the 2nd support at 0.6650 represents another support level, coinciding with the 78.60% Fibonacci retracement.
On the upside, the 1st resistance at 0.6785 acts as a notable overlap resistance, coinciding with the 50% Fibonacci retracement and the 38.20% Fibonacci retracement, indicating Fibonacci confluence. Moreover, the 2nd resistance at 0.6828 represents a multi-swing high resistance and aligns with the 61.80% Fibonacci retracement.
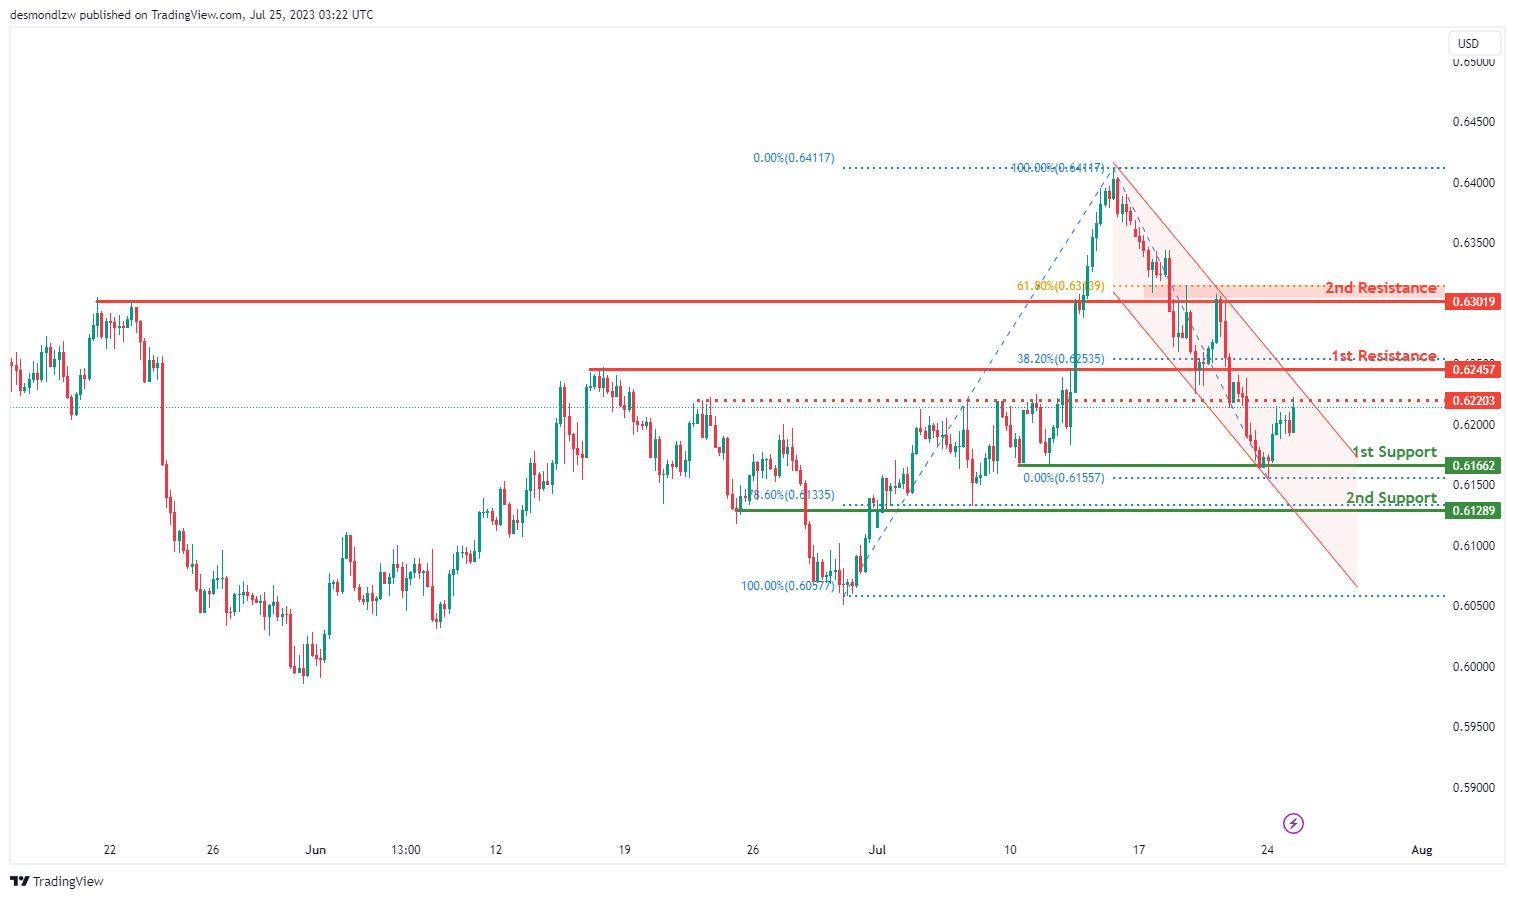
NZD/USD
The NZD/USD chart shows a clear bearish momentum, as the price is currently within a descending channel, indicating the potential for further downward movement.
Considering the bearish scenario, a possible price action could involve a bearish reaction off the 1st resistance level at 0.6245, which aligns with an overlap resistance and the 38.20% Fibonacci retracement. This reaction might lead the price to drop towards the 1st support at 0.6166, identified as a multi-swing low support.
Furthermore, the 2nd support level at 0.6128 represents another crucial area as it coincides with the 78.60% Fibonacci retracement, providing additional support against further downward movement.
On the other hand, intermediate resistance at 0.6220 acts as an overlap resistance, while the 2nd resistance at 0.6301 rep
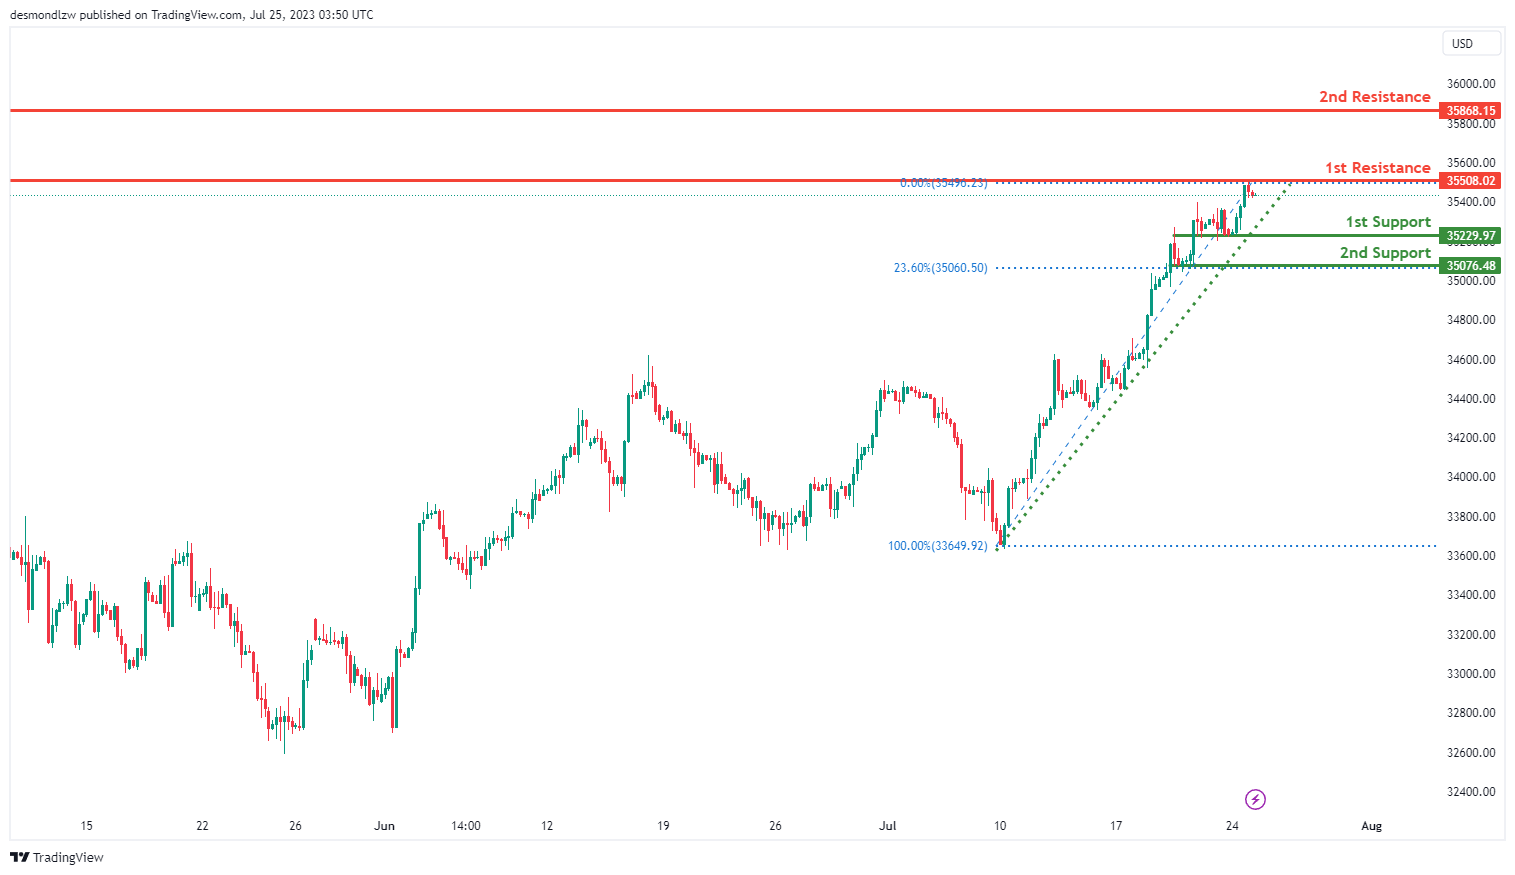
DJ30:
The DJ30 (Dow Jones Industrial Average) chart exhibits a bullish momentum, underlined by the fact that the price is above a major ascending trend line, thereby suggesting a potential continuation of this bullish trend towards the 1st resistance level.
The 1st support level is situated at 35229.97 and acts as a pullback support, which could indicate an area where the price may find buying interest.
The 2nd support level, standing at 35076.48, also functions as a pullback support and coincides with the 23.60% Fibonacci retracement level. This level could offer additional buying interest, fortifying the lower boundaries of the price movement.
On the upside, the 1st resistance level is pegged at 35508.02 and represents a multi-swing high resistance, indicating potential selling pressure which might cause a price pullback.
The 2nd resistance level, marked at 35868.15, corresponds to a swing high resistance level, suggesting another potential area of selling interest which might lead to a further price downturn upon reaching this level.
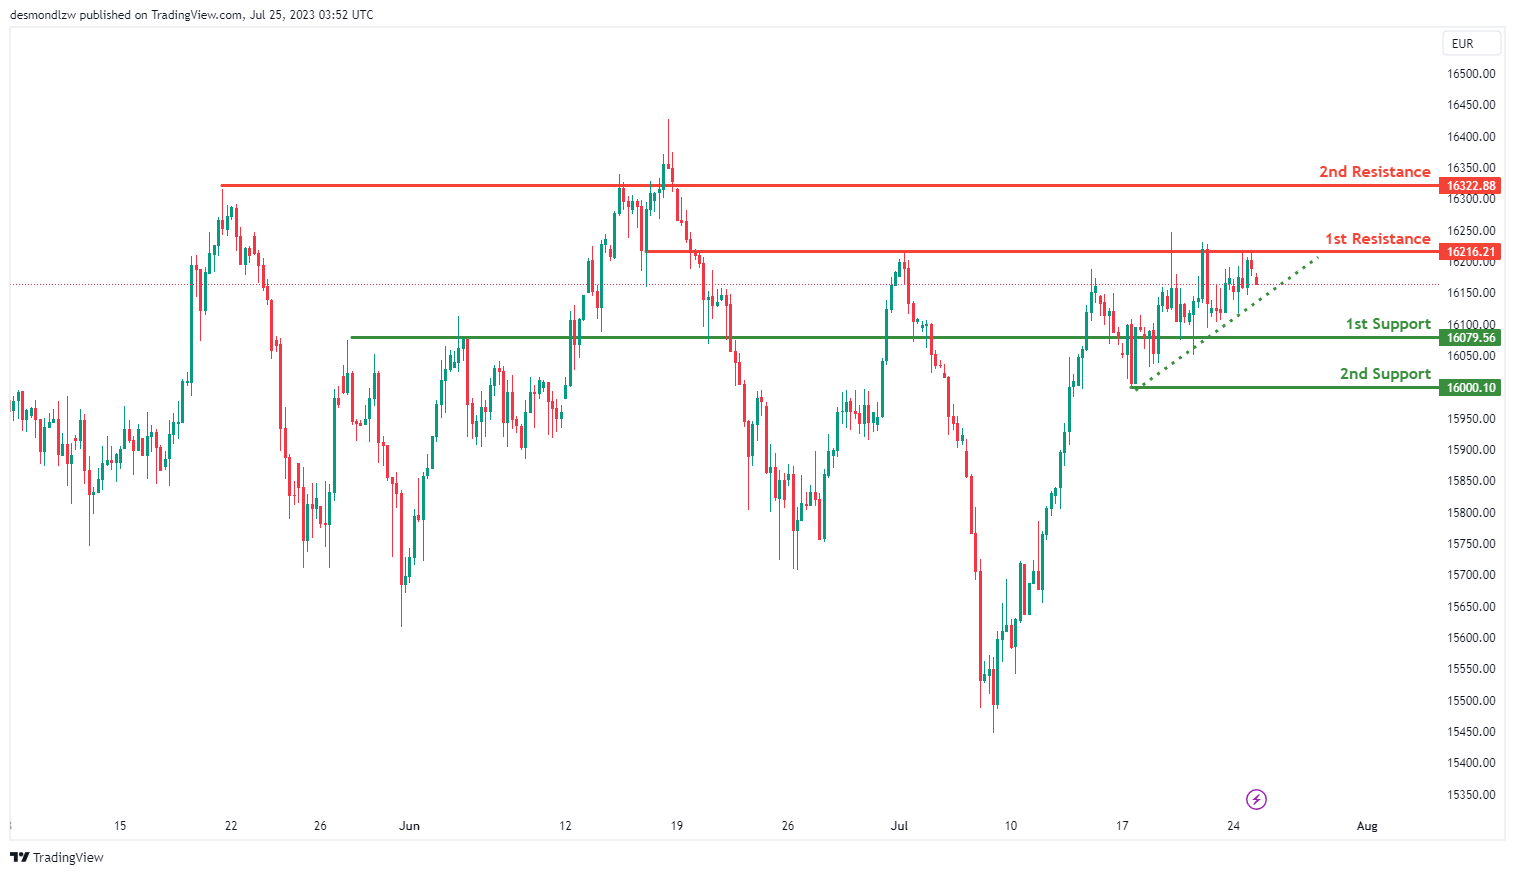
GER30:
The GER30 (DAX) chart is presently exhibiting a bearish momentum. Interestingly, the price is above a major ascending trend line, suggesting the possibility of further bullish momentum, but a bearish continuation towards the 1st support level is expected.
The 1st support level is identified at 16079.56, acting as an overlap support. This level could serve as a potential area of buying interest, possibly causing a price bounce.
The 2nd support level is situated at 16000.10, functioning as a swing low support, indicating another potential region where buyers could step in and drive the price upward.
In terms of resistance, the 1st resistance level is located at 16216.21. This level, recognized as an overlap resistance, could provide significant selling pressure, potentially halting any upward price movements.
Similarly, the 2nd resistance level, marked at 16322.88, is also an overlap resistance, which could act as an additional barrier to any upward price momentum.
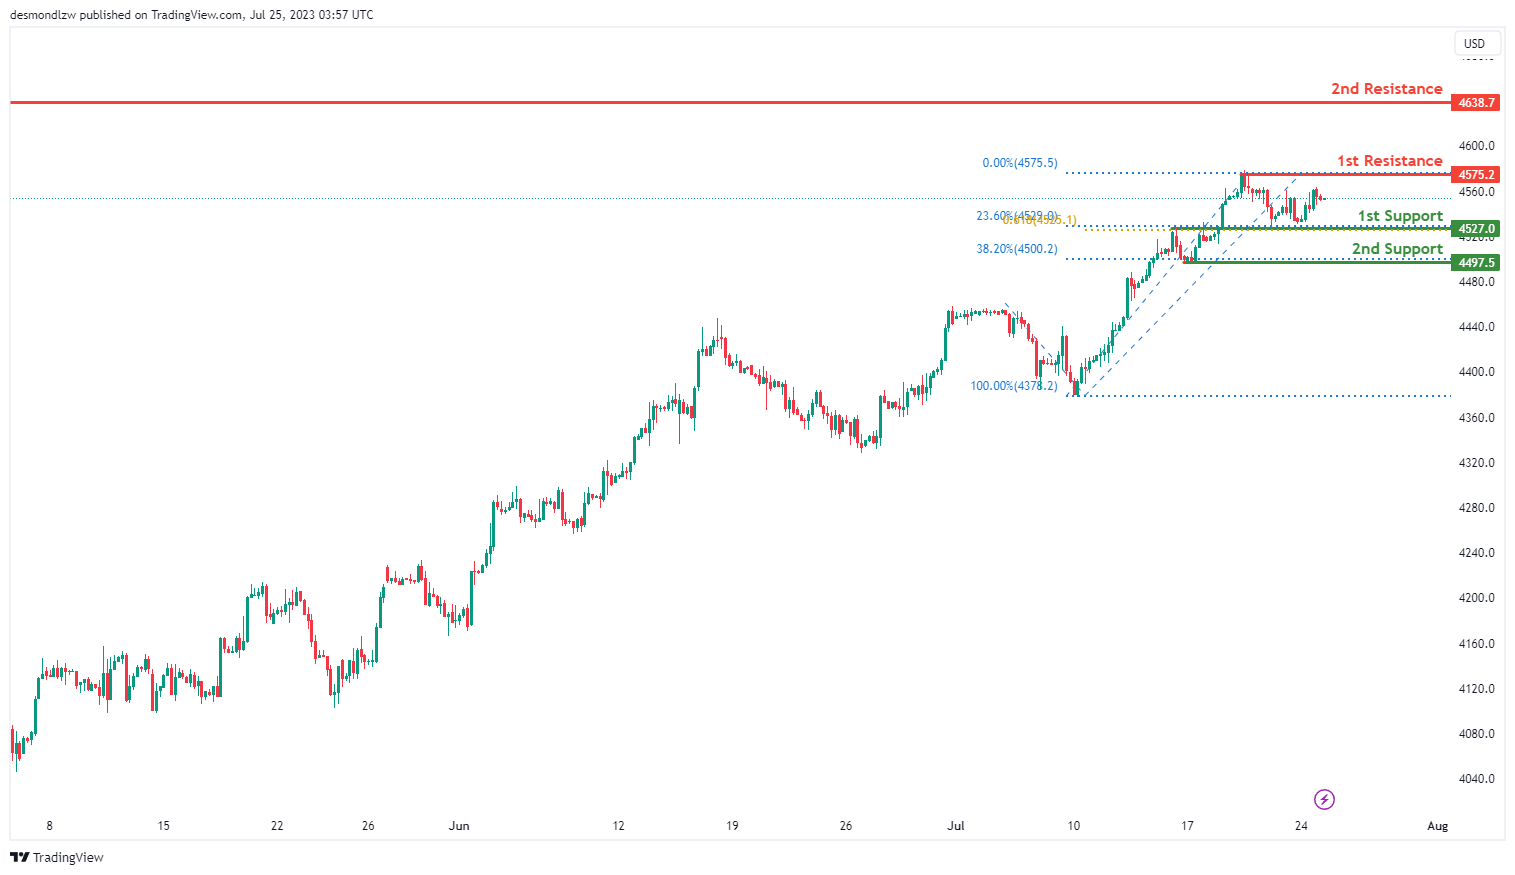
US500
The US500 (S&P 500) chart currently presents a neutral momentum, suggesting that the price could fluctuate between the 1st resistance and 1st support levels.
The 1st support level is pinpointed at 4527.0 and is identified as a pullback support. This level is further reinforced by the 23.60% Fibonacci retracement and the 61.80% Fibonacci projection, indicating a Fibonacci confluence that could potentially stimulate buying interest.
The 2nd support level stands at 4497.5, representing a swing low support. This level aligns with the 38.20% Fibonacci retracement, potentially serving as another area of buying interest that could stimulate an upward price bounce.
On the other hand, the 1st resistance level is located at 4575.2. This level acts as a swing high resistance and could provide significant selling pressure, potentially stalling any upward price movements.
Furthermore, the 2nd resistance level is marked at 4638.7. It also serves as a swing high resistance and could act as another significant barrier to upward price movements.
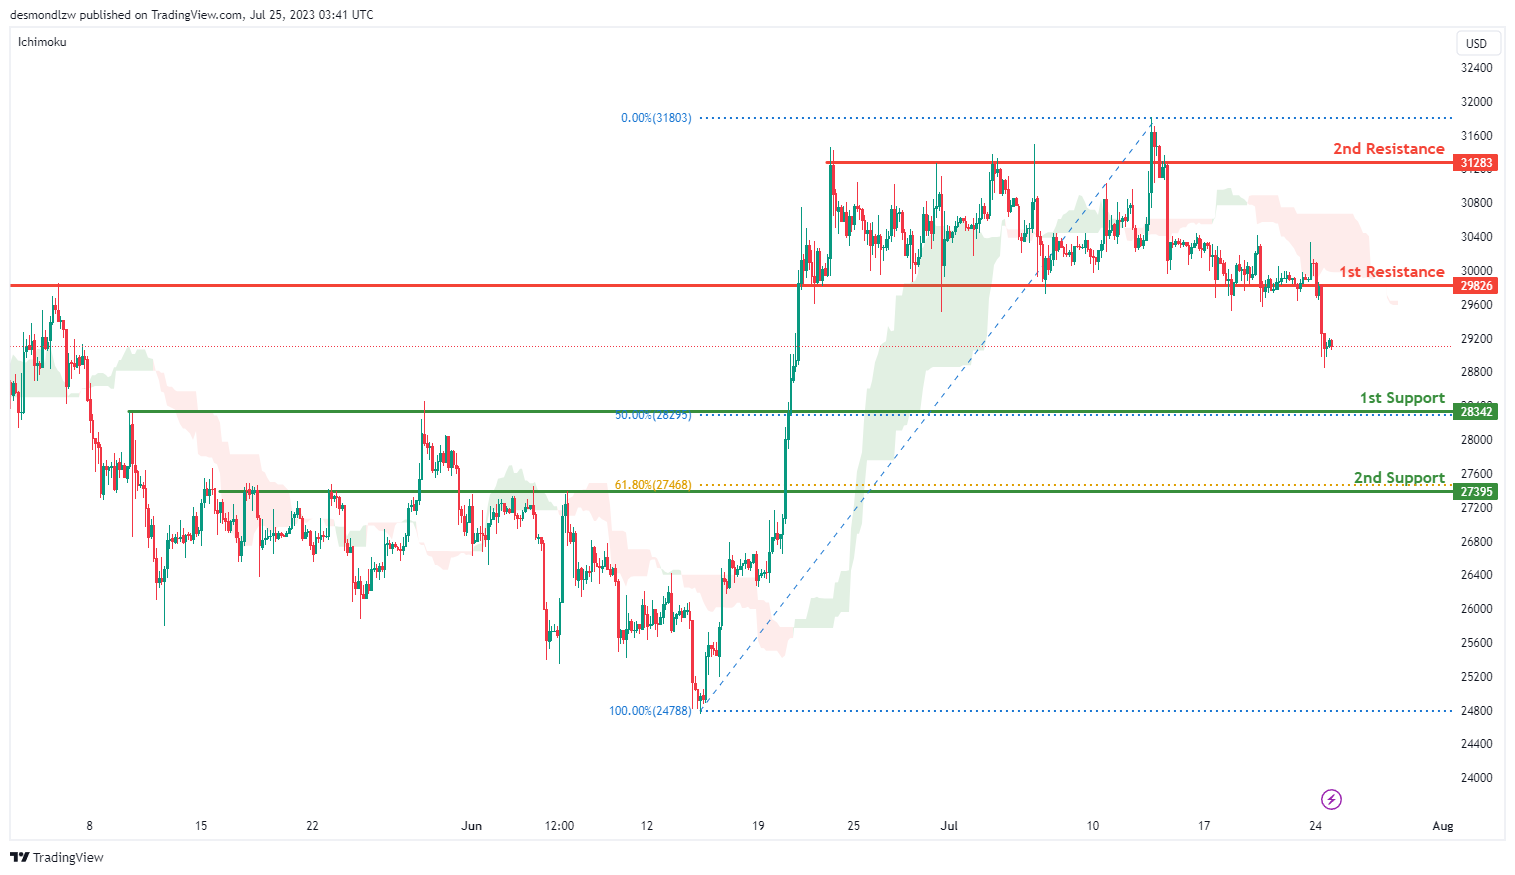
BTC/USD:
The BTC/USD chart currently displays a bearish trend, with the price positioned below the bearish Ichimoku cloud, contributing to the negative momentum. The expectation is for a bearish continuation towards the 1st support level.
The 1st support level, identified at 28342, stands as a pullback support and coincides with the 50% Fibonacci retracement level, suggesting that it could serve as a substantial area of buying interest. A second support level can be found at 27395, which functions as an overlap support and aligns with the 61.80% Fibonacci retracement level, indicating another potential area of significant buying interest.
In terms of resistance, the 1st level is located at 29826 and acts as an overlap resistance. This suggests that it could present a substantial barrier to further price ascents, and potentially attract selling pressure. The 2nd resistance level is found at 31283, also an overlap resistance, implying it could serve as an additional point of selling pressure and a potential obstacle for price growth.
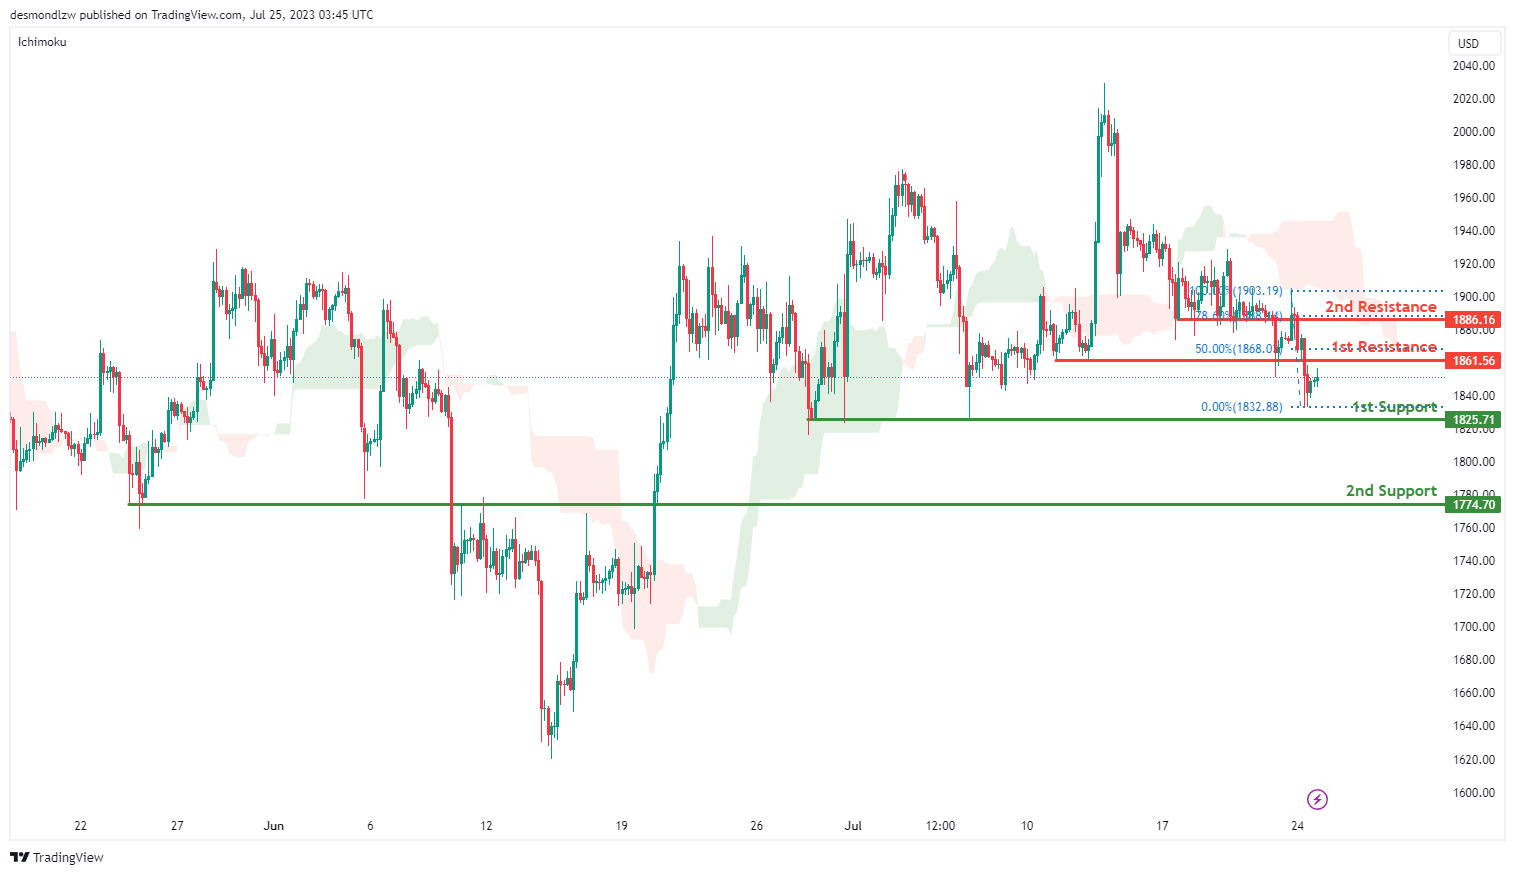
ETH/USD:
The ETH/USD chart is currently demonstrating a bearish momentum, with the price being positioned below the bearish Ichimoku cloud, which suggests an expected bearish continuation towards the 1st support level.
The 1st support level is set at 1825.71, functioning as a multi-swing low support, and could serve as a key area for potential buying interest.
The 2nd support level is found at 1774.70, operating as an overlap support. This level further bolsters the lower boundaries of the price movement and can act as an additional stronghold for buyers.
On the upside, the 1st resistance level is at 1861.56. This pullback resistance coincides with the 50% Fibonacci retracement level, indicating a potential area of selling pressure.
The 2nd resistance level is marked at 1886.16. This overlap resistance also aligns with the 78.60% Fibonacci retracement level, suggesting another significant hurdle for upward price movements, and possibly a region of increased selling pressure.
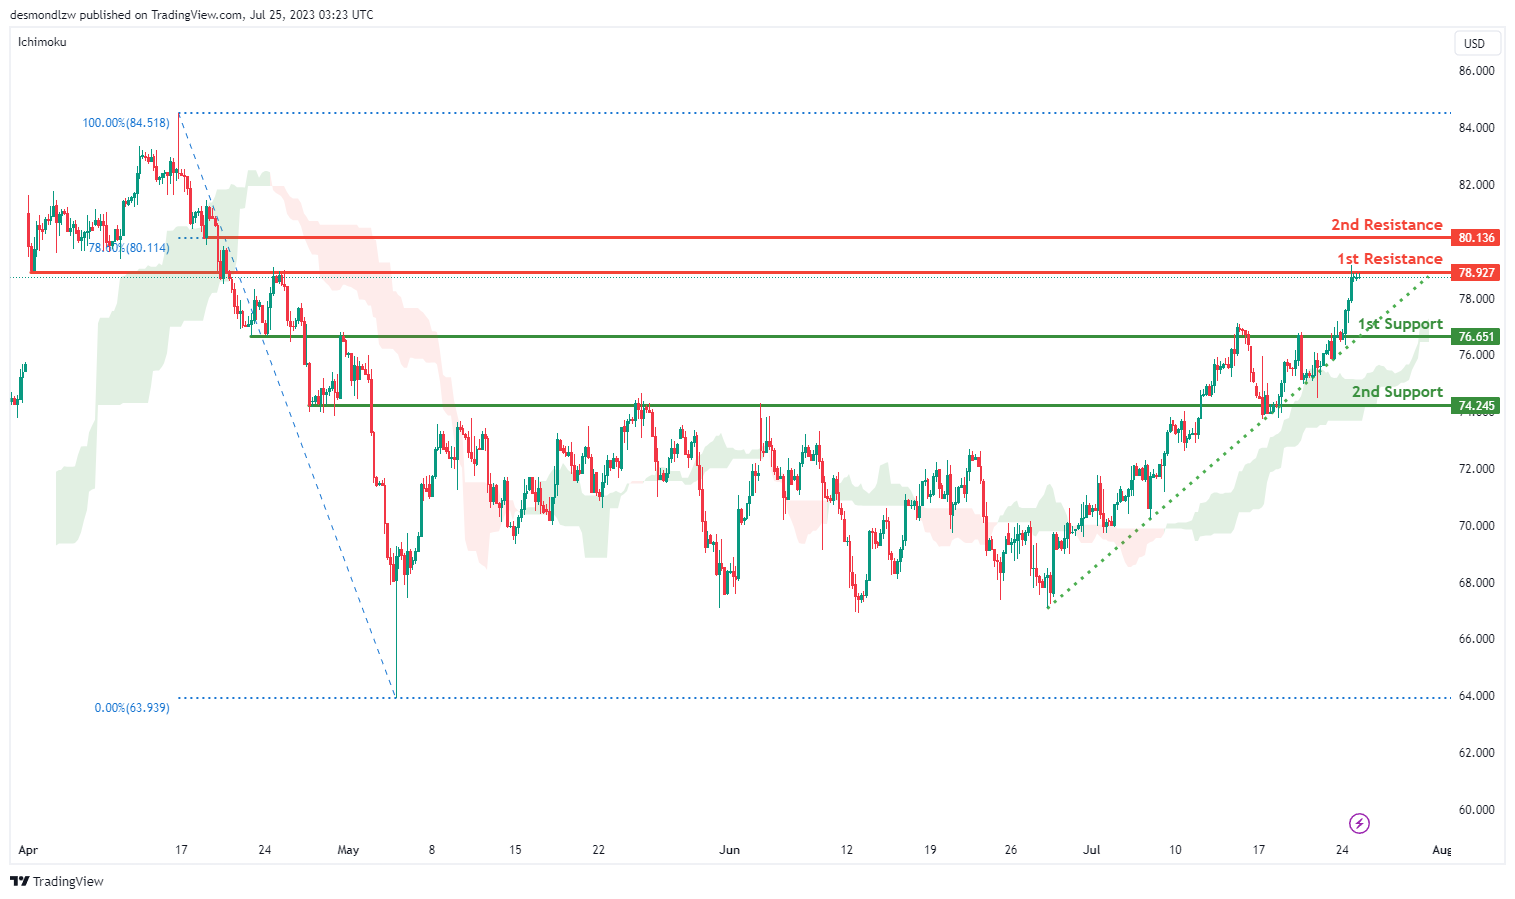
WTI/USD:
The WTI (West Texas Intermediate) chart displays a bullish momentum, supported by the fact that the price is above the bullish Ichimoku cloud and follows an ascending trend line, which acts as a support line.
However, despite the overall bullish momentum, a possible scenario indicates a potential bearish reaction off the 1st resistance level at 78.92. This resistance level is considered an overlap resistance, suggesting a possible price pullback towards the 1st support at 76.65, which is recognized as a pullback support.
Should the bearish reaction continue, the 2nd support at 74.24 may act as another essential area, functioning as an overlap support.
On the other hand, the 2nd resistance at 80.13 represents a significant level, coinciding with the 78.60% Fibonacci retracement, and may provide resistance against further upward movement.
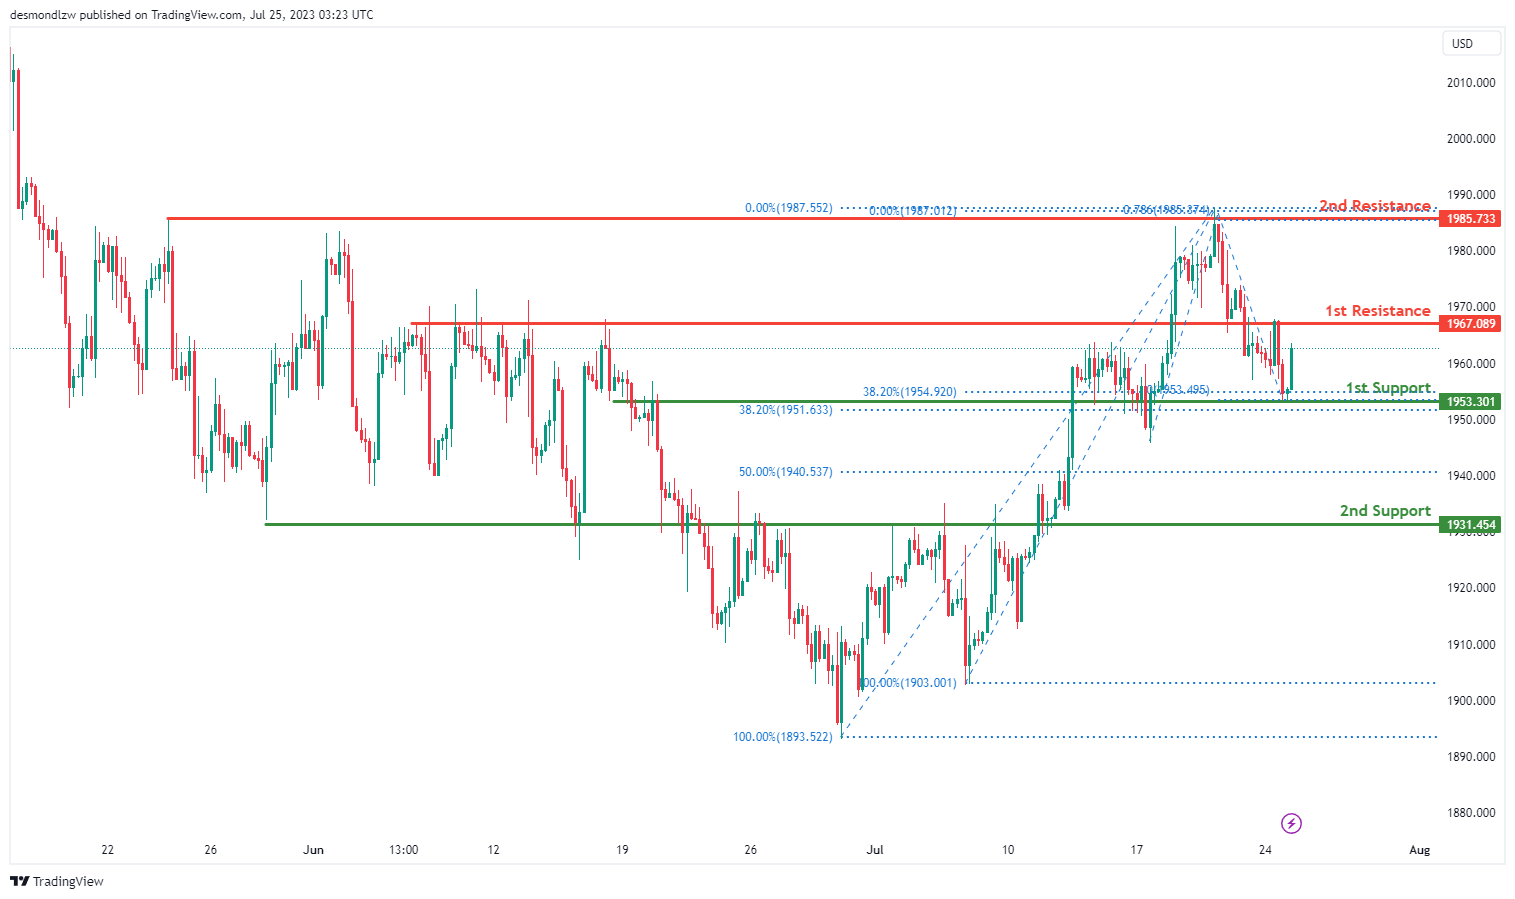
XAU/USD (GOLD):
The XAU/USD (Gold against the US Dollar) chart indicates a bullish momentum, suggesting the potential for further upward movement.
In this scenario, a possible continuation towards the 1st resistance at 1967.08 is anticipated. This resistance level is recognized as an overlap resistance, which could potentially hinder the price’s upward progress.
On the downside, the 1st support at 1953.30 is considered crucial, as it aligns with the 38.20% Fibonacci retracement and another 38.20% Fibonacci retracement, indicating a Fibonacci confluence. Additionally, the 2nd support at 1931.45 acts as an overlap support, further reinforcing its significance as a potential price floor.
In case of further bullish momentum, the 2nd resistance at 1985.73 is identified as a multi-swing high resistance, indicating a challenging barrier for the price.


