
Key Highlights
- USD/JPY climbed higher above the 141.00 resistance zone.
- A major bearish trend line is forming with resistance near 142.50 on the 4-hour chart.
- EUR/USD reacted to the downside below the 1.1050 support.
- The US GDP surprised with 2.4% growth in Q2 2023 (Prelim).
USD/JPY Technical Analysis
The US Dollar remained well-bid above the 139.50 level against the Japanese Yen. USD/JPY started a decent increase above the 140.00 and 140.20 resistance levels.
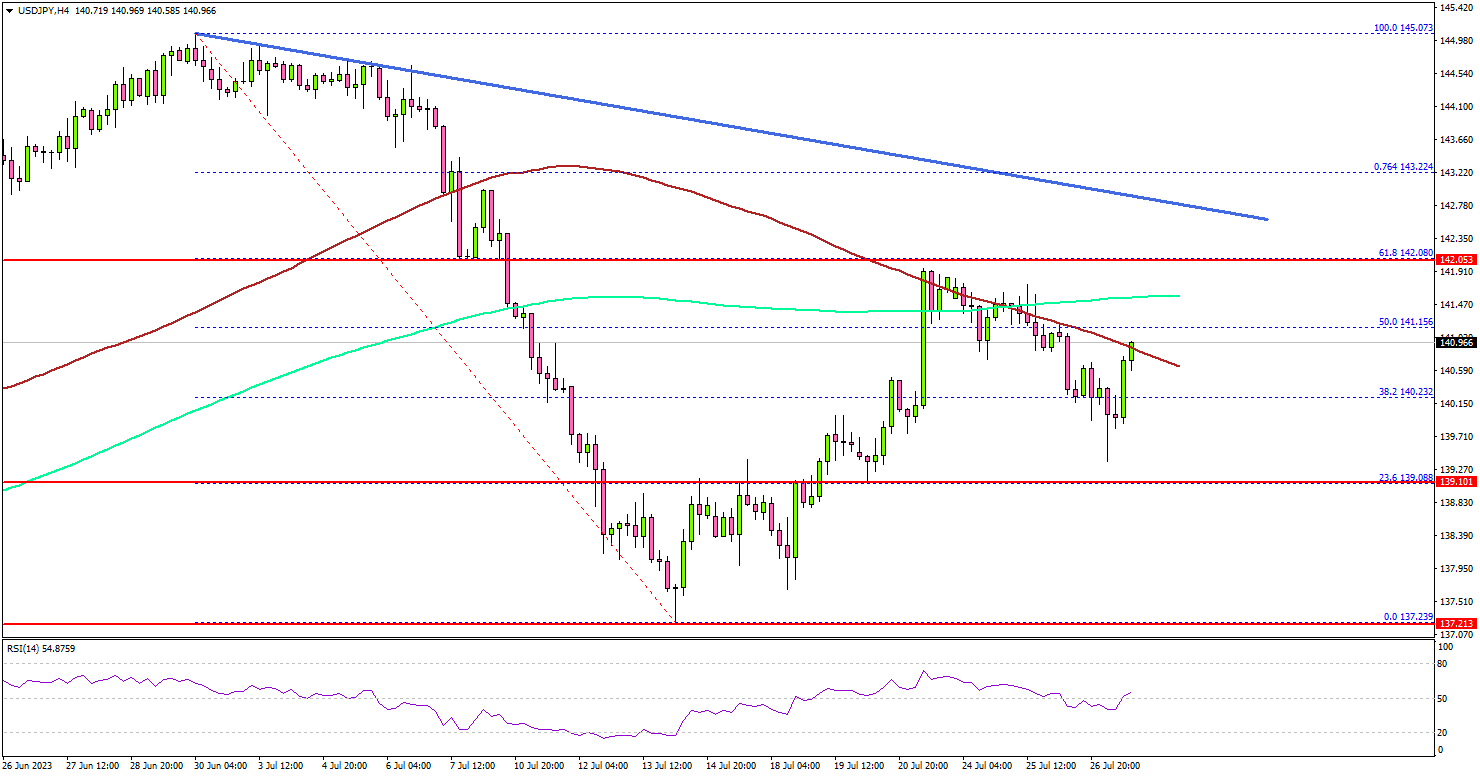
Looking at the 4-hour chart, the pair gained bullish momentum after a sharp 2.4% rise in the US GDP in Q2 2023. There was a move above the 141.00 resistance zone and the 100 simple moving average (red, 4 hours).
The first major resistance is near the 142.00 zone or the 200 simple moving average (green, 4 hours). There is also a major bearish trend line forming with resistance near 142.50 on the same chart.
Any more gains might send the pair toward the 143.20 level. On the downside, the pair might find bids near the 142.25 level. The next major support is near 140.00, below which USD/JPY could slide toward the 139.50 zone.
Looking at EUR/USD, there was a sharp bearish reaction below 1.1050 after the US GDP report and there is a risk of more losses.
Economic Releases
- German Consumer Price Index for July 2023 (YoY) – Forecast +6.2%, versus +6.4% previous.
- German Consumer Price Index for July 2023 (MoM) – Forecast +0.3%, versus +0.3% previous.
- US Personal Income for July 2023 (MoM) – Forecast +0.5%, versus +0.4% previous.


